sfdx-dpro-plugin


$ npm install -g sfdx-dpro-plugin
$ sfdx-dpro-plugin COMMAND
running command...
$ sfdx-dpro-plugin (-v|--version|version)
sfdx-dpro-plugin/0.0.2 darwin-x64 node-v8.11.1
$ sfdx-dpro-plugin --help [COMMAND]
USAGE
  $ sfdx-dpro-plugin COMMAND
...
sfdx-dpro-plugin dpro:projects:build
Build 3rd party frontend apps. To specify a project folders that includes spaces, enclose it in single quotes.
USAGE
  $ sfdx-dpro-plugin dpro:projects:build

OPTIONS
  -d, --directory=directory                       Directrory of frontend apps {default: ./frontend-apps}
  -f, --projects=projects                         Comma separated list of project names that needs to be build
  --json                                          format output as json
  --loglevel=(trace|debug|info|warn|error|fatal)  logging level for this command invocation
  --version                                       show CLI version

EXAMPLES
  $ sfdx dpro:projects:build --directory <path to projects folder> --projects <comma separated project folder names>
  $ sfdx dpro:projects:build -d <path to projects folder>
See code: src/commands/dpro/projects/build.ts
Debugging your plugin
We recommend using the Visual Studio Code (VS Code) IDE for your plugin development. Included in the .vscode directory of this plugin is a launch.json config file, which allows you to attach a debugger to the node process when running your commands.
To debug the dpro:projects:build command:
- Start the inspector
If you linked your plugin to the sfdx cli, call your command with the dev-suspend switch:
$ sfdx dpro:projects:build -d ./frontend-apps --dev-suspendAlternatively, to call your command using the bin/run script, set the NODE_OPTIONS environment variable to --inspect-brk when starting the debugger:
$ NODE_OPTIONS=--inspect-brk dpro:projects:build -d ./frontend-apps- Set some breakpoints in your command code
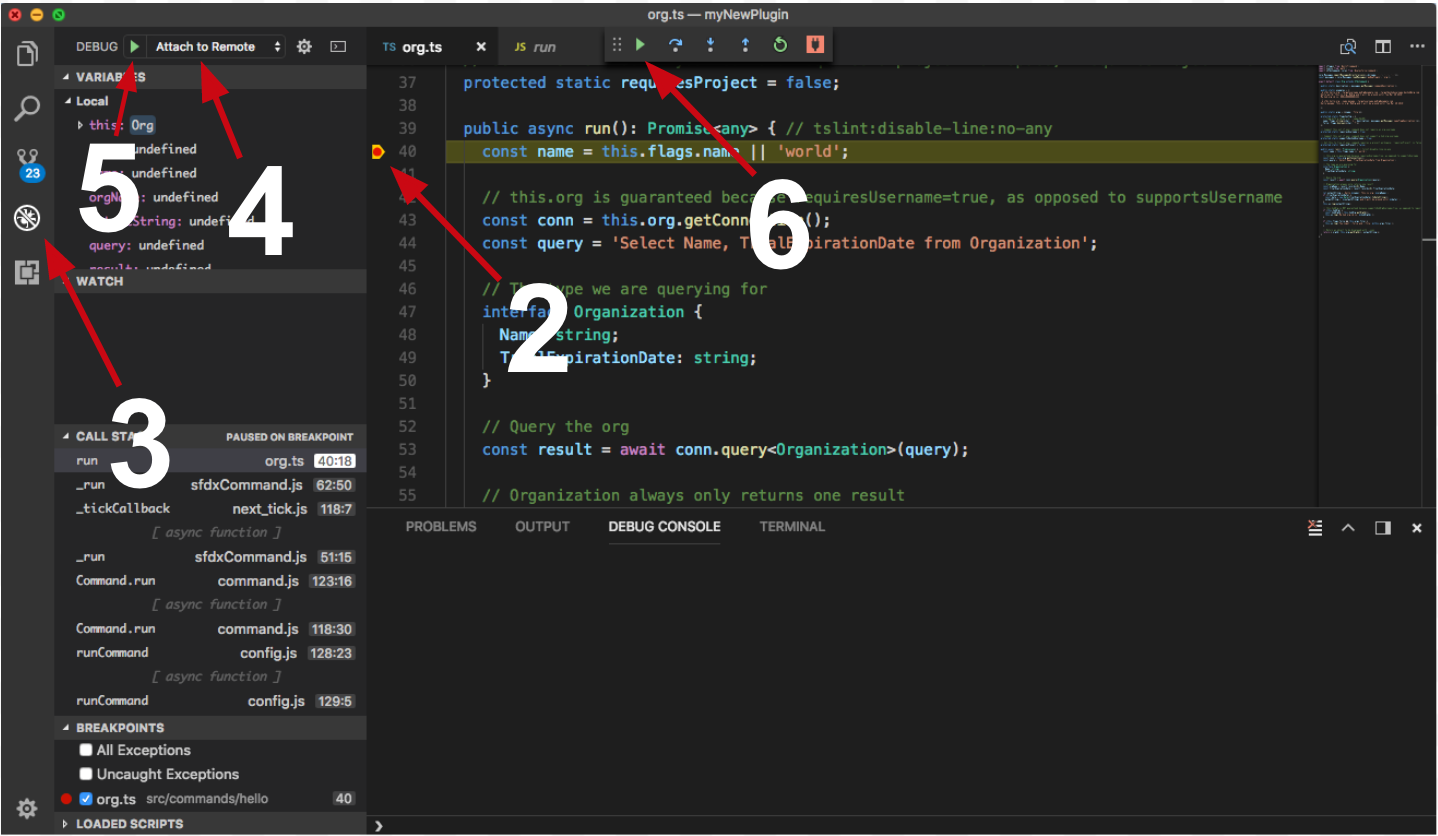
- Click on the Debug icon in the Activity Bar on the side of VS Code to open up the Debug view.
- In the upper left hand corner of VS Code, verify that the "Attach to Remote" launch configuration has been chosen.
- Hit the green play button to the left of the "Attach to Remote" launch configuration window. The debugger should now be suspended on the first line of the program.
- Hit the green play button at the top middle of VS Code (this play button will be to the right of the play button that you clicked in step #5).
Congrats, you are debugging!
