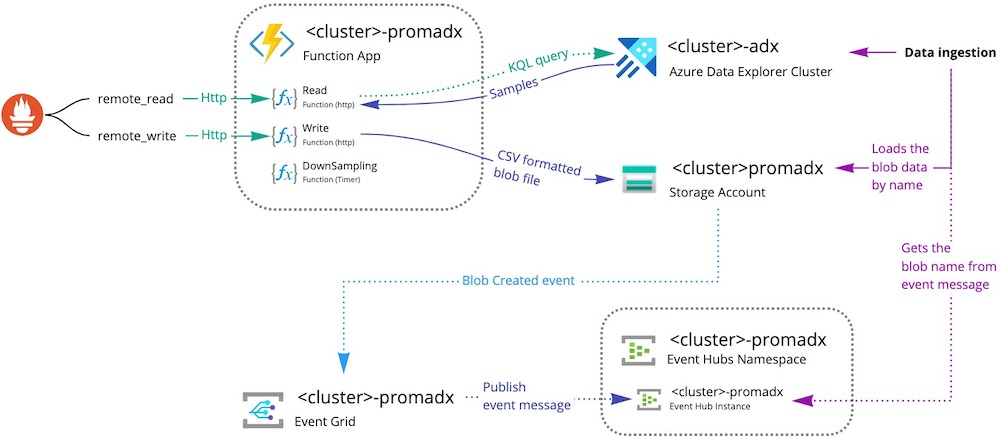
This is a production-ready implementation of Prometheus remote storage adapter for Azure Data Explorer (a fast, fully managed data analytics service for real-time analysis on large volumes of data streaming).
The idea and first start for this project (previously it was a fork) became possible thanks to PrometheusToAdx repository.
The major functionality features:
- Uses azure funtions;
- Fully workable remote read/write;
- Possible to write a large amounts of metrics because of ingesting data via sets of
blobstorage->eventgrid->eventhubchain (see integration principe bellow); - Does downsampling for old metrics for save db size.
| Resource | Resource Type |
|---|---|
<cluster>-prometheus-adx |
Service Principal |
<cluster>-prometheus-adx |
Function App |
<cluster>-adx |
Azure Data Explorer Cluster |
<cluster>prometheusadx |
Storage Account |
<cluster>-prometheus-adx |
Event Hub Namespace |
<cluster>-prometheus-adx |
Event Hub Instance |
<cluster>-prometheus-adx |
Event Grid Subscription |
- Create
Service Principalaccount; - Create
Storage Account; - Create
Azure Data Explorer Cluster; - Create
Function App; - Add
ContributorforService Principalaccount; - Add
AdminforAzure Data Explorer Clusterdatabase (only for database); - Create
Event Hub NamespacewithEvent HubInstance - Create
Event Grid Subscriptionwith following options:- Topic type - Storage Accounts
- Topic resource -
Storage Account(2) - Filter event type - Blob created
- Endpoint details -
Event Hub(7)
- Create database
<cluster>-prometheusinAzure Data Explorer Cluster:- Permissions: Add
Viewrole forService Principal(1) - Create tables
RawData,Metrics(KQL bellow) - Data injestion:
- Connection type - Blob storage
- Storage Account / Event Grid -
Storage Account(2) andEvent Grid Subscription(8) - Event type - Blob created
- Table - Metrics
- Data format - CSV
- Mapping name - CsvMapping
- Permissions: Add
.drop table Metrics ifexists
.drop table RawData ifexists

.create table RawData (Datetime: datetime, Timestamp: long, Name: string, Instance: string, Job: string, Labels: dynamic, LabelsHash: long, Value: real)

.create-or-alter table RawData ingestion csv mapping 'CsvMapping'
'['
'   { "column" : "Datetime", "DataType":"datetime", "Properties":{"Ordinal":"0"}},'
'   { "column" : "Timestamp", "DataType":"long", "Properties":{"Ordinal":"1"}},'
'   { "column" : "Name", "DataType":"string", "Properties":{"Ordinal":"2"}},'
'   { "column" : "Instance", "DataType":"string", "Properties":{"Ordinal":"3"}},'
'   { "column" : "Job", "DataType":"string", "Properties":{"Ordinal":"4"}},'
'   { "column" : "Labels", "DataType":"dynamic", "Properties":{"Ordinal":"5"}},'
'   { "column" : "LabelsHash", "DataType":"long", "Properties":{"Ordinal":"6"}},'
'   { "column" : "Value", "DataType":"real", "Properties":{"Ordinal":"7"}},'
']'

.alter-merge table RawData policy retention softdelete = 4d recoverability = disabled

.create table Metrics (LabelsHash: long, StartDatetime: datetime, EndDatetime: datetime, Name: string, Instance: string, Job: string, Labels: dynamic, Samples: dynamic)
This repo contains .devcontainer for VSCode, which runs a set of containers with:
- Prometheus server as is
- Prometheus server with remote_read/remote_write for local debug
- Grafana
- Node-exporter node for some example data
- Dev-container with .net core for azure functions installation with all requirements and vscode extensions for C# development
You will need to setup some credentials to fully debug the functions. There are 2 ways for doing this:
- Check the
.devcontainer/devcontainer.jsonfile >remote Envsection for environment vars. - Or you can change the
./src/PromADX/local.settings.jsonconfig file. Don't forget to exclude this file from commit.
- This repo uses prometheus .proto and convert them via
protocutil to C# classes - Follow this documentation and scripts to get, compile and keep up the latest versions
Samples:[
	{
		timestamp:
		value:
	},
	{
		timestamp:
		value:
	}...
],
Labels:[
    {
		name:
		value:
	},
	{
		name:
		value:
	}...
]
Metrics
| where (EndDatetime >= unixtime_milliseconds_todatetime(1591084670098)) and (StartDatetime <= unixtime_milliseconds_todatetime(1591092170098)) and ( ( Name == 'mysql_global_status_queries' ) )
| summarize Labels=tostring(any(Labels)), Samples=make_list( Samples ) by LabelsHash
| mv-apply Samples = Samples on
(
    order by tolong(Samples['Timestamp']) asc
    | summarize Samples=make_list(pack('Timestamp', Samples['Timestamp'], 'Value', Samples['Value']))
)

