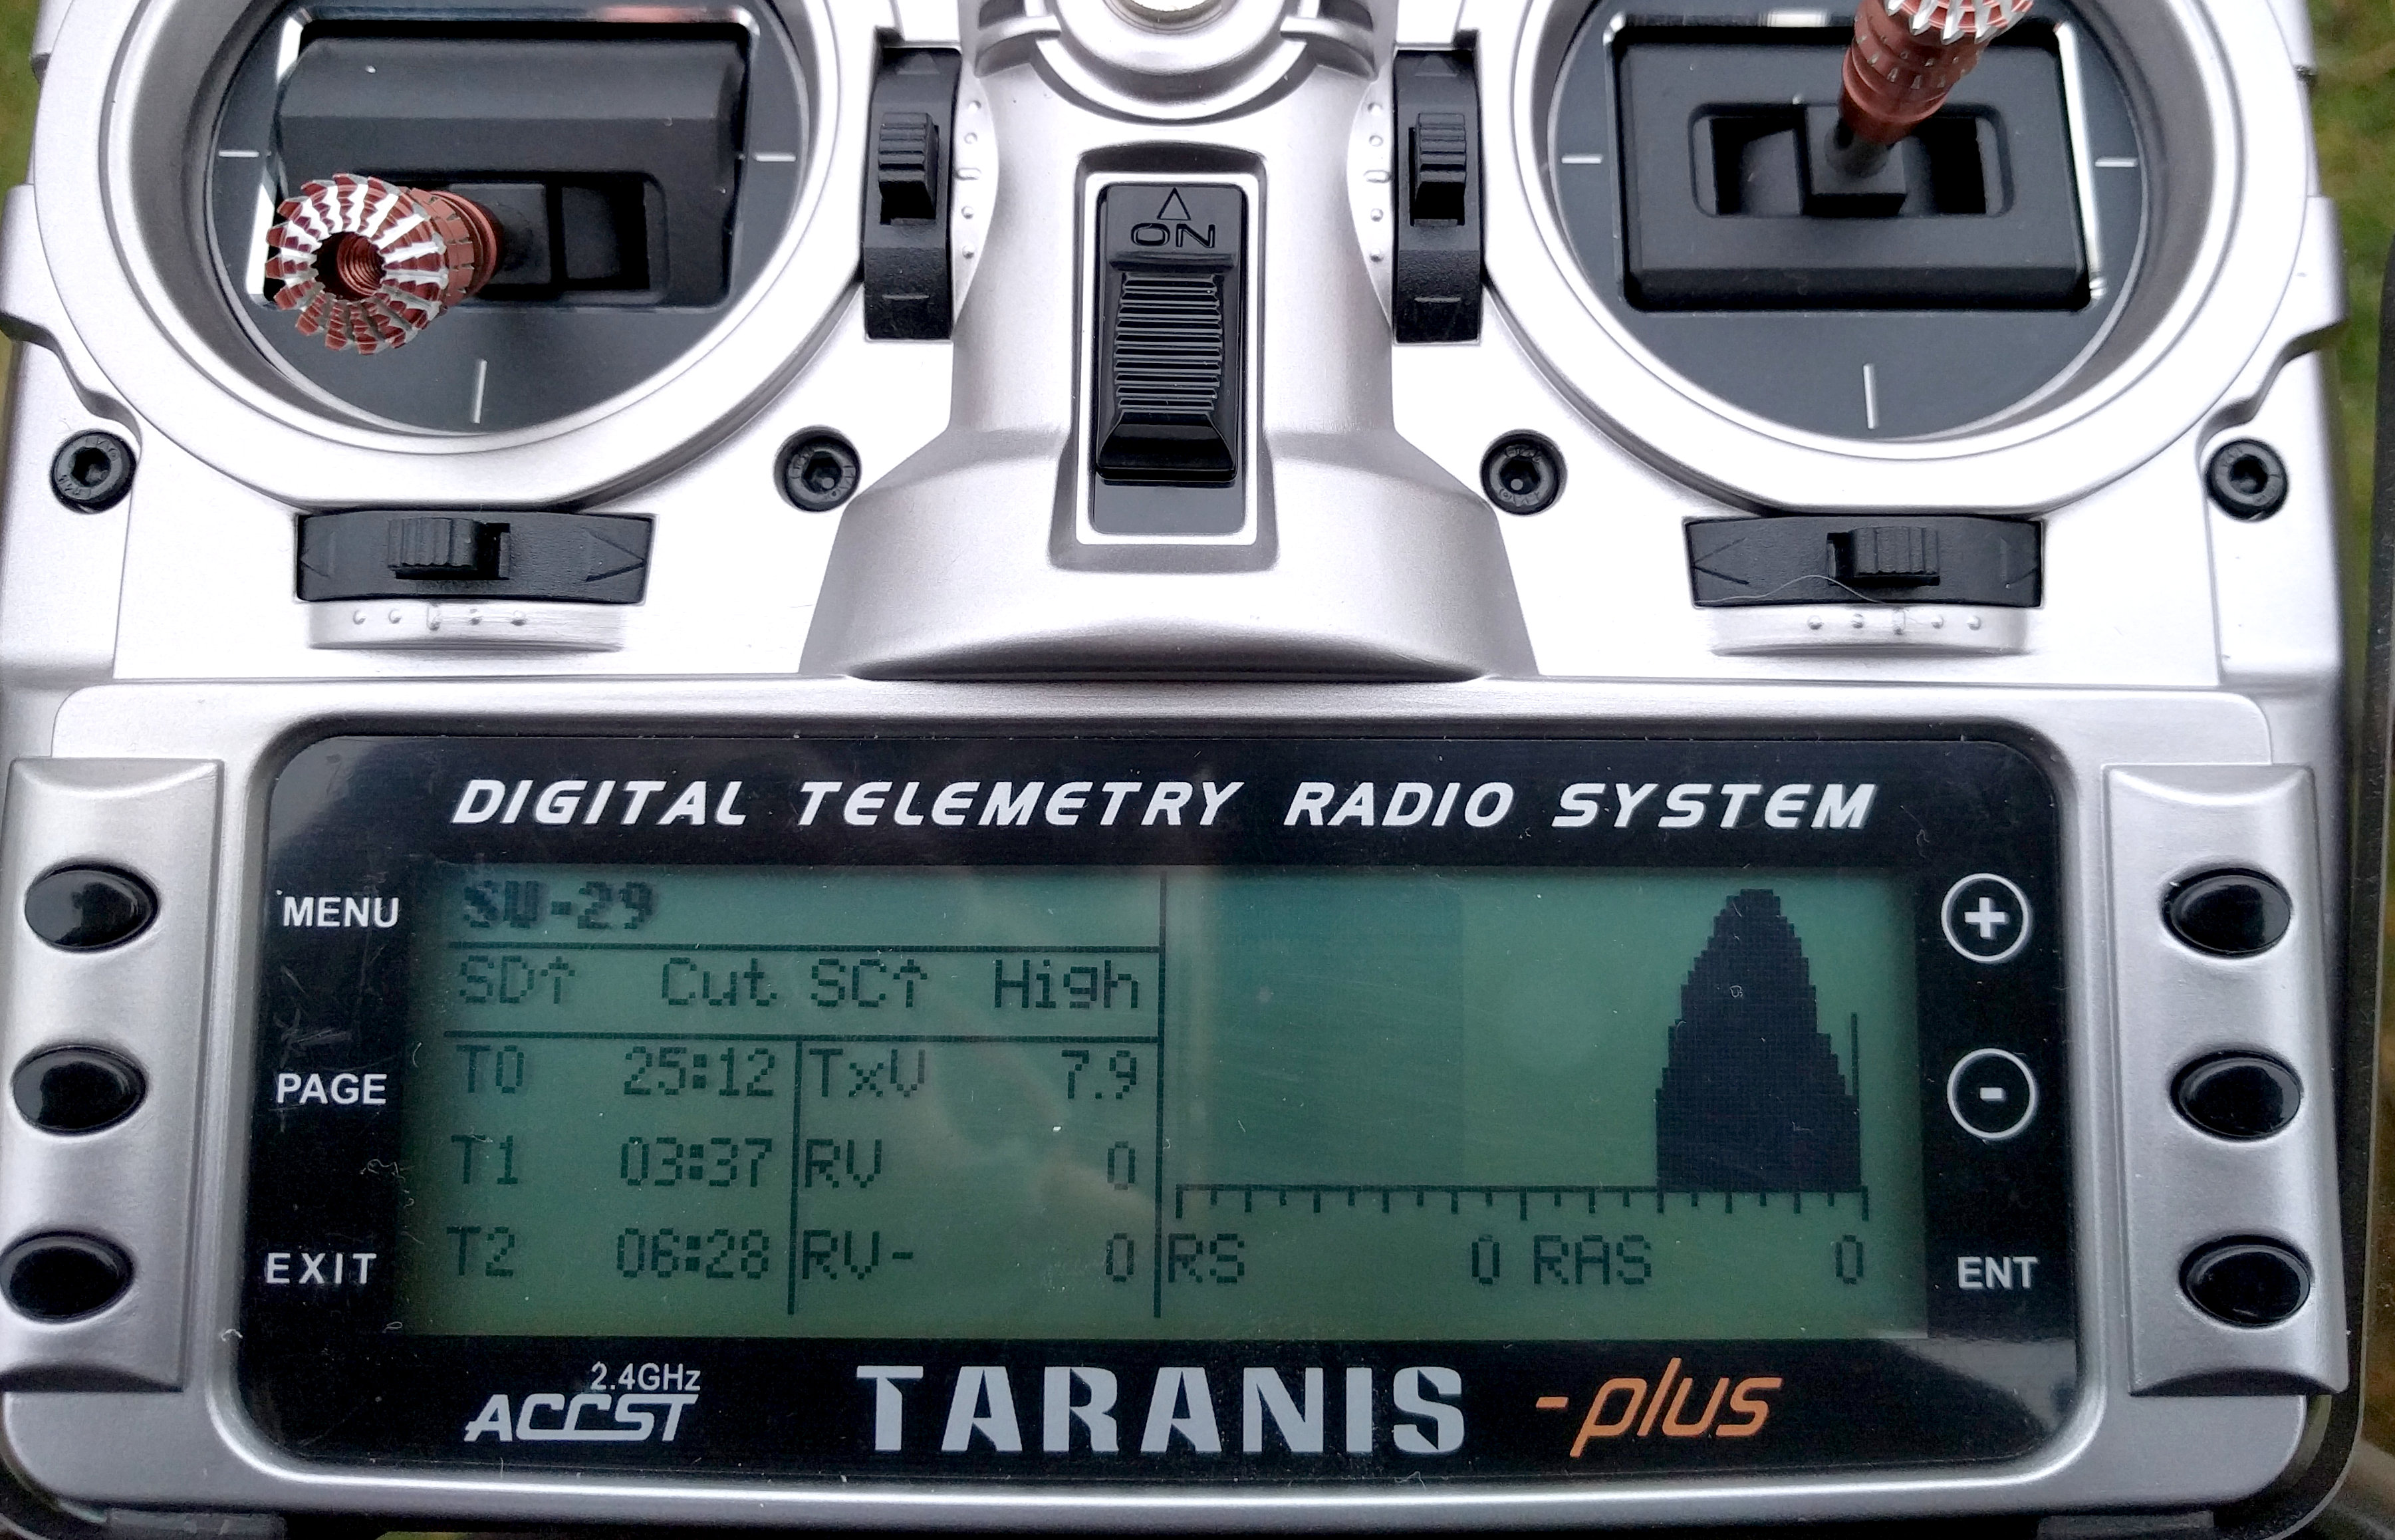
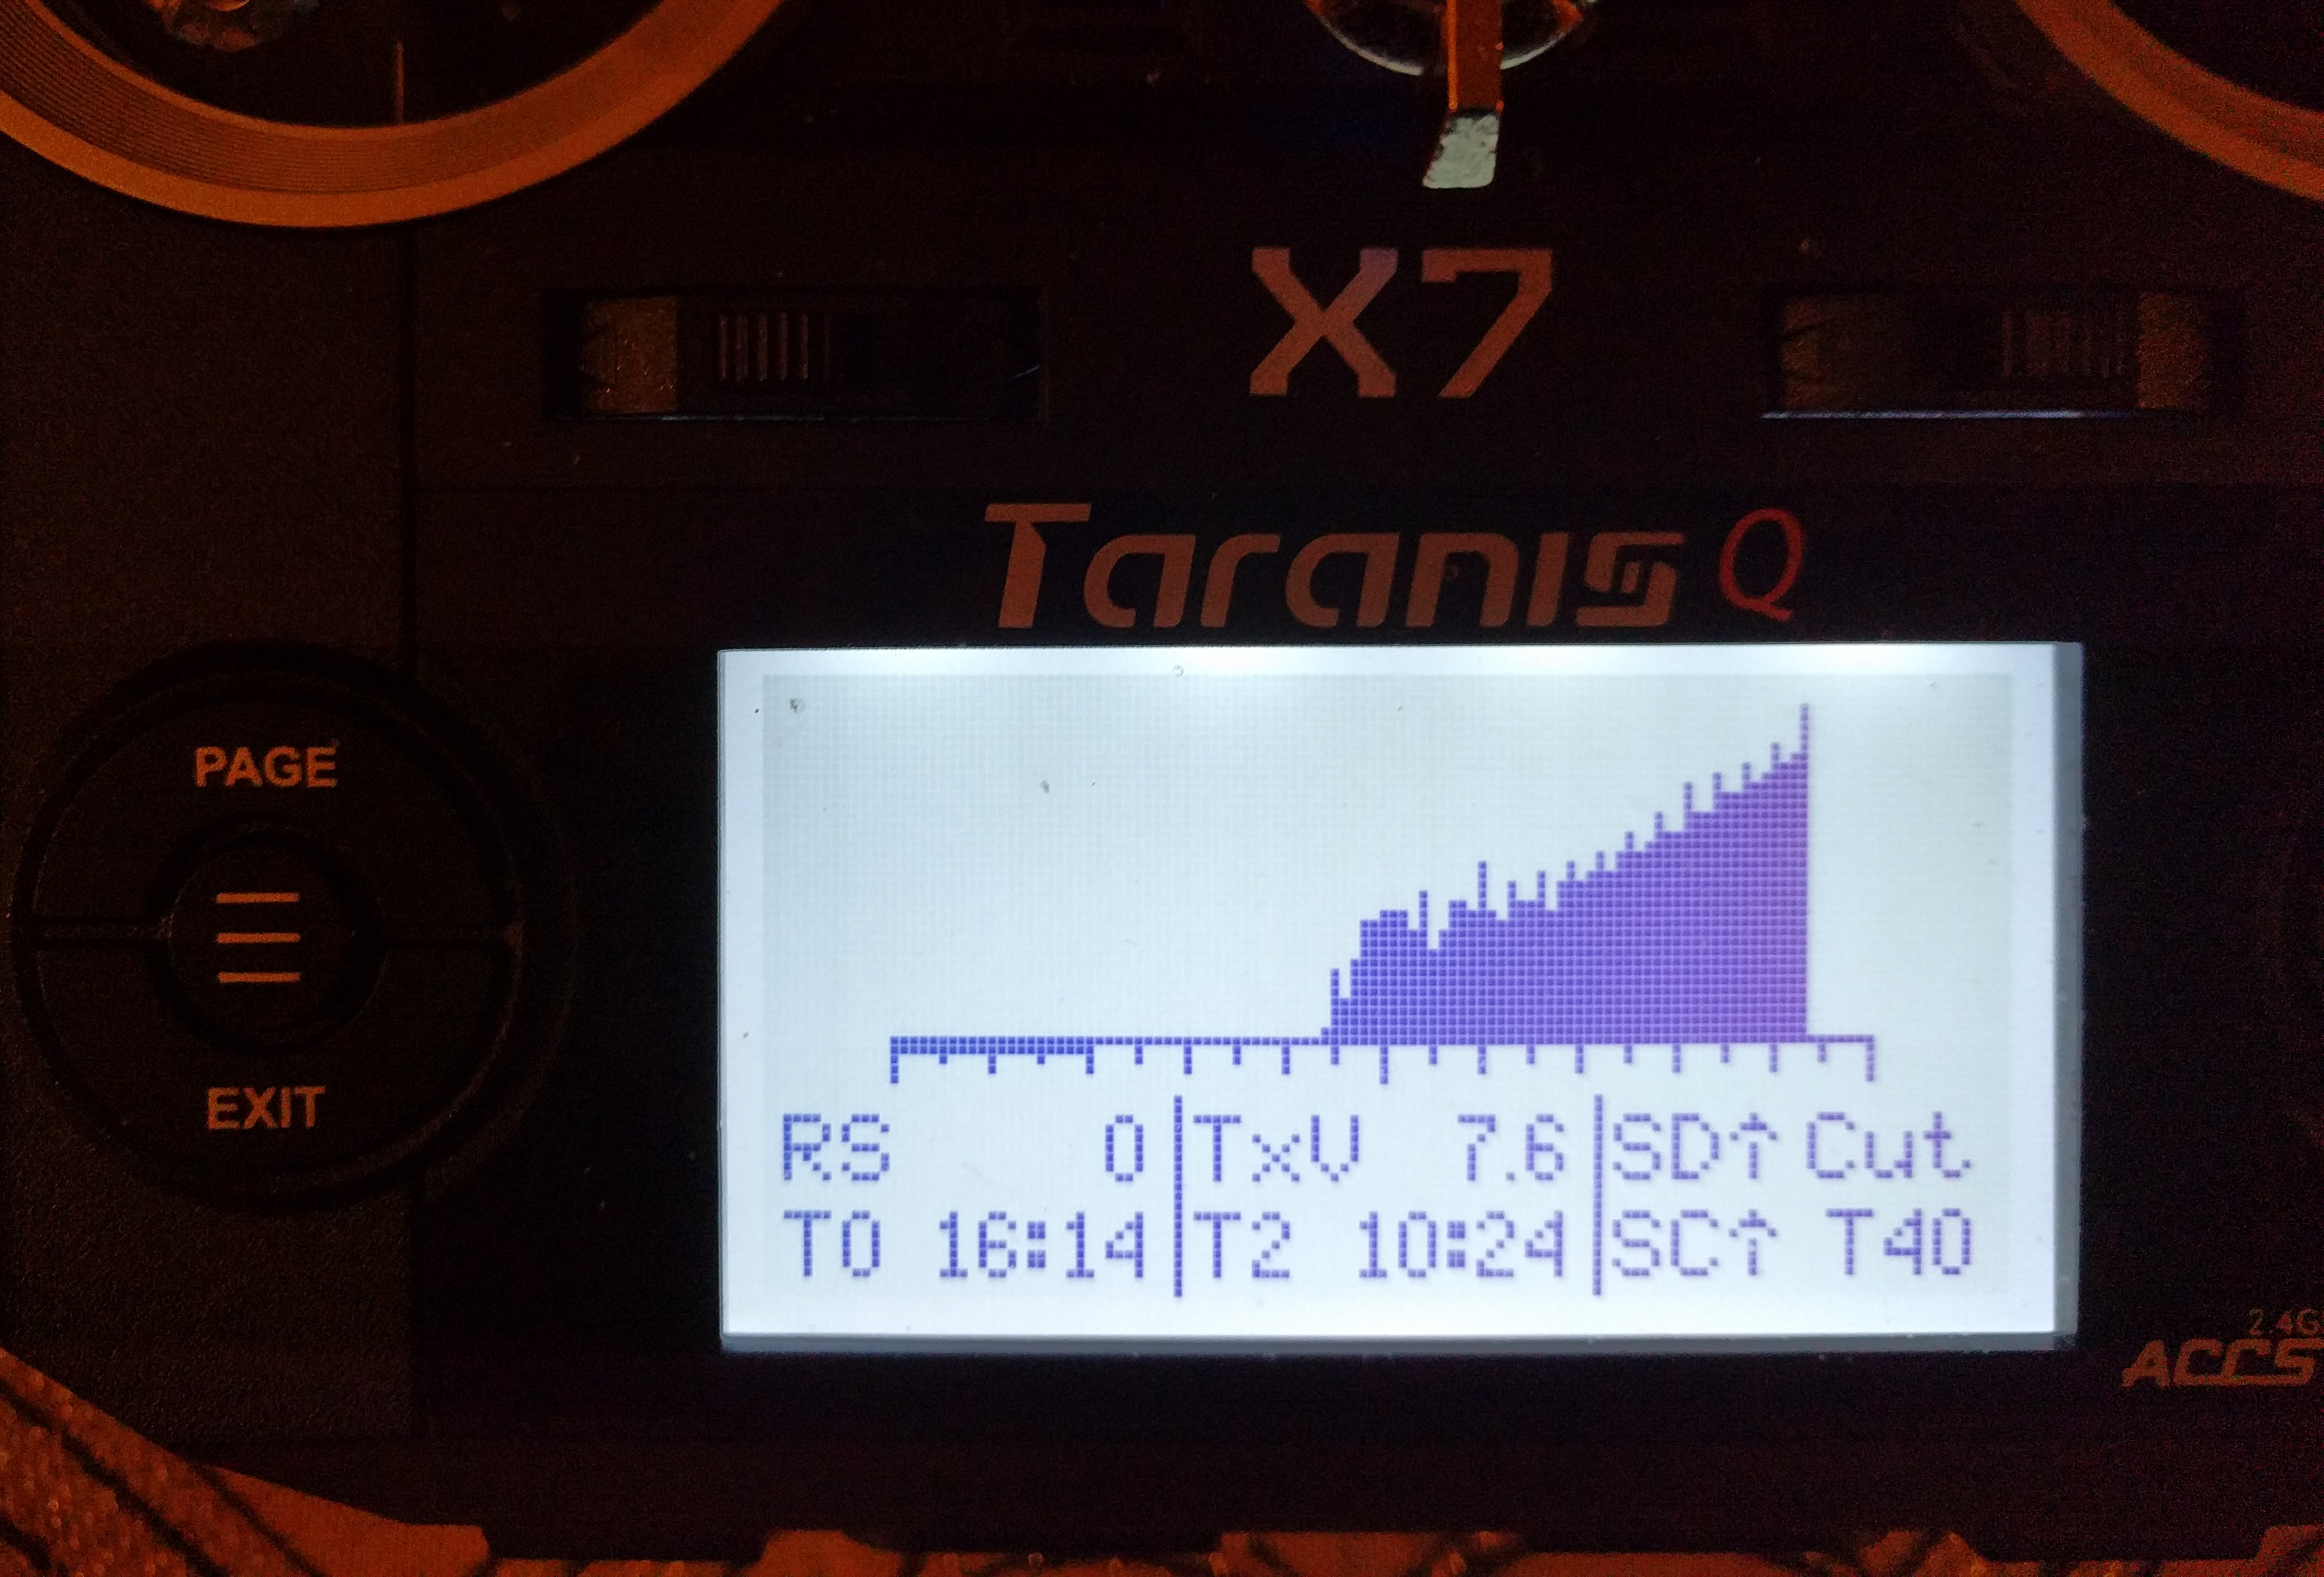
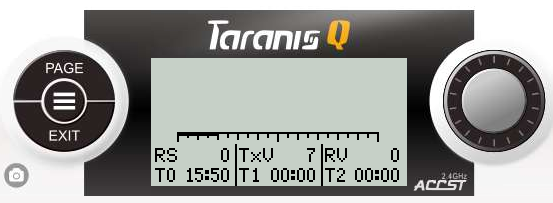
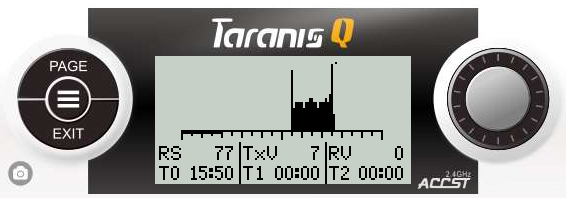
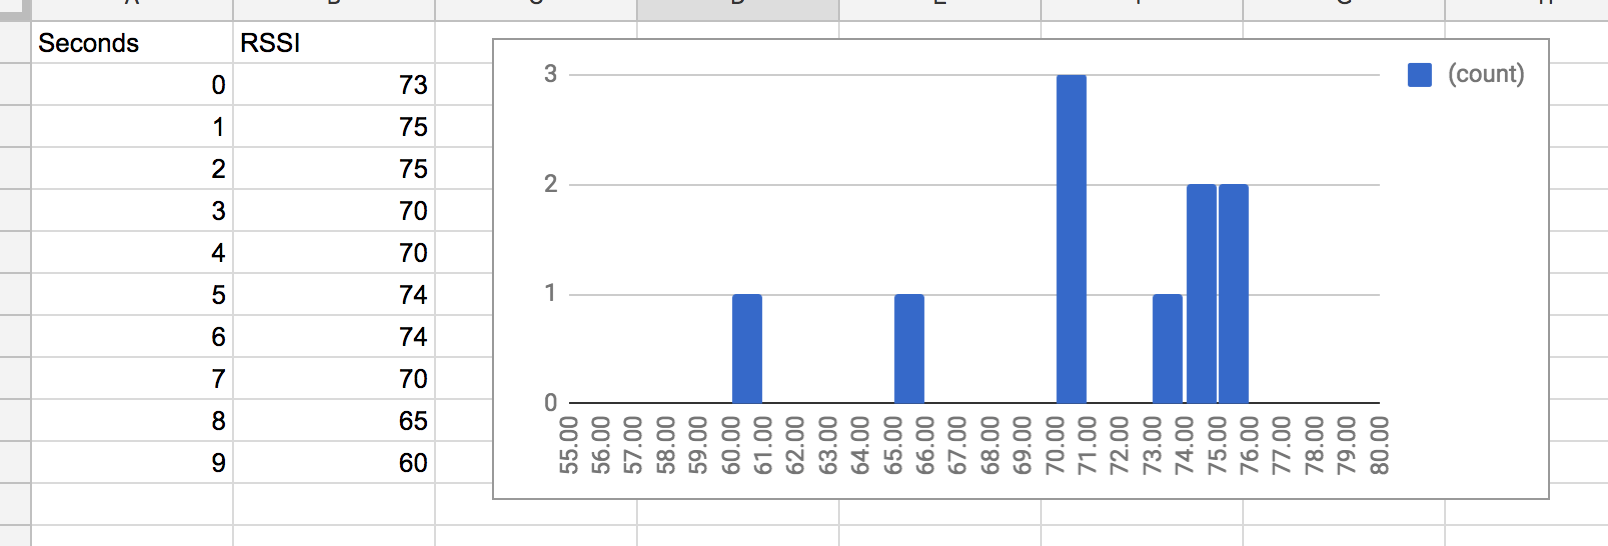
This project is a LUA telemetry script for OpenTX that provides customized telemetry screens, including a RSSI Histogram.
It's been tested and used on a QX7 and X9D with OpenTX 2.2 for hundreds of flights. I finding it very useful and would like to freely share it.
The following instructions will work either on a real radio or simulated in Companion software:
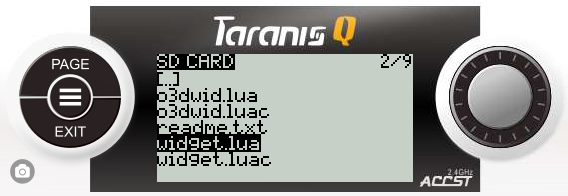
Copy the script SCRIPTS/TELEMETRY/widget.lua to SCRIPTS/TELEMETRY/ on your
SD card
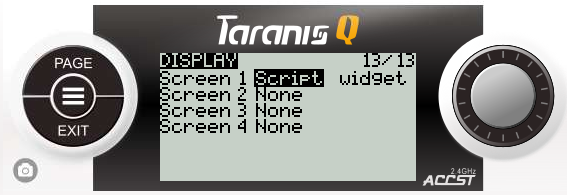
Choose a model to configure and go to the "Telemetry Screens" page Select "widget.lua" for one of the telemetry pages
Hold the "Page" button to see telemetry screens, then press the "Page" button to switch between screens.
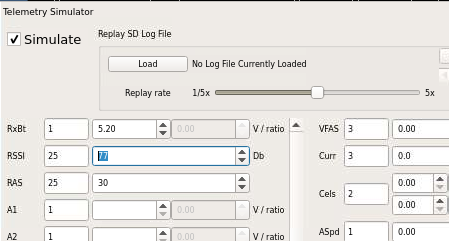
If you are simulating the setup in Companion, you can turn on fake telemetry in the simulator to see fake data being plotted.
- What is an RSSI Histogram?
- Why is a RSSI Histogram Useful?
- Customization
- Widget Basics
- Widget Reference
A way of viewing RSSI data that clearly shows signal range and trends.
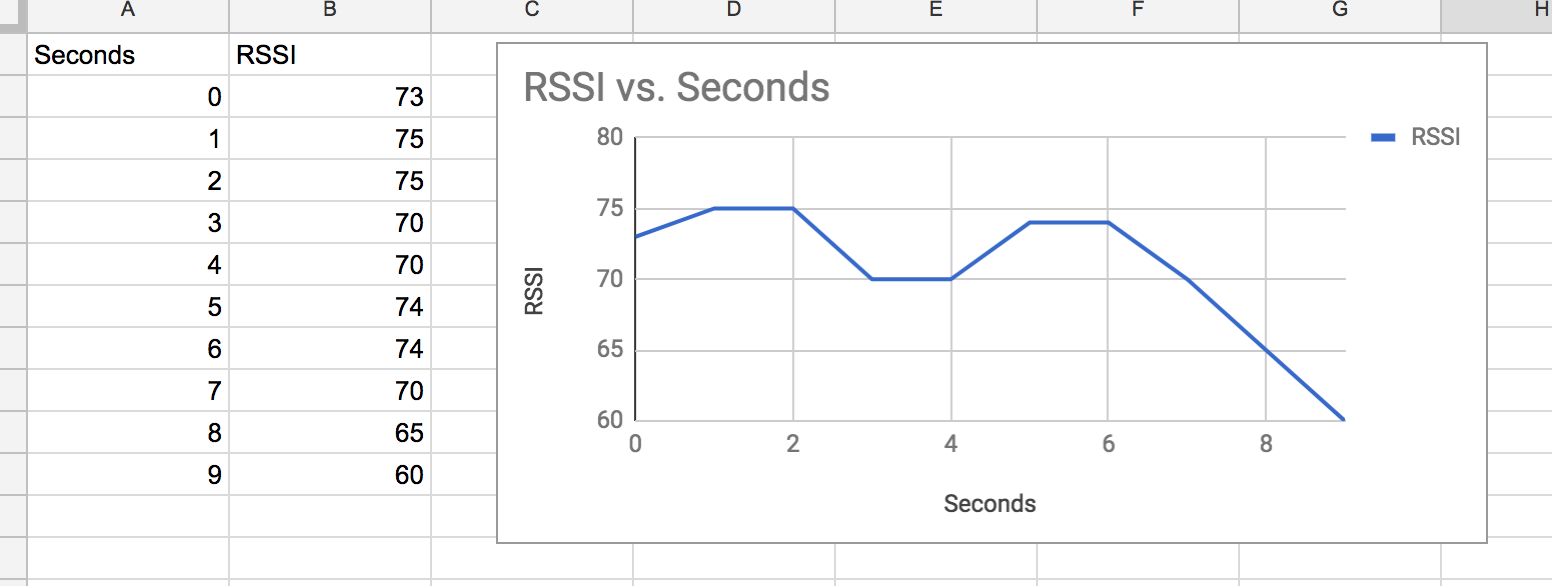
Many of us have viewed time-based RSSI plots, where the X axis is time and the Y axis is RSSI strength. These are useful for time correlation of RSSI with other events.
A histogram is a different "view" of the same data. It puts the RSSI strength in the X axis and the amount of time it was at that value in the Y axis.
This makes it fast and easy to know how RSSI ranged over a flight and see if there were any outlier events.
Both types of graphs have their place and are useful in different situations.
Peace of mind and easy field experiments.
With a typical Taranis setup, you can set an alarm at an RSSI of 45 or so and you'll know when RSSI is "bad". But if one of your planes is flying at 300 meters with an RSSI in the 70s and a different plane in the 50s, you'll have no indication that the second plane is marginal. The histogram makes it easy to see the problem in the field by glancing at the graph between flights.
As far as experiments, here are a few examples:
- Does it matter if I put my radio antenna sideways verses straight up?
- I'm going to try moving my receiver antennas, is it helping?
- Do I get a better signal if I fly on the other end of the field?
- I suspect that flying with dew on the grass is affecting my signal. Is it true?
For just about anything you might want to try, you can quickly get feedback in the field, then do follow-up as needed by viewing log data at home.
Note that the intent of the graph is not to replace your need to set alarms and log data but to tighten the feedback loop for field experiments, make them more convenient, and make potential problems more discoverable in their early stages.
You can customize the layout and content of the telemetry screen.
For example, here is an example that does away with the RSSI graph completely:
(located in config/configs/norssi.lua)
The telemetry screen is composed of a set of widgets. Each widget communicates a piece of information. For example, there is a widget that tells you the value of a timer, one that displays the RSSI graph, etc. You can customize which widgets you want and how they are laid out on the screen.
There are two ways to manage configuration:
Edit SCRIPTS/TELEMETRY/widget.lua, search for CONFIG START, and start
hacking in new values.
or
Create (or copy) a new file in config/configs. This file contains only
the configuration data and no code. You can then combine the data and
code using the provided python script config/combine.lua. For example:
python combine.py configs/funfly.lua
The second method involves extra steps but can make configuration management easier. It's up to you.
Widget layout is via a flexible grid system. This section explains what a flexible grid is and how to use it. If you are familiar with the concept, feel free to skim this section.
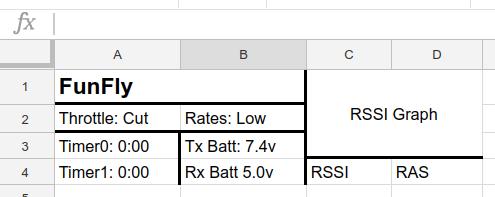
We'll start with an analogy that is nearly identical, a spreadsheet. Here is a spreadsheet that contains our model name, a couple of switch states, a couple of timers, some voltages, and the RSSI graph:
The first improvement is to make the title and graph extend to occupy multiple cells:
Next, we can resize rows and columns as needed to make better use of the space:
As a final touch, we add lines to visually group the data.
With the above in mind, we are ready to understand the layout system. To start,
we provide a layout structure in the configuration file (e.g. widget.lua):
layout = {
  -- stuff goes here
}
Next we add a definition for rows and columns. The numbers are pixel offsets. The QX7 has a screen resolution of 128x64 so the maximum sensible column offset is 127 and the maximum sensible row offset is 63. The X9D has a resolution of 212x64. Let's proceed with the X9D, trying to make something that looks like the spreadsheet example.
layout = {
  columns = {52, 105, 158, 211};
  rows = {20, 41, 52, 63};
}
Note that the "0" row and columns are assumed and not put into the definition. So by the above definition:
- Cell 0, 0 has a width of 52 pixels and a height of 20 pixels.
- Cell 2, 2 has a width of (158 - 105) = 53 pixels and a height of (52 - 41) = 11 pixels.
- Cell 3, 2 has a width of (211 - 158) = 53 pixels and a height of (52 - 41) = 11 pixels.
...and so on.
There is also the concept of padding. Padding puts a bit of space around widgets, which usually looks nicer:
layout = {
  columns = {52, 105, 158, 211};
  rows = {11, 24, 37, 50, 63};
  pad = 2;
}
Let's start adding widgets:
layout = {
  columns = {52, 105, 158, 211};
  rows = {11, 24, 37, 50, 63};
  pad = 2;
  widgets = {
    -- list them here
  }
}
First, the model title:
layout = {
  columns = {52, 105, 158, 211};
  rows = {11, 24, 37, 50, 63};
  pad = 2;
  widgets = {
    {
      column = 0;
      row = 0;
      width = 2;
      widget = LabelWidget({label = "FunFly"});
    }
  }
}
Let's looks at some of the new details. The values column and row tell
where to put the widget. The width parameter is used here to specify the
column span of 2. If the span was 1, you could omit width. This is why there
is no height, the default height of 1 is fine.
Finally, the widget itself. We are using a simple LabelWidget. It's too
simple, really. Better would be to have the current model name as reported by
OpenTX. That is possible, but I'll defer the details until the "widgets"
section below.
To complete the example, let's add one more widget. To fully reproduce the spreadsheet, we would need to add more but this would expose details that I feel are best explained in the Widgets section below. The focus of this section is understanding how rows, columns, widths, and heights work:
layout = {
  columns = {52, 105, 158, 211};
  rows = {11, 24, 37, 50, 63};
  pad = 2;
  widgets = {
    {
      column = 0;
      row = 0;
      width = 2;
      widget = LabelWidget({label = "FunFly"});
    },
    {
      column = 2;
      row = 0;
      width = 2;
      height = 3;
      widget = RSSIHistogramWidget()
    }
  }
}
A widget is a LUA object that knows how to fetch some data and draw to the LCD. The basic way to create a widget is to call a function that creates and returns one.
All Widgets take an options structure. You can just pass {} if you don't
have any options to set:
-- Defined with an option
widget = RSSIHistogramWidget({greyscale = true})
-- just take the default
widget = RSSIHistogramWidget({})
If you want to add features to Widgets or create your own, refer to the comments
and documentation in config/code.lua
Displays the current date as YYYY-MM-DD
widgets = {
  {
    column = 0;
    row = 0;
    width = 2;
    widget = CurrentDateWidget({})
  },
}
flags: Flags are forwarded todrawText()and can make the text bold, at different sizes, etc. See OpenTX docs for details.separator: Change the separator from '-' to some other character.
Displays the current time in 24-hour format.
widgets = {
  {
    column = 0;
    row = 0;
    width = 2;
    widget = CurrentTimeWidget({})
  },
}
flags: Flags are forwarded todrawText()and can make the text bold, at different sizes, etc. See OpenTX docs for details.flash: If true, flashes the ':' characters once a second.show_seconds: If true, includes seconds in the label.
Draws a static (non-changing) label that can be directly provided, or optionally provided via a callback function.
If you are interested in a dynamic (changing value), use ValueWidget instead.
widgets = {
  {
    column = 0;
    row = 0;
    width = 2;
    widget = LabelWidget({
      init_func = function()
        return model.getInfo().name
      end;
      label_flags = BOLD;
    })
  },
}
label: Use a simple string label. Ifinit_funcis set, this is ignoredinit_func: Call the given function and display it's returned valuelabel_flags: Flags are forwarded todrawText()and can make the text bold, at different sizes, etc. See OpenTX docs for details.
Used to draw lines between other widgets for grouping.
{
  column = 1;
  row = 1;
  height = 2;
  width = 0;
  pad = 0;
  widget = LineWidget({})
},
pattern: Settings fordrawLine()pattern. See OpenTX docs for details.flags: Settings fordrawLine()flags. See OpenTX docs for details.
Draws a real time RSSI histogram. Auto scales Y axis. Uses log scale for amounts so that rare readings still show up.
Needs a pixel width of at least 100 as-coded or it wont draw anything.
widgets = {
  {
    column = 2;
    row = 0;
    width = 2;
    height = 4;
    widget = RSSIHistogramWidget({greyscale = true})
  }
}
greyscale: If true, then the RSSI critical level is drawn as a grey scale rectangle. This won't work on the QX7, which has a monochrome display.- 'throttle_chan': Can get set to a channel such as ch1. If set, then RSSI=0 valuess record whrn throttle is active. The purpose of this is to try and filter out stray RSSI=0 values (e.g. battery not plugged in yet) but get them if they happen in flight.
Shows the value of a switch along with a custom label. Can also change style (e.g. bold, inverse, flashing) depending on state.
The idea is both to remind the pilot what switches are relevant and to show if a switch is in a non-default state.
Say you control rates via switch SC and want the "normal" setting to be high
{
  column = 1;
  row = 1;
  widget = SwitchWidget("sc", {
  labels = {"High", "Low", "Low"},
  flags = {0, INVERS, INVERS}
  })
},
The settings above will show High if switch SC is forward, and Low otherwise. Also, the Low labels will be displayed in an inverse font
switch: The name of the switch as defined by OpenTX. Examples includesa,sb,sc.
flags: Draw flags that corresponding to each switch state. e.g.BOLD,INVERSlabels: Labels that correspond to each switch state
Shows the value of a timer.
{
  column = 0;
  row = 2;
  widget = TimerWidget(0, {})
},
timer_number: Which timer to display. Zero-based.
timer_flags: Display flags for timer. e.g.BOLD,INVERSlabel_flags: Display flags forT0,T1, orT2label
Draws a labeled value. By default, calls getValue() for the value. See the
OpenTX docs for available getValue() strings.
{
  column = 0;
  row = 1;
  widget = ValueWidget("RS", {func=getRSSI})
},
{
  column = 1;
  row = 1;
  widget = ValueWidget("tx-voltage", {label="TxV", decimals=1})
},
parm: The parameter to pass togetValue(). Also used as the label by default. Note thatfuncandlabeloptions below modify this behavior somewhat.
label: The label to put in front of the value. If omitted, usesparmfor the label.label_flags: Label draw flags (e.g.BOLD). See OpenTX docs fordrawText()for more information.value_flags: Value draw flags (e.g.BOLD). See OpenTX docs fordrawText()for more information.func: If set, calls this function for the value instead ofgetValue()decimals: If set, rounds the output value to the given number of decimals. e.g.5.2345becomes5.23ifdecimals = 2
To support multiple radios and models, you have two options:
- Create a separate configuration for each model you have. These are best
placed in
config/configs - Use
configs/combine.pyto make a LUA script for each model. Example usage ispython combine.py configs/edg540.lua - In the telemetry page for each model, choose the corresponding LUA file.
This approach has downsides if you have many models - especially since model setups tend to be similar. Below you can learn to do it with one configuration.
There are two additional layout fields: not_models and only_models which can
be used as filters. Each takes a list of model names.
For example, say you have the following layout:
layout = {
  columns = {52, 105, 158, 211};
  rows = {11, 24, 37, 50, 63};
  pad = 2;
  widgets = {
  }
    -- stuff...
    {
      column = 1;
      row = 2;
      only_models = {"Mustang", "Beaver"};
      widget = SwitchWidget("sa", {
      labels = {"NoFlp", "Flap1", "Flap2"},
      flags = {0, INVERS, INVERS}
      })
    },
    {
      column = 1;
      row = 2;
      not_models = {"Mustang", "Beaver"};
      widget = ValueWidget("tx-voltage", {label="TxV", decimals=1})
    },
    -- more stuff...
}
In the example above, we show a Flaps status for the Mustang and Beaver
models while showing TxV for everyone else. The idea is that other models we
own don't have flaps and it would be better to use the space for something
else.
The function chooseLayout() is called to return a layout configuration. This
can simply return a set configuration or can optionally contain any sort of
logic you want. Here is a simple script that returns a different configuration
depending on radio model:
local QX7_Layout = {
  -- stuff
}

local X9D_Layout = {
  -- stuff
}

local function chooseLayout()
  local _, radio = getVersion()


  if string.find(radio, "x9d") ~= nil then
    return X9D_Layout
  end

  return QX7_Layout
end
You may want to reset the telemetry graph when resetting a flight, or when a switch is toggled. This can be done with a global variable.
To start, choose a global variable index to use. Then set this in your configuration to that index:
resetGlobalVarIndex = 5 -- choose GV6
Now, any time you want to reset the telemetry, write a non-zero value to that variable. A basic setup is to create a special function that sets the global variable to 1.
