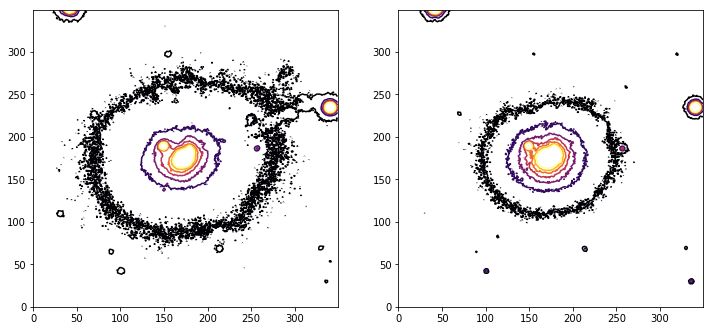
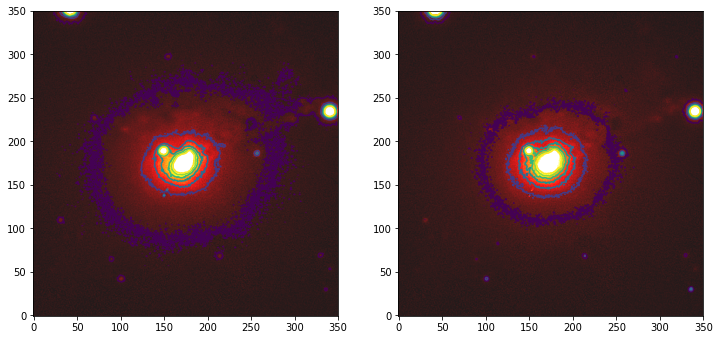
Visualization Demo on LSST DSFP S5D4
- explore multi-wavelength visualization, as well as hidden structure
- adjust dynamical range based on various statistical assumption
- with no forehand knowledge about the object, extract the most possible information, using visualization, and via visualization

