This repository holds the code from the paper "MaaSim: A Liveability Simulation for Improving the Quality of Life in Cities" published at SoGood2018 (http://tiny.cc/j8emgz).
MaaSim is an open-source simulation based on the Dutch liveability score(Rigo's Leefbaarometer 2.0) with a built-in AI module. Features are selected using feature engineering and Random Forests. Then, a modified scoring function is built based on the former liveability classes. The score is predicted using Random Forest for regression and achieved a recall of 0.83 with 10-fold cross-validation. Afterwards, Exploratory Factor Analysis is applied to select the actions present in the model. The resulting indicators are divided into 5 groups, and 12 actions are generated. The performance of four optimisation algorithms is compared, namely NSGA-II, PAES, SPEA2 and eps-MOEA, on three established criteria of quality: cardinality, the spread of the solutions, spacing, and the resulting score and number of turns. Although all four algorithms show different strengths, eps-MOEA is selected to be the most suitable for this problem. Ultimately, the simulation incorporates the model and the selected AI module in a GUI written in the Kivy framework for Python. Tests performed on users show positive responses and encourage further initiatives towards joining technology and public applications.
- Python 2.7 or 3.5 to 3.7
- Kivy for Python (for the interface)
- Platypus for Python (for the optimization algorithms)
- Install dependencies
python -m pip install docutils pygments pypiwin32 kivy_deps.sdl2==0.1.22 kivy_deps.glew==0.1.12
python -m pip install kivy_deps.gstreamer==0.1.17
For Python 3.5+, you can also use the angle backend instead of glew. This can be installed with:
python -m pip install kivy_deps.angle==0.1.9
- Install Kivy
python -m pip install kivy==1.11.1
conda install kivy -c conda-forge.
More info here https://kivy.org/
git clone https://github.com/Project-Platypus/Platypus.git
cd Platypus
python setup.py develop
More info here https://platypus.readthedocs.io/en/latest/index.html
The differents folders contain :
Data Generation : - The file "prepareData" computes one time processes that have to be done before computing the indicators(might take long time to run)
		  - The file "gisviz.py" is the file that computes the indicators value from the shapefiles following the Rigo Liveabilty Index(LEEFBAAROMETER 2.0) . It takes long time to run.
		  - Shapefiles with data needed for the computations


Feature Selection : - An R markdown "Finge" for the process of feature engineering
		    - A python file "regression" with the model for the Random forest and the other compared algorithms
		    - Csv files resulting from feature engineering and from the indicators


Optimization algorithms: - One file "gas.py" with the problem implementation and experiments for the genetic algorithms(Platypus needed)
			 - CSv file with indicators for Maastricht and the Random forest model used for evaluating individuals


Simulation : - "gui.py" is the main file with the logic of the interface (Kivy needed)
	     - "test.kv" is the corresponding Kivy file with the interface structure and style
	     - the file "ga.py" is the file containing the genetic algorithm chosen for the simulation
	     - the folder "icons" contains png files of icons for the interface and "song" the background music
	     - the csv "weights" is a file containing weights for indicator for computing the value of groupings
	     - "MassrawcleanNAMES" contains indicators values for the municipality of Maastricht
Run in shell
cd Simulation
python gui.py
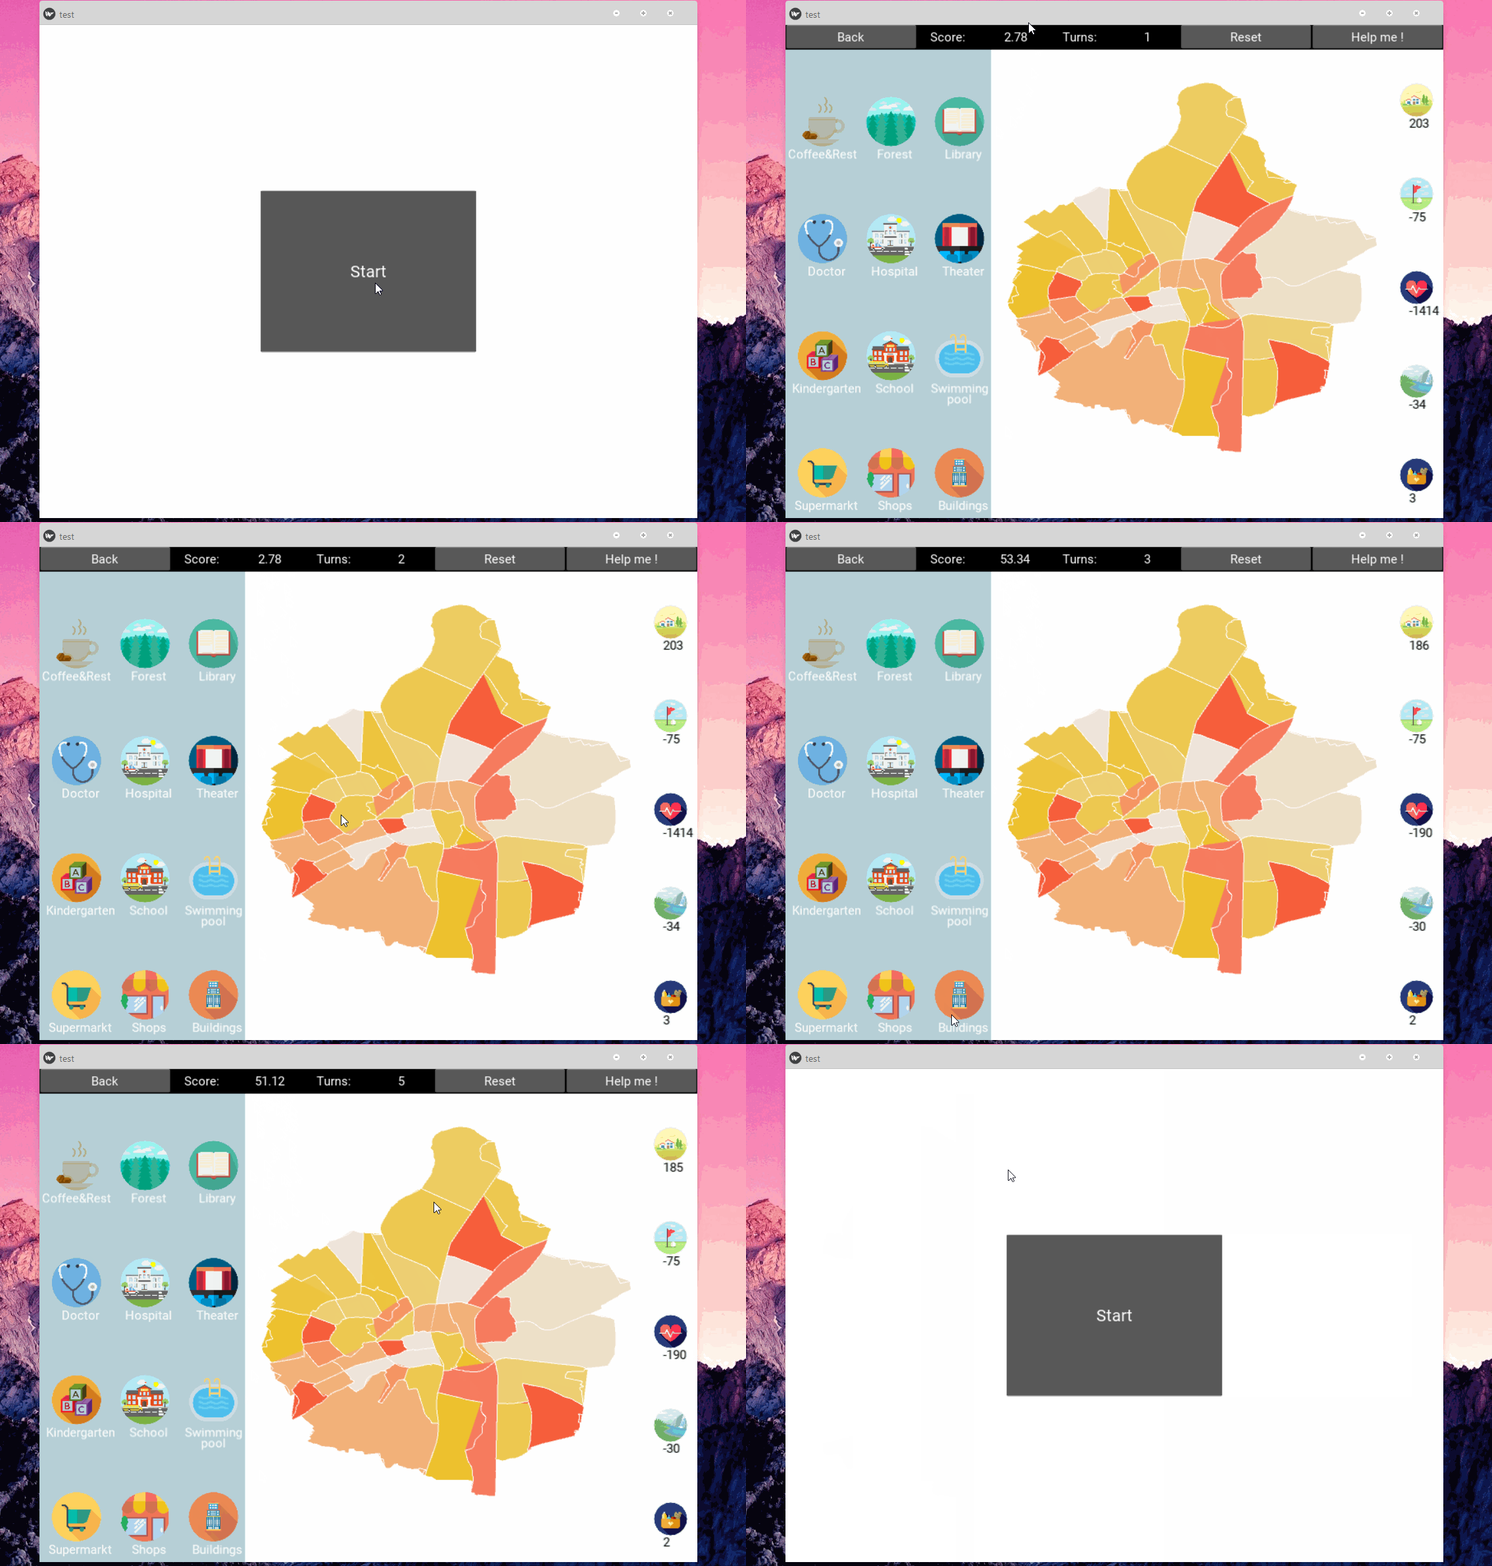
Once the kivy window appeared, click on the Start button to enter the interface.The map of Maastricht will show and you can hover over the neighbourhoods and get their name. By cliking on the neighbourhoods you select it and the header will show the current score improvement, the number of turns used so far, a reset button and a button "Help me!" that would trigger the optimization algorithms. On the left the possible actions appears and on the right the current indicators scores for the selected neighbourhood.
The description of the indicators and how they are computed from the Rigo Leefbaarometer 2.0 (IN DUTCH). https://doc.leefbaarometer.nl/resources/Leefbaarometer%202.0%20Instrumentontwikkeling%20CONCEPT.pdf
- Connect the optimization algorithm to the interface.
- Add shapefiles of other neighbourhoods.
- Add selection menu.
- Improve the indicators value to be more user friendly.
- Show how much an action affect indicators and the score before using a turn.
