# If the following error occurs:
# Error in utils::download.file(url, path, method = method, quiet = quiet,  :
#   download from 'https://api.github.com/repos/Asa12138/ReporterScore/tarball/HEAD' failed
# options(timeout = 600)
devtools::install_github("dongdongdong7/MetaboRich")The input should be a data.frame or tibble with four columns, as follows:
library(MetaboRich)
data("example_data", package = "MetaboRich")
> dplyr::as_tibble(example_data)
# A tibble: 168 × 4
id logfc pvalue qvalue
<chr> <dbl> <dbl> <dbl>
1 C00082 1.76 0.00000289 0.000599
2 C12512 -2.50 0.0000323 0.00334
3 C16300 -1.71 0.000215 0.0148
4 C04886 0.807 0.000438 0.0187
5 C00486 0.807 0.000450 0.0187
6 C01996 0.623 0.000623 0.0215
7 C03413 0.622 0.00126 0.0291
8 C00366 -0.256 0.00198 0.0357
9 C01019 -0.811 0.00198 0.0357
10 C16618 -0.599 0.00207 0.0357
# ℹ 158 more rows
# ℹ Use `print(n = ...)` to see more rowsThere are two main types of built-in data that you can retrieve through data():
data("metabolitesList", package = "MetaboRich")
names(metabolitesList) # "hmdb" "ramp"
data("setsList", package = "MetaboRich")
names(setsList)
# [1] "kegg_pathway"       "smpdb_pathway"      "hmdb_disease"       "markerdb_condition" "classyfire"
# [6] "reactome_pathway" "wiki_pathway" MetabolitesList contains metabolite information from two databases, HMDB and RaMP. These databases are organized into the form of tibble, called metabolites_tibble, as follows:
> metabolitesList$hmdb
# A tibble: 217,920 × 23
   hmdb_id     name   formula    mw monoisotop_mass smiles inchi inchikey foodb_id kegg_id chemspider_id chebi_id
   <chr>       <chr>  <chr>   <dbl>           <dbl> <chr>  <chr> <chr>    <chr>    <chr>   <chr>         <chr>
 1 HMDB0000001 1-Met… C7H11N… 169.            169.  CN1C=… InCh… BRMWTNU… FDB0935… C01152  83153         50599
 2 HMDB0000002 1,3-D… C3H10N2  74.1            74.1 NCCCN  InCh… XFNJVJP… FDB0052… C00986  415           15725
 3 HMDB0000005 2-Ket… C4H6O3  102.            102.  CCC(=… InCh… TYEYBOS… FDB0303… C00109  57            30831
 4 HMDB0000008 2-Hyd… C4H8O3  104.            104.  CC[C@… InCh… AFENDNX… FDB0218… C05984  389701        50613
 5 HMDB0000010 2-Met… C19H24… 300.            300.  [H][C… InCh… WHEUWNK… FDB0218… C05299  389515        1189
 6 HMDB0000011 3-Hyd… C4H8O3  104.            104.  C[C@@… InCh… WHBMMWS… FDB0218… C01089  83181         17066
 7 HMDB0000012 Deoxy… C9H12N… 228.            228.  OC[C@… InCh… MXHRCPN… FDB0218… C00526  13118         16450
 8 HMDB0000014 Deoxy… C9H13N… 227.            227.  NC1=N… InCh… CKTSBUT… FDB0218… C00881  13117         15698
 9 HMDB0000015 Corte… C21H30… 346.            346.  [H][C… InCh… WHBHBVV… FDB0218… C05488  389582        28324
10 HMDB0000016 Deoxy… C21H30… 330.            330.  [H][C… InCh… ZESRJSP… FDB0064… C03205  5932          16973
# ℹ 217,910 more rows
# ℹ 11 more variables: drugbank_id <chr>, phenol_explorer_compound_id <chr>, wikipedia_id <chr>,
#   knapsack_id <chr>, bigg_id <chr>, metlin_id <chr>, vmh_id <chr>, cas_id <chr>, synonyms <list>,
#   iupac_name <chr>, traditional_iupac <chr>
# ℹ Use `print(n = ...)` to see more rows
Metabolites_tibble can also be arranged by users, which contains three columns of main information databasename1_id, name, and databasename2_id to be used for id conversion of function id_mapping.
Several metabolite sets/function sets are currently collected in setsList. The common pathway sets are kegg_pathway, smpdb_pathway, reactome_pathway and wiki_pathway. Disease set: hmdb_disease, markerdb_condition; Structure classification set: classyfire.
> setsList$kegg_pathway
# A tibble: 289 × 5
   id       name                                        type                         metabolites metabolites_name
   <chr>    <chr>                                       <chr>                        <list>      <list>
 1 hsa00010 Glycolysis / Gluconeogenesis                Metabolism; Carbohydrate me… <chr [31]>  <chr [31]>
 2 hsa00020 Citrate cycle (TCA cycle)                   Metabolism; Carbohydrate me… <chr [20]>  <chr [20]>
 3 hsa00030 Pentose phosphate pathway                   Metabolism; Carbohydrate me… <chr [37]>  <chr [37]>
 4 hsa00040 Pentose and glucuronate interconversions    Metabolism; Carbohydrate me… <chr [59]>  <chr [59]>
 5 hsa00051 Fructose and mannose metabolism             Metabolism; Carbohydrate me… <chr [55]>  <chr [55]>
 6 hsa00052 Galactose metabolism                        Metabolism; Carbohydrate me… <chr [46]>  <chr [46]>
 7 hsa00053 Ascorbate and aldarate metabolism           Metabolism; Carbohydrate me… <chr [57]>  <chr [57]>
 8 hsa00500 Starch and sucrose metabolism               Metabolism; Carbohydrate me… <chr [37]>  <chr [37]>
 9 hsa00520 Amino sugar and nucleotide sugar metabolism Metabolism; Carbohydrate me… <chr [118]> <chr [118]>
10 hsa00620 Pyruvate metabolism                         Metabolism; Carbohydrate me… <chr [32]>  <chr [32]>
# ℹ 279 more rows
# ℹ Use `print(n = ...)` to see more rows
Users can also imitate the above examples to build their own metabolite sets.
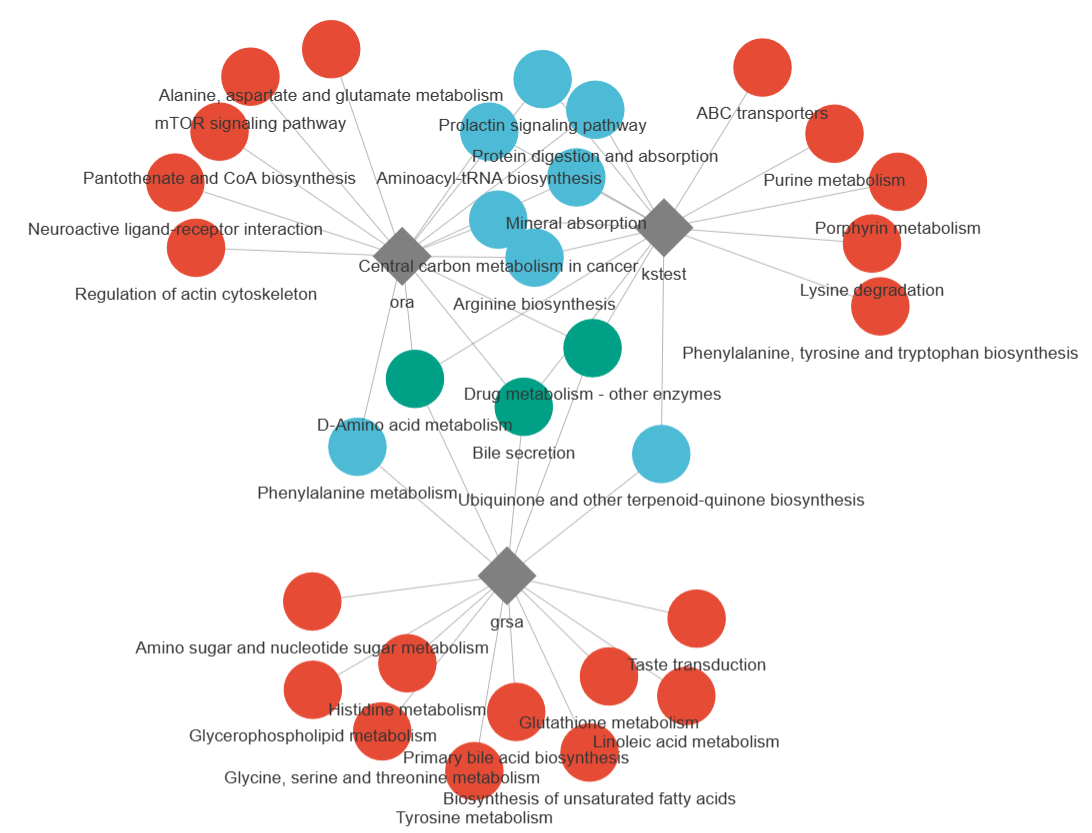
The R package contains three enrichment functions, ORA, KSTEST, and GRSA.
enrichmentRes_ora <- ora(input = example_data, enrich_tibble = setsList$kegg_pathway, enrich_type = "all", N_type = "database", adjust = "fdr", thread = 2)
enrichmentRes_kstest <- kstest(input = example_data, enrich_tibble = setsList$kegg_pathway, adjust = "fdr", thread = 2)
enrichmentRes_grsa <- grsa(input = example_data, enrich_tibble = setsList$kegg_pathway, adjust = "fdr", thread = 2)
The results of enrichment are presented in the form of tibble
> library(magrittr)
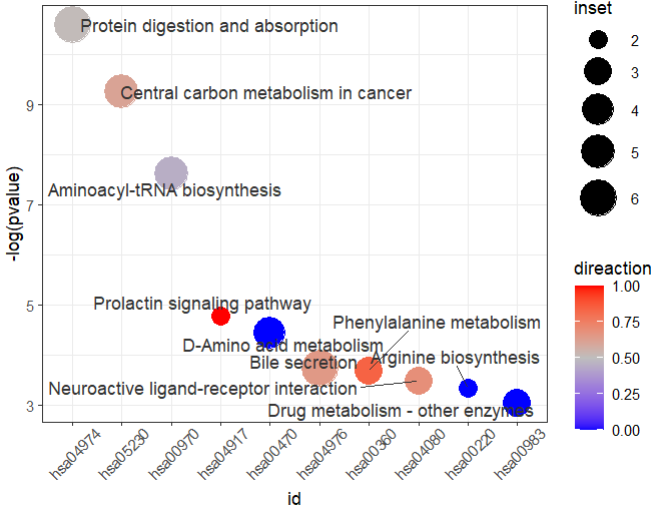
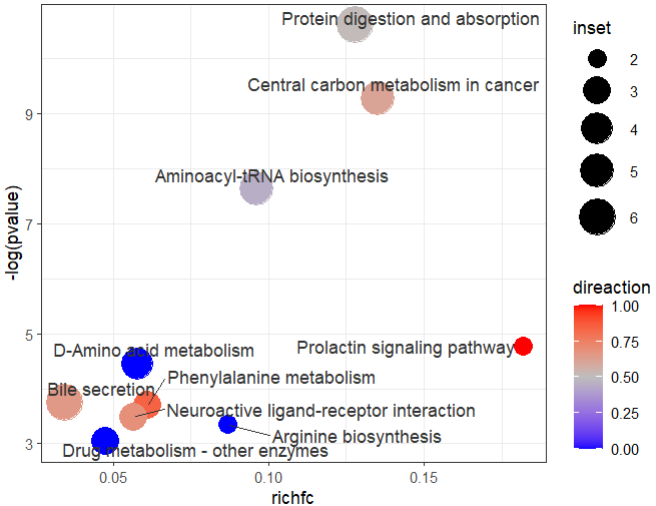
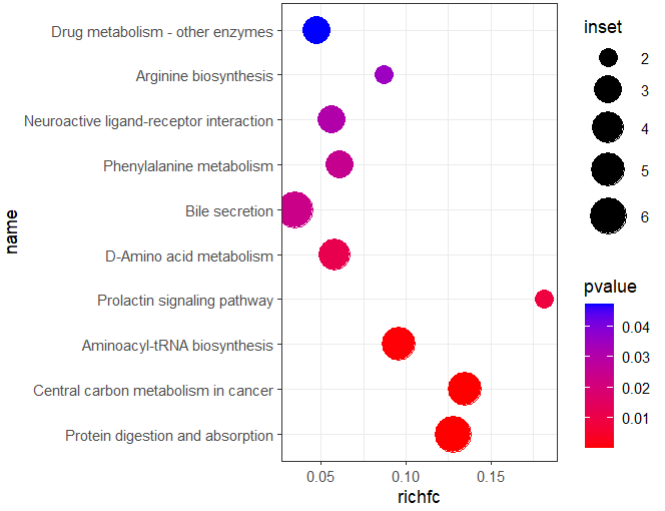
> enrichmentRes_ora %>% dplyr::filter(pvalue < 0.05) %>% dplyr::arrange(pvalue)
# A tibble: 10 × 9
   id       name                                    type            set inset insetIDs direaction  pvalue  qvalue
   <chr>    <chr>                                   <chr>         <int> <int> <chr>         <dbl>   <dbl>   <dbl>
 1 hsa04974 Protein digestion and absorption        Organismal S…    47     6 C00082;…      0.515 2.48e-5 0.00716
 2 hsa05230 Central carbon metabolism in cancer     Human Diseas…    37     5 C00082;…      0.611 9.48e-5 0.0137
 3 hsa00970 Aminoacyl-tRNA biosynthesis             Genetic Info…    52     5 C00082;…      0.451 4.89e-4 0.0471
 4 hsa04917 Prolactin signaling pathway             Organismal S…    11     2 C00082;…      1     8.43e-3 0.609
 5 hsa00470 D-Amino acid metabolism                 Metabolism; …    69     4 C00739;…      0     1.17e-2 0.674
 6 hsa04976 Bile secretion                          Organismal S…   174     6 C00486;…      0.654 2.36e-2 1
 7 hsa00360 Phenylalanine metabolism                Metabolism; …    49     3 C00082;…      0.841 2.49e-2 1
 8 hsa04080 Neuroactive ligand-receptor interaction Environmenta…    53     3 C01996;…      0.690 3.06e-2 1
 9 hsa00220 Arginine biosynthesis                   Metabolism; …    23     2 C00049;…      0     3.52e-2 1
10 hsa00983 Drug metabolism - other enzymes         Metabolism; …    63     3 C16618;…      0     4.74e-2 1
If the id of the metabolite in enrich_tibble is different from the id of the input, an error can occur, so you may first do an id_mapping to make sure that the id of the input is the same as that in enrich_tibble.
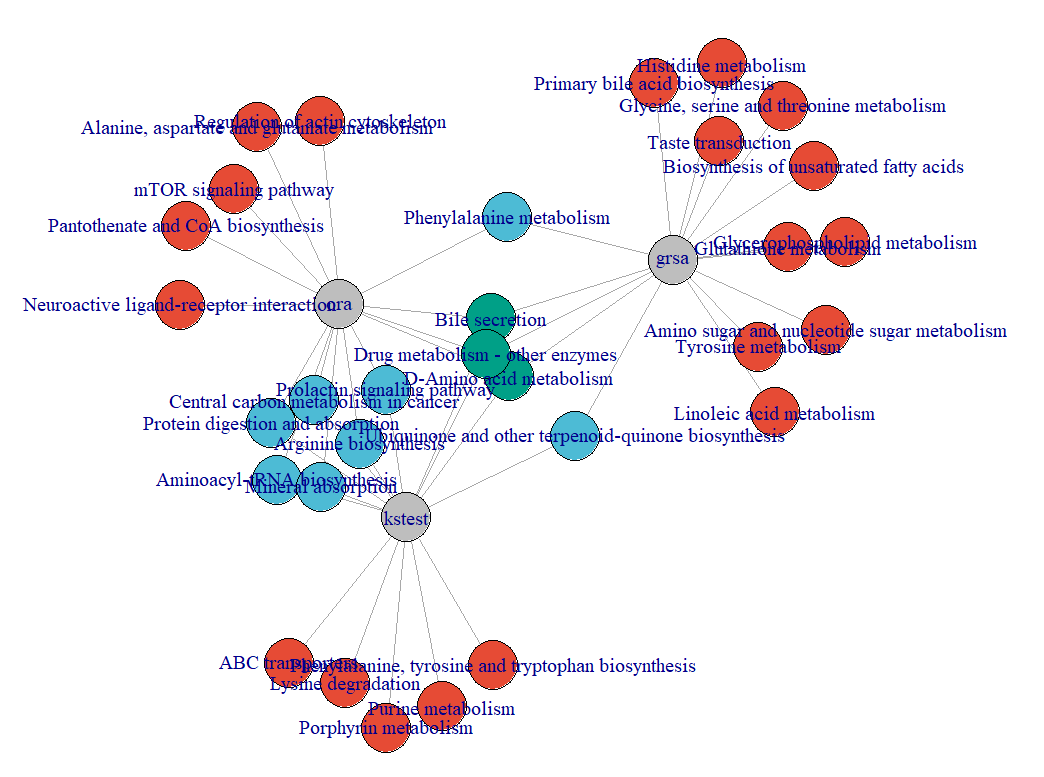
example_data <- id_mapping(input = example_data, from = "kegg_id", to = "hmdb_id", metabolites_tibble = metabolitesList$hmdb)plot_enrichmentRes(enrichmentRes = enrichmentRes_ora, plot_type = 1)plot_enrichmentRes(enrichmentRes = enrichmentRes_ora, plot_type = 2)plot_enrichmentRes(enrichmentRes = enrichmentRes_ora, plot_type = 3)plot_compareRes(enrichmentResList = list(ora = enrichmentRes_ora, kstest = enrichmentRes_kstest, grsa = enrichmentRes_grsa), plot_type = 1)plot_compareRes(enrichmentResList = list(ora = enrichmentRes_ora, kstest = enrichmentRes_kstest, grsa = enrichmentRes_grsa), plot_type = 2)