Men's College Basketball Play by Play Data
NOTE: As of 8/8/2018, the majority of functionality, including development of Play-by-Play scrapers, assist networks, and
win probability charts has moved to my new R package, ncaahoopR. Data and other miscellaneous
files will still be stored here, but core scripts whose functionally has been incorporated into the ncaahoopR package will be updated with the package, not in this repository.
NCAA_Hoops_PBP_Scraper.R: An R file used to scrape data from ESPN. The following functions are available.
get_pbp(team): Game entire 2017-18 Season's worth of play-by-play data for a given team.get_pbp_game(gameIDS): Get play-by-play data for a specific vector of ESPN game ids.get_roster(team): Get a particular team's roster.get_schedule(team): Get a team's schedule.get_game_ids(team): Get a vector of ESPN Game IDs for all games in whichteamplays in.get_date(gameID): Gets the date of a game given an ESPN Game ID.is.nit(gameID): Returns logicalT/Fwhether or not the game was part of the NIT
Note that team names must adhere to ESPN naming conventions. A full dictionary of team names used by ESPN is provided in ids.csv Note that play by play data is not available for all games.
pbp_2016_17/: A folder containing play by play csv files for each team for the 2016-17 season. Additionally, the file all_games.csv (too large for GitHub) contains all games scraped for the 2016-17 season. Each team's .csv file contains the following variables:
- play_id: The index of a play in a given game
- half: Overtimes denoted by 3, 4, etc.
- time_remaining_half: Time left in a given period of play, as it would appear on a scoreboard.
- secs_remaining: The number of seconds left in a given game.
- description: A description of what happened on the given play.
- home_score/away_score: Scores for the home and away teams, as denoted by ESPN. Even for neutral site games, a "home team" is denoted by choosing the team listed second in ESPN box scores.
- away/home: Home and Away teams. See above for treatment of neutral site games.
- home_favored_by: Number of points the home team is favored by, if available. (i.e. 6 corresponds with traditional Vegas line of -6.0)
pbp_2017_18/: Same as above for 2017-18 season.
Assist_Network.R: The function assist_net(team, node_col, season, rmv_bench), used to create college basketball assist networks.
teamis the ESPN team namenode_colis the node color for the graphseason: Options include "2016-17", "2017-18", or a vector of ESPN game IDs.rmv_bench: Logical. If TRUE, removes all players who aren't in the network.tree: Logical. If TRUE, draws graph in tree structure. If FALSE, draws graph in circlethree_weights: Logical. If TRUE, assisted three point shots are given 1.5 weight. If FALSE, assisted three point shots are given weight 1. In both cases, assisted 2 point shots are given weight 1.Message(default =NA) Option for custom message to replace graph title when using a subset of the season (e.g. conference play).
rosters_2016_17/: 2016-17 rosters for each team.
rosters_2017_18/: 2017-18 rosters for each team.
schedules_2017_18/: 2017-18 schedules for each team.
wp_model.R:/ Prepares data and builds win probability model (coefficients saved as object wp_hoops.csv). Requires all_games.csv and 2017_18_mid_season.csv.
wp_charts.R:/ Plots win probability chart for given game. Usage:wp_chart(ESPN_Game_ID, home_color, away_color, show_legend = T). The show_legend parameter is defaulted to TRUE. I recommend turning this parameter off when plotting more than one win probability charts on a single graph.
shiny_app:/ Code for the R Shiny App version of Assist Networks.
network_metric_leaders.R: A script for computing weighted/unweighted assist network metrics for all 351 Division 1 teams. The mid-season leaderboad for the 2017-18 season is stored in 1_2_2018_assist_leaderboard.csv.
kenpom_scraper.R: Scrapes data from kenpom.com main page and store results in kenpom.csv.
ncaa_color_scraper.R: Scrapes color hexcodes from http://teamcolorcodes.com for use in the ncaahoopR package.
-
Weighted Assist Network
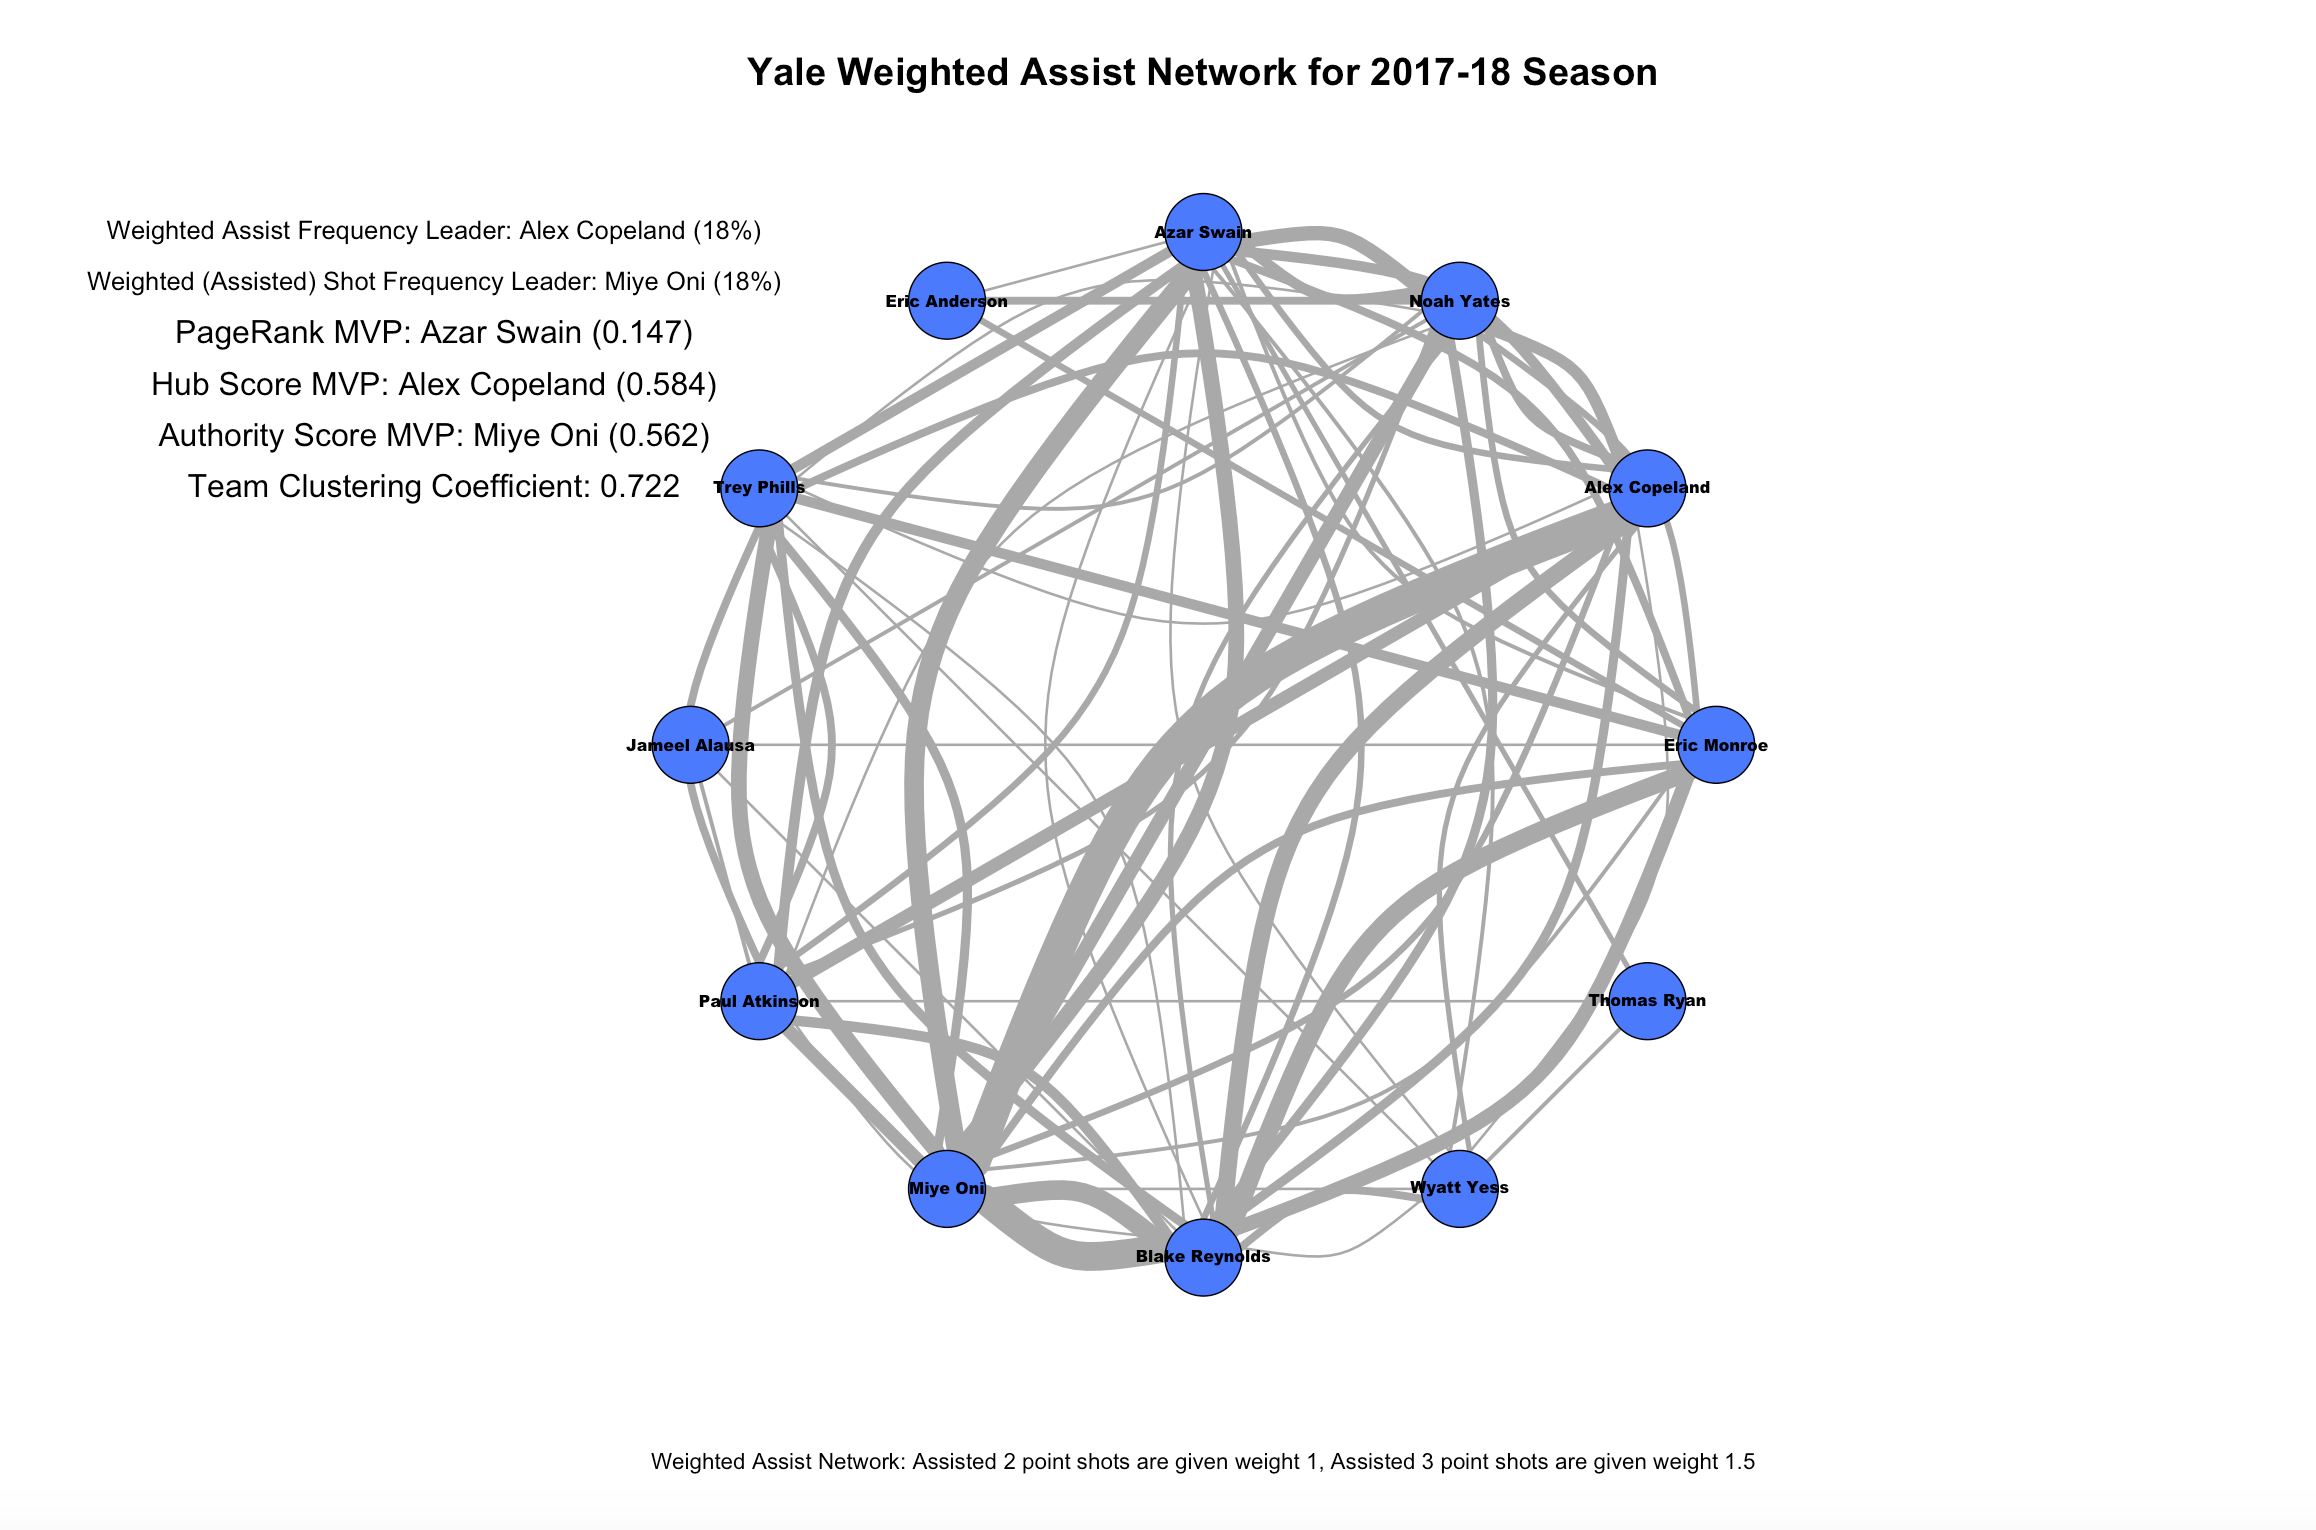
assist_net("Yale", "royalblue1", "2017-18", rmv_bench = T, tree = F, three_weights = T, message = NA) -
Tree Assist Network
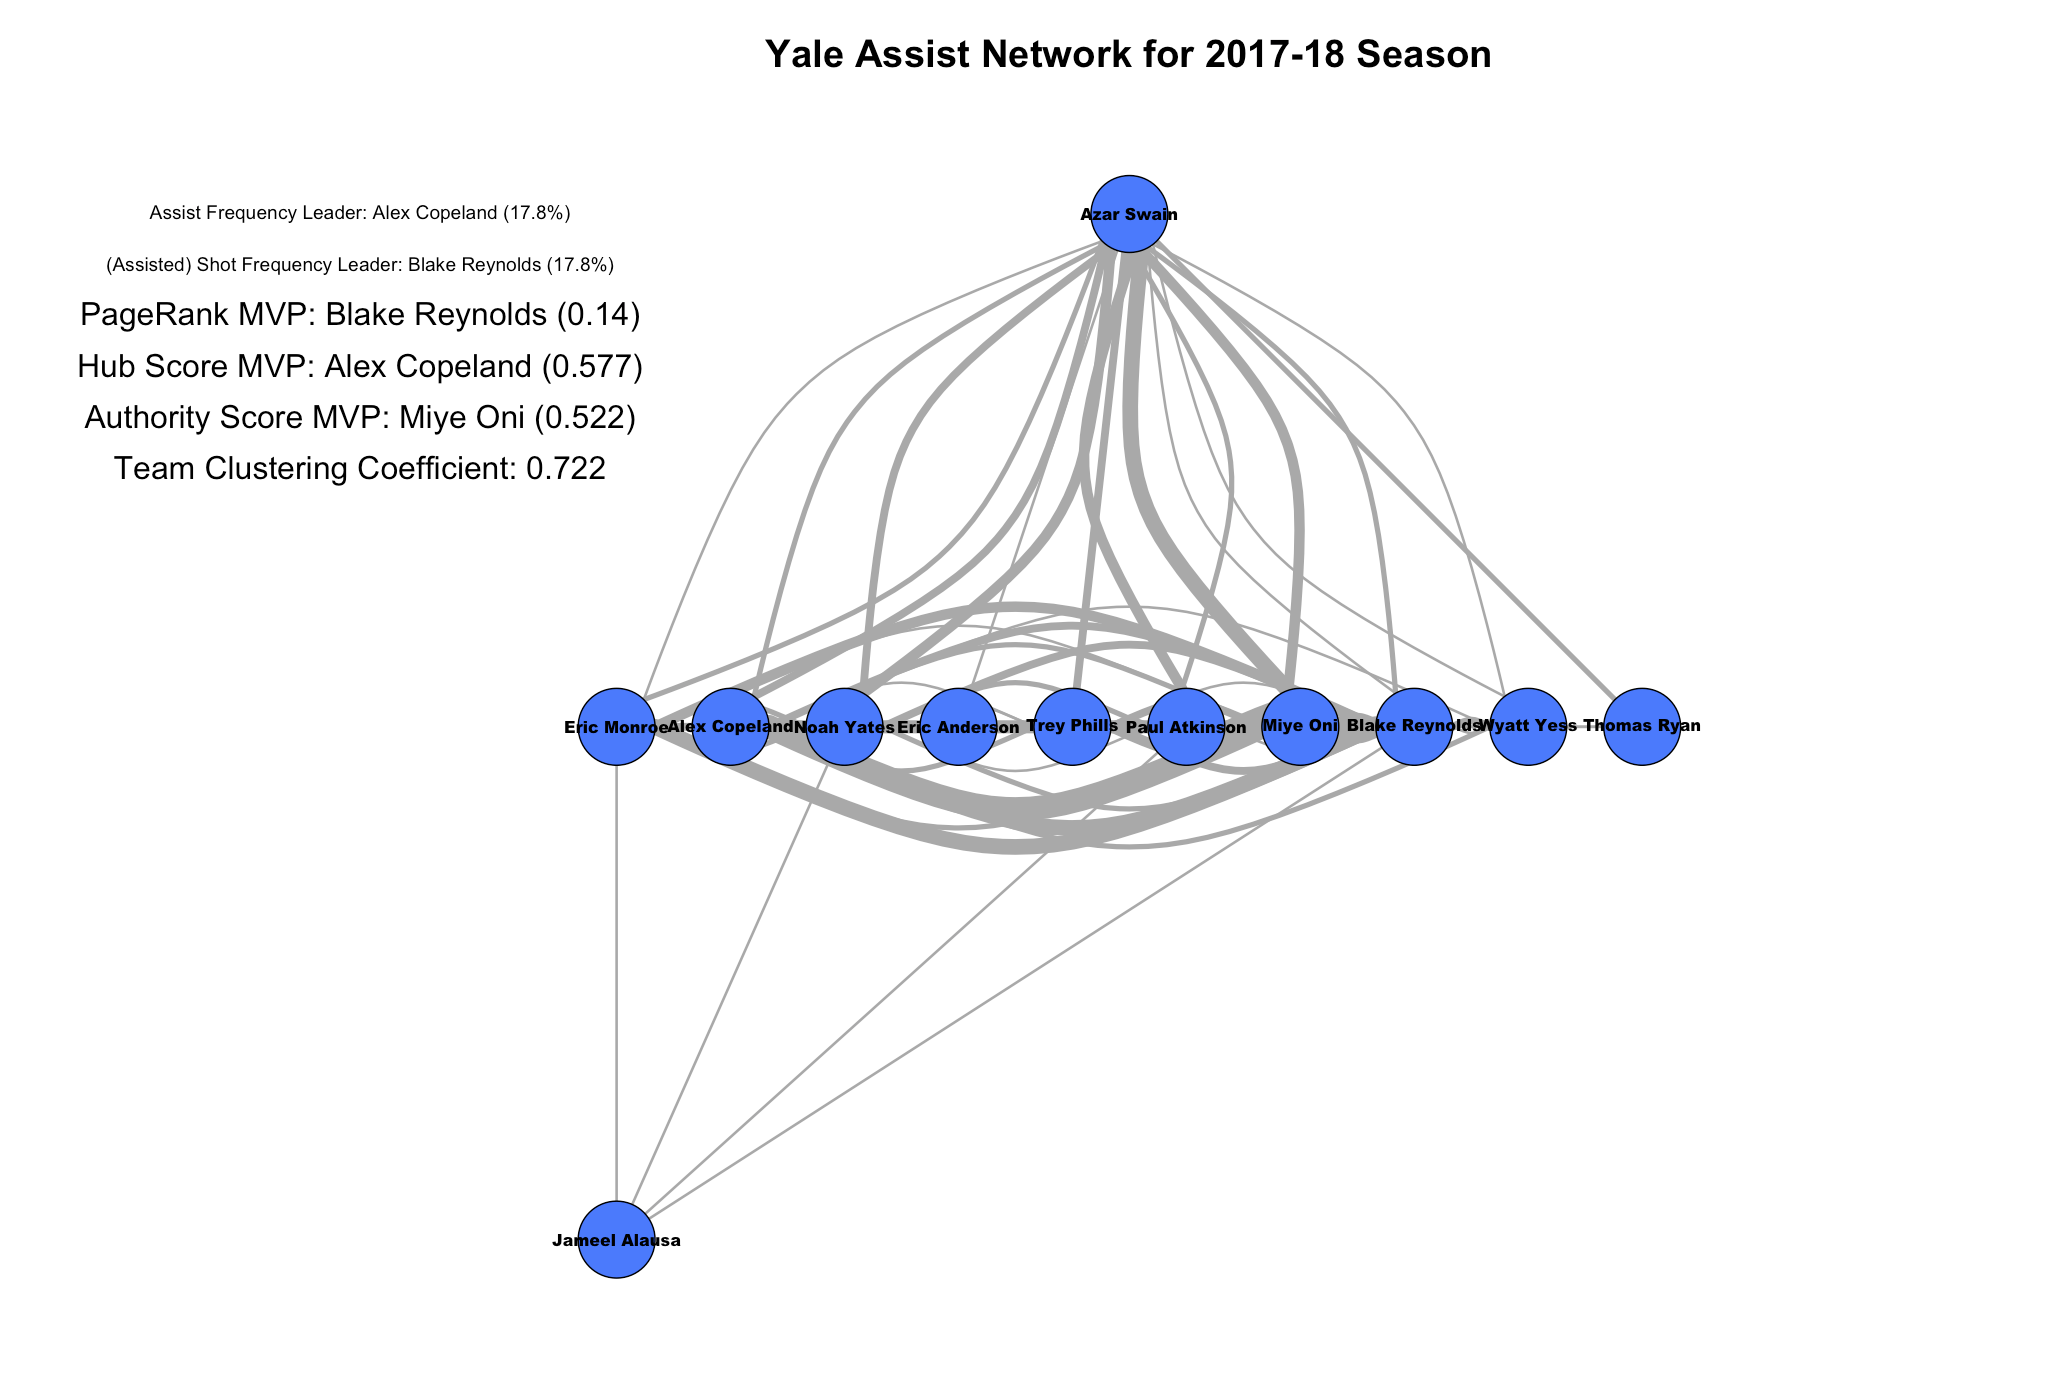
assist_net("Yale", "royalblue1", "2017-18", rmv_bench = T, tree = T, three_weights = F, message = NA)


- Texas A&M vs. Northern Iowa, March 20, 2016
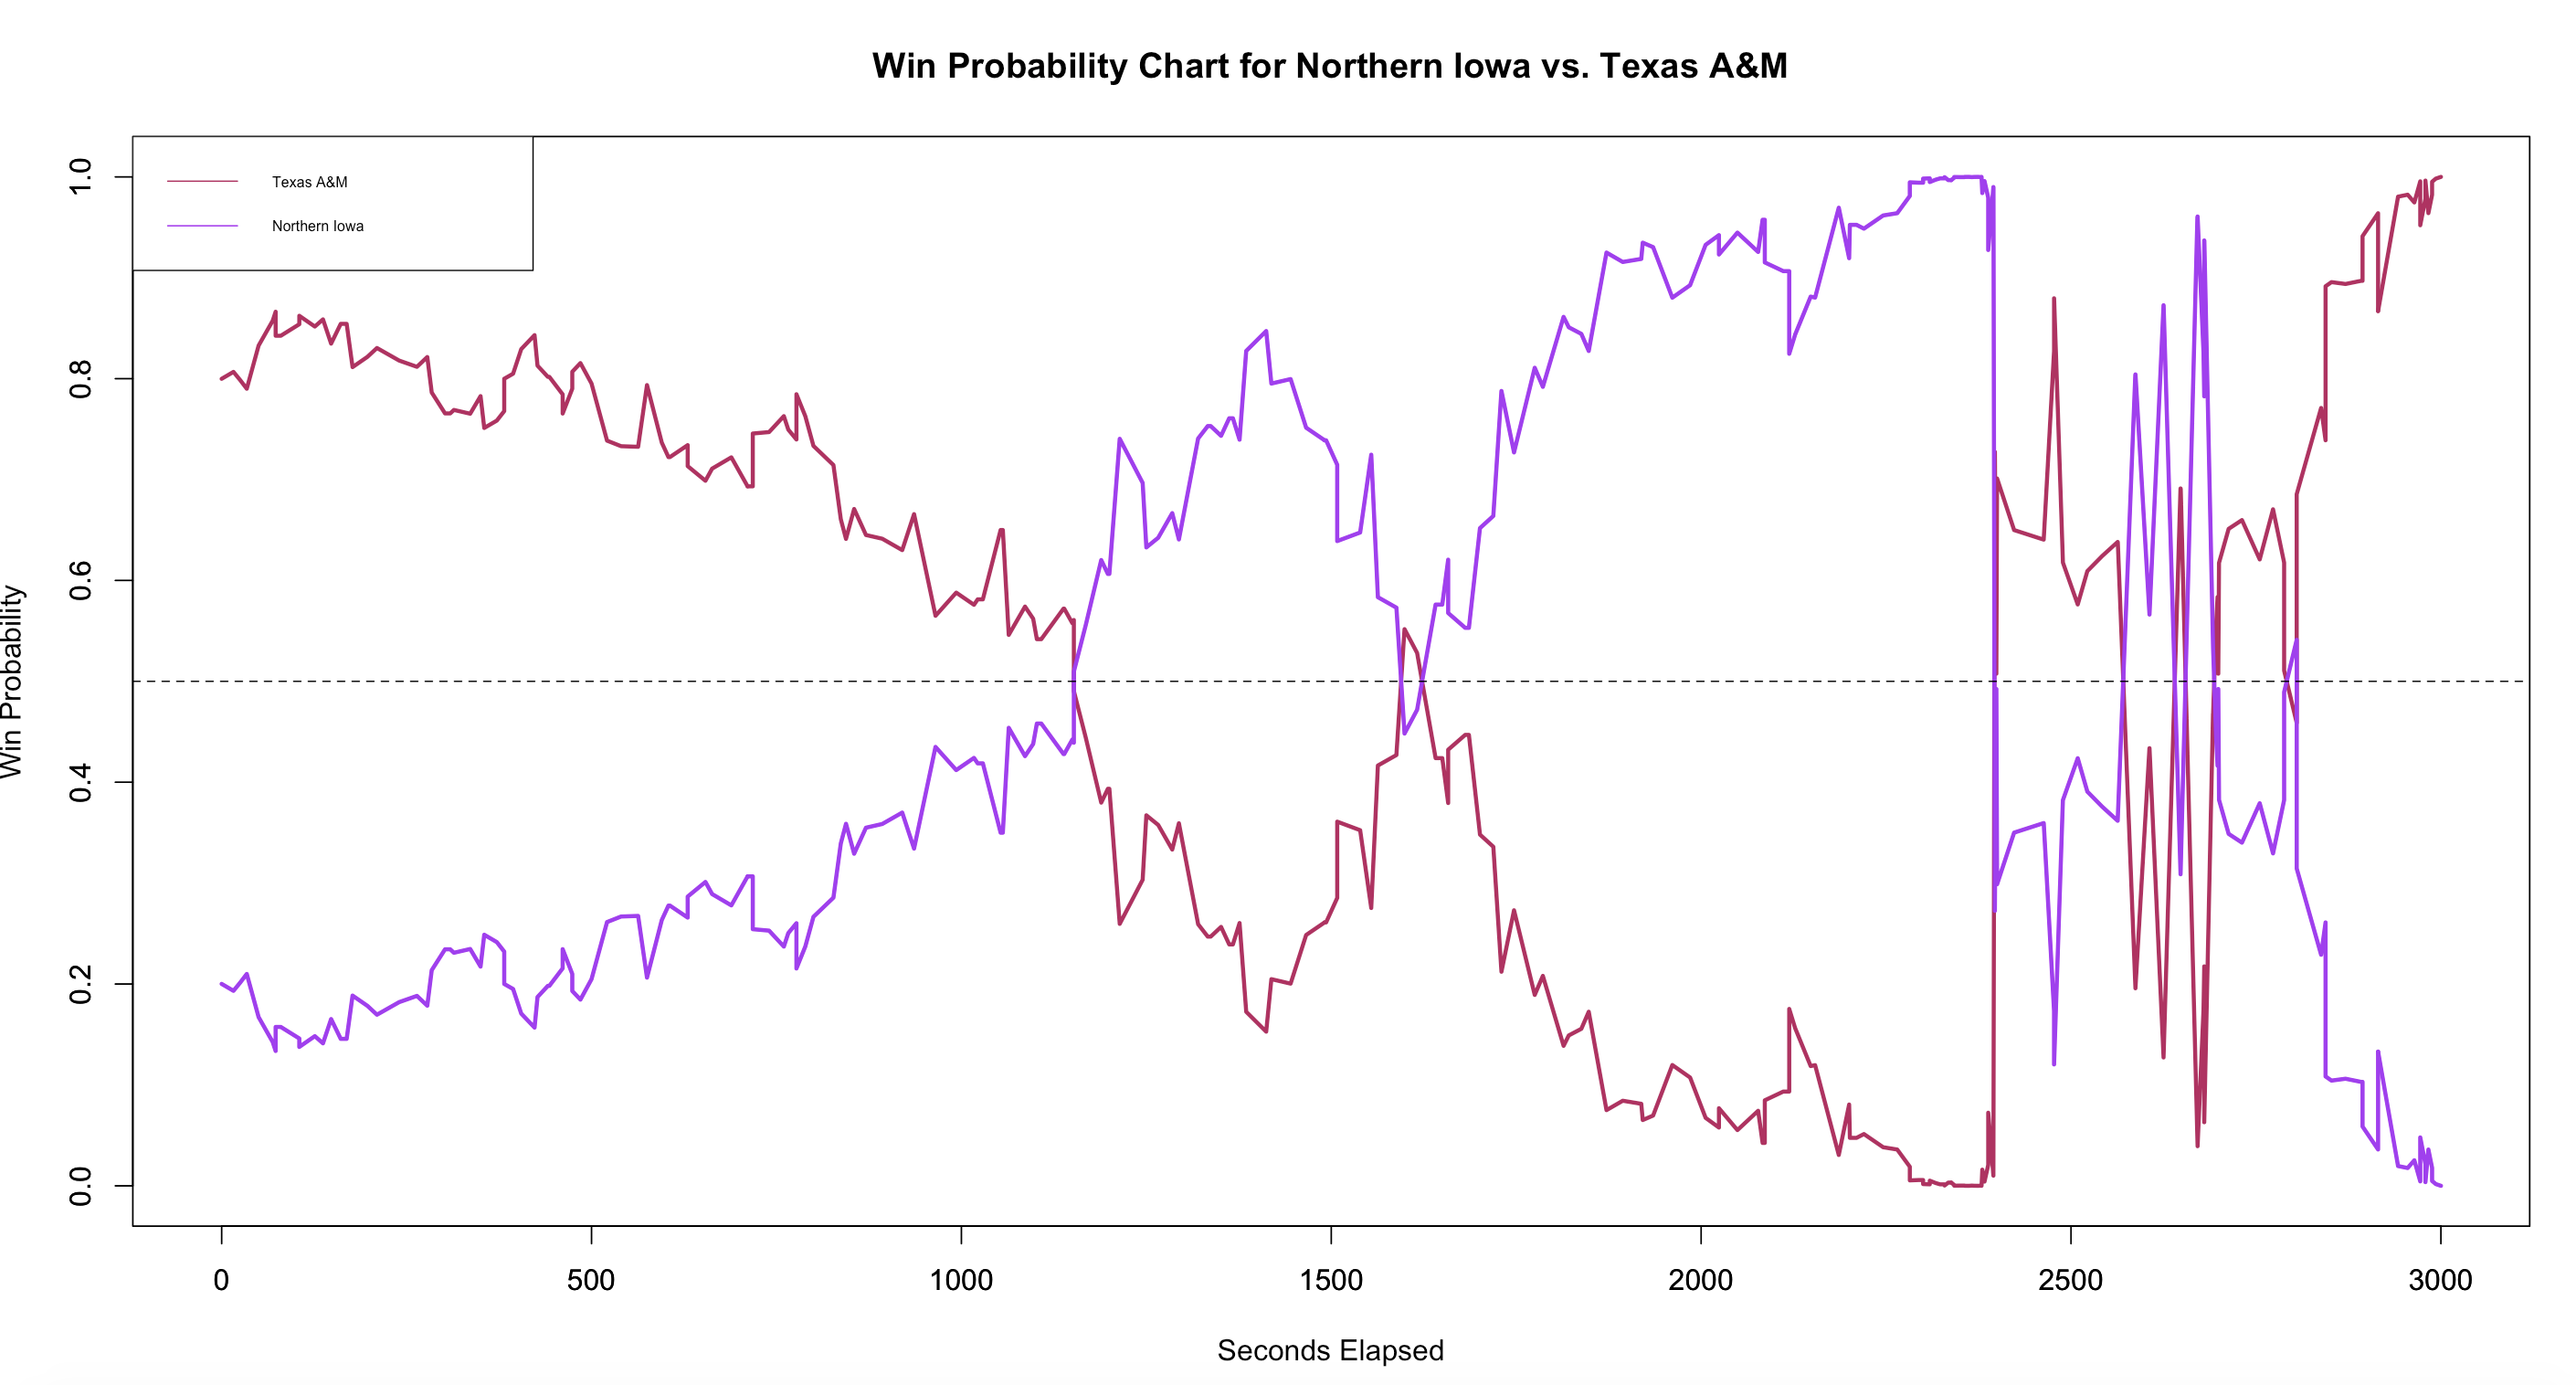
wp_chart(400872229, "maroon", "purple") - Cincinnati vs. Houston, March 11, 2018 (2018 AAC Championship Game)
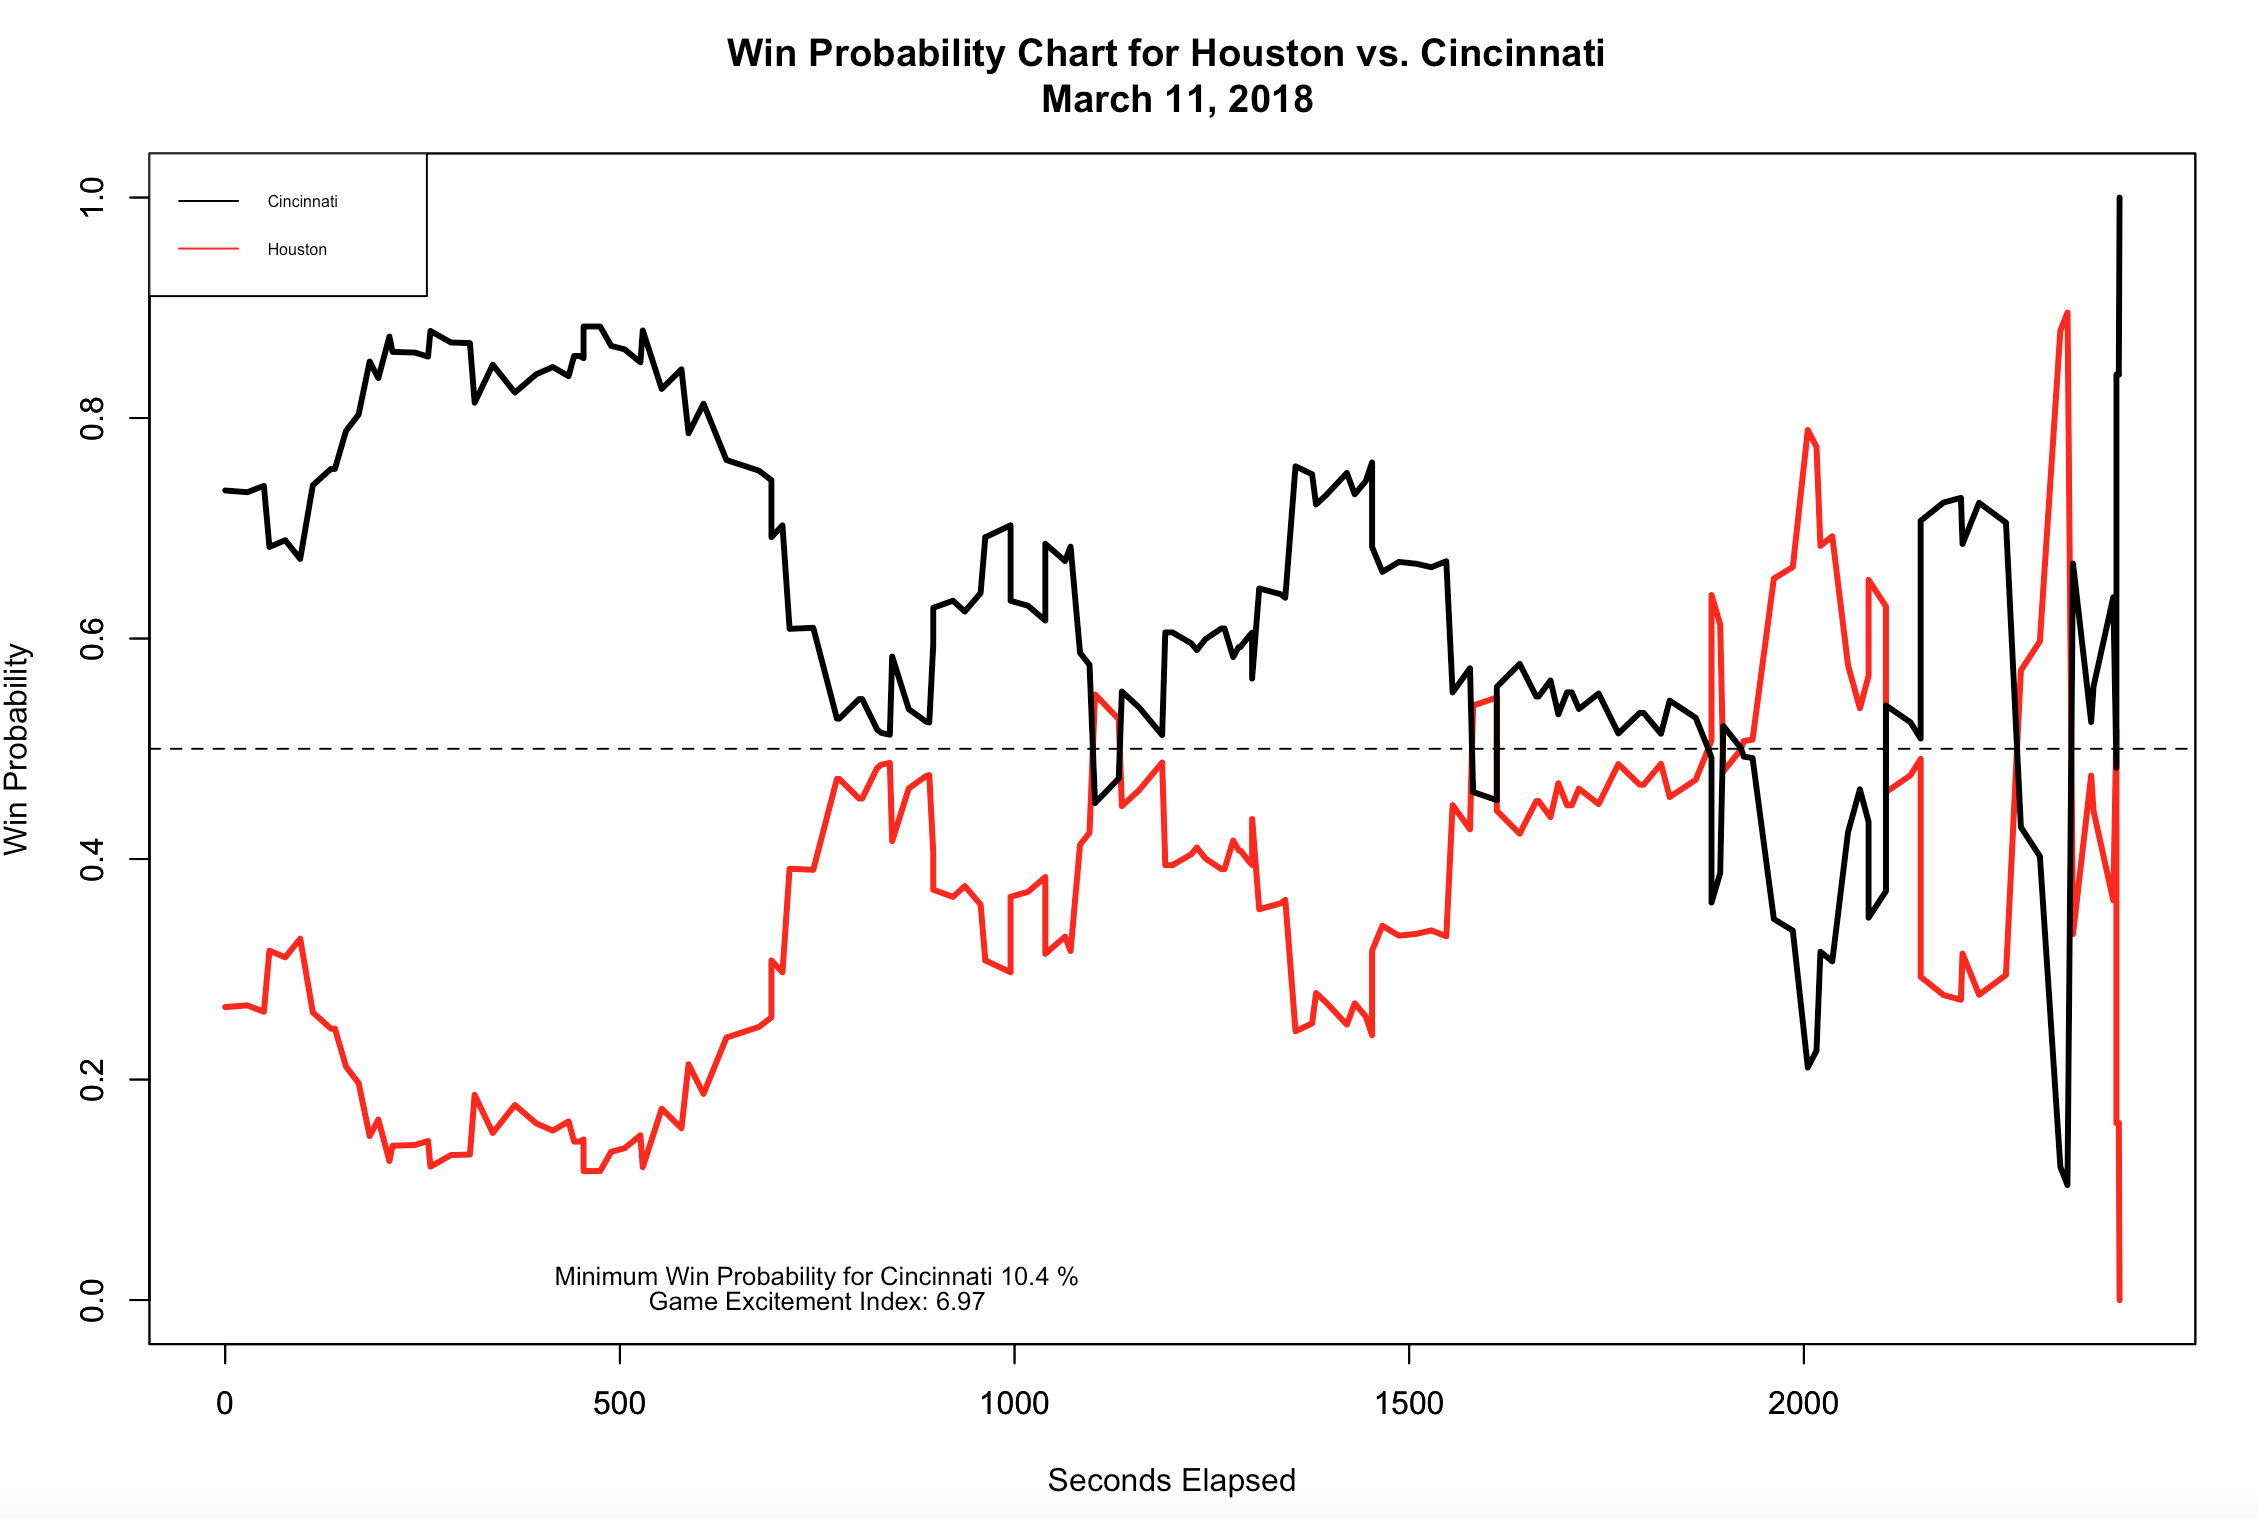 Update 3/13/2018: Added Game Excitement Index (GEI) to charts.

