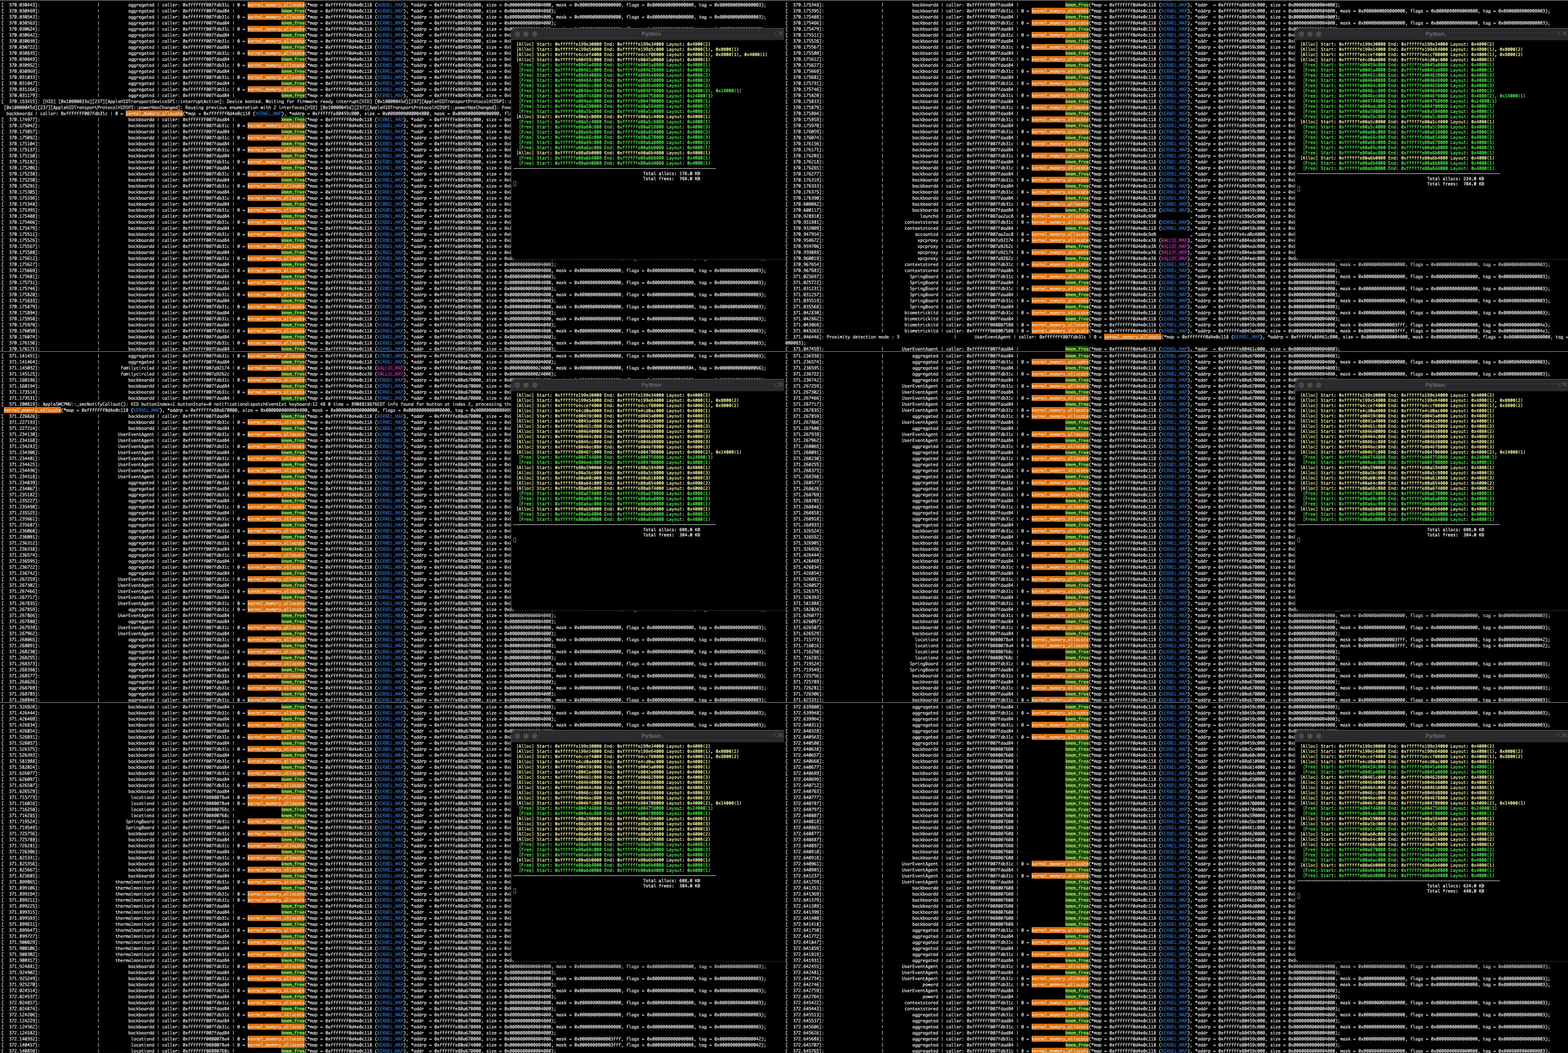
Watch your iOS kernel heap live as you groom it.
This is a kernel heap memory profiler built onto xnuspy that allows you to trace kernel heap allocations and freeing done through some of the (not all) allocator/freeing functions.
Hooks:
kernel_memory_allocatekmem_freeto log them to syslog.
- Your device must be checkra1n'able.
- Grab kernelcache for your device/iOS version (You can extract it from ipsw files).
- Open kernel_hooks.c. You'll see a bunch of hardcoded addresses (iPhone X iOS 14.6). You'll need to change them with the ones you obtained from your own kernelcache.
- Open kernelcache of your own device in a reverse engineering tool (IDA, Ghidra etc.).
- Search for string
kernel_memory_allocate: VM is not ready. The only xref to that is the functionkernel_memory_allocate(). SetADDROF_KERNEL_MEMORY_ALLOCATEinkernel_hooks.cwith that. - Search for string
kmem_free. The only xref to that is the functionkmem_free(). SetADDROF_KMEM_FREEinkernel_hooks.cwith that. - Search for string
trying to kalloc(Z_NOFAIL) with a large size (%zd). The only xref to that is a function that has 2 calls tokernel_memory_allocate()(note: IDA may fail decompiling this function (kalloc_large()), use IDA's disassembler; or Ghidra). Return address of the firstkernel_memory_allocate()(that is, the address of first instruction right below theBL kernel_memory_allocate) is the indicator we use to detect kalloc_map allocations. SetADDROF_KALLOC_MAP_INDICATORwith that return address. - While at it, set
ADDROF_KALLOC_MAP_IS_FULL_INDICATORwith the return address of the second call tokernel_memory_allocate()(This code in the XNU is what we use to detect kalloc_map/kernel_map allocations).
- Search for string
- Run
maketo compilekernel_hooks. - Download and compile xnuspy.
- Install xnuspy pongoOS module to your device as described in xnuspy's usage.
- Upload
klogof xnuspy to your device (klogis likedmesgwith live feed). - Upload
kernel_hooksto your device (to e.g/var/root/). - SSH into the device and run
./kernel_hooks. If kernel panics while installing hooks, reinstall xnuspy module to your device (step 6) and re-run./kernel_hooks. Keep this terminal open (press ctrl+c anytime to uninstall hooks). - On a second terminal, run
klogon the device,grepour logs, andteeits output into your pc for further analysis; like:ssh -p2222 root@localhost "stdbuf -o0 ./klog | grep 'caller: '" | tee /tmp/klog_data
- On a third terminal, run
python3 ./analyzer/spray_analyze.py /tmp/klog_datato get a live heap layout overview.
- Since we hook only two functions, the profiling is not that much precise. This way we only track big chunks (such as size > 0x4000). If you want to track smaller allocations, you'll probably need to hook
kalloc_extand possibly some others. But thinking of how many calls tokalloc_extis performed in a second, your device may run into an unstable/slow state and your syslog file size may blow up. - xnuspy may run into an unstable state after running for a long time (e.g half a day). If you notice this, rebooting is what you need to do.
- Verbatim from xnuspy's README: If you get
open: Resource busyafter runningklog, run this commandlaunchctl unload /System/Library/LaunchDaemons/com.apple.syslogd.plistand try again (P.S: You won't see the error message, due togrepping or not redirecting stderr, you'll just see it's not working. Do it). - If kernel panics while installing hooks, reinstall xnuspy module to your device (step 6) and re-run
./kernel_hooks.
- If you use iterm2, use "Add trigger" feature of it to highlight/colorize the output as shown in the screenshot above.
- To filter by process name, just add another grep:
stdbuf -o0 ./klog | grep "caller:" | grep <process_name>
- PARS Defense
- Justin Sherman for creating xnuspy
