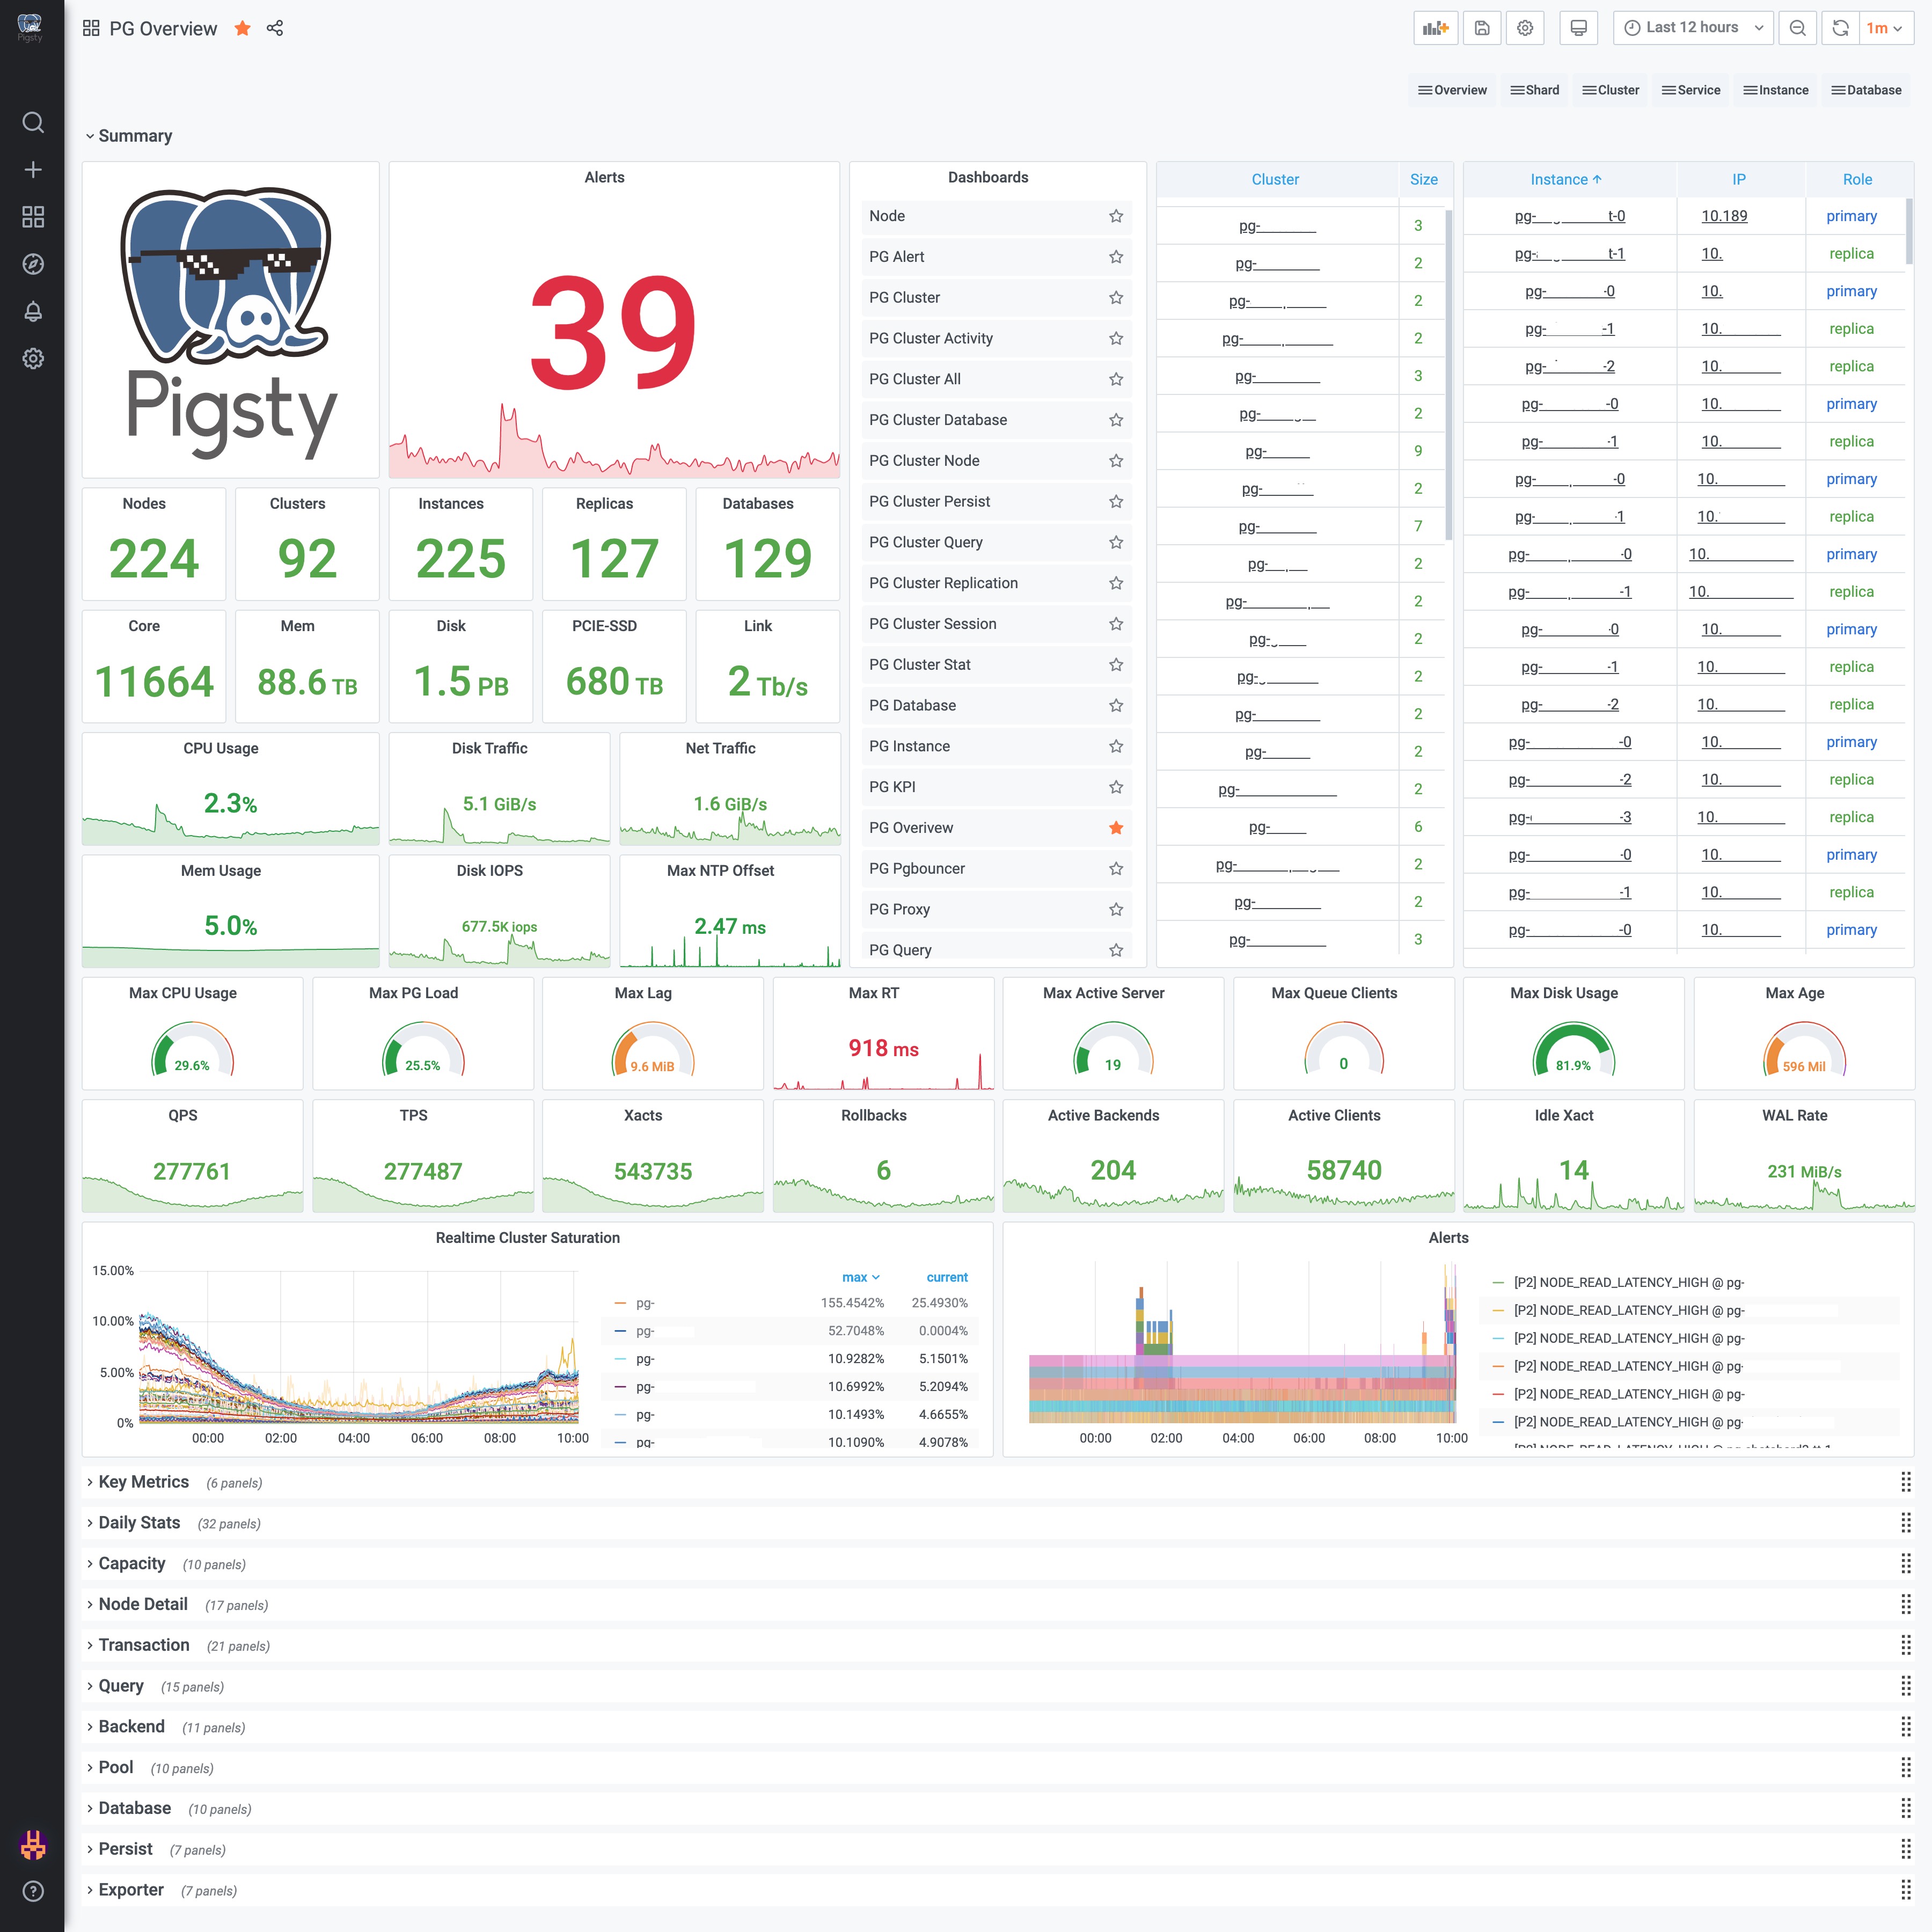
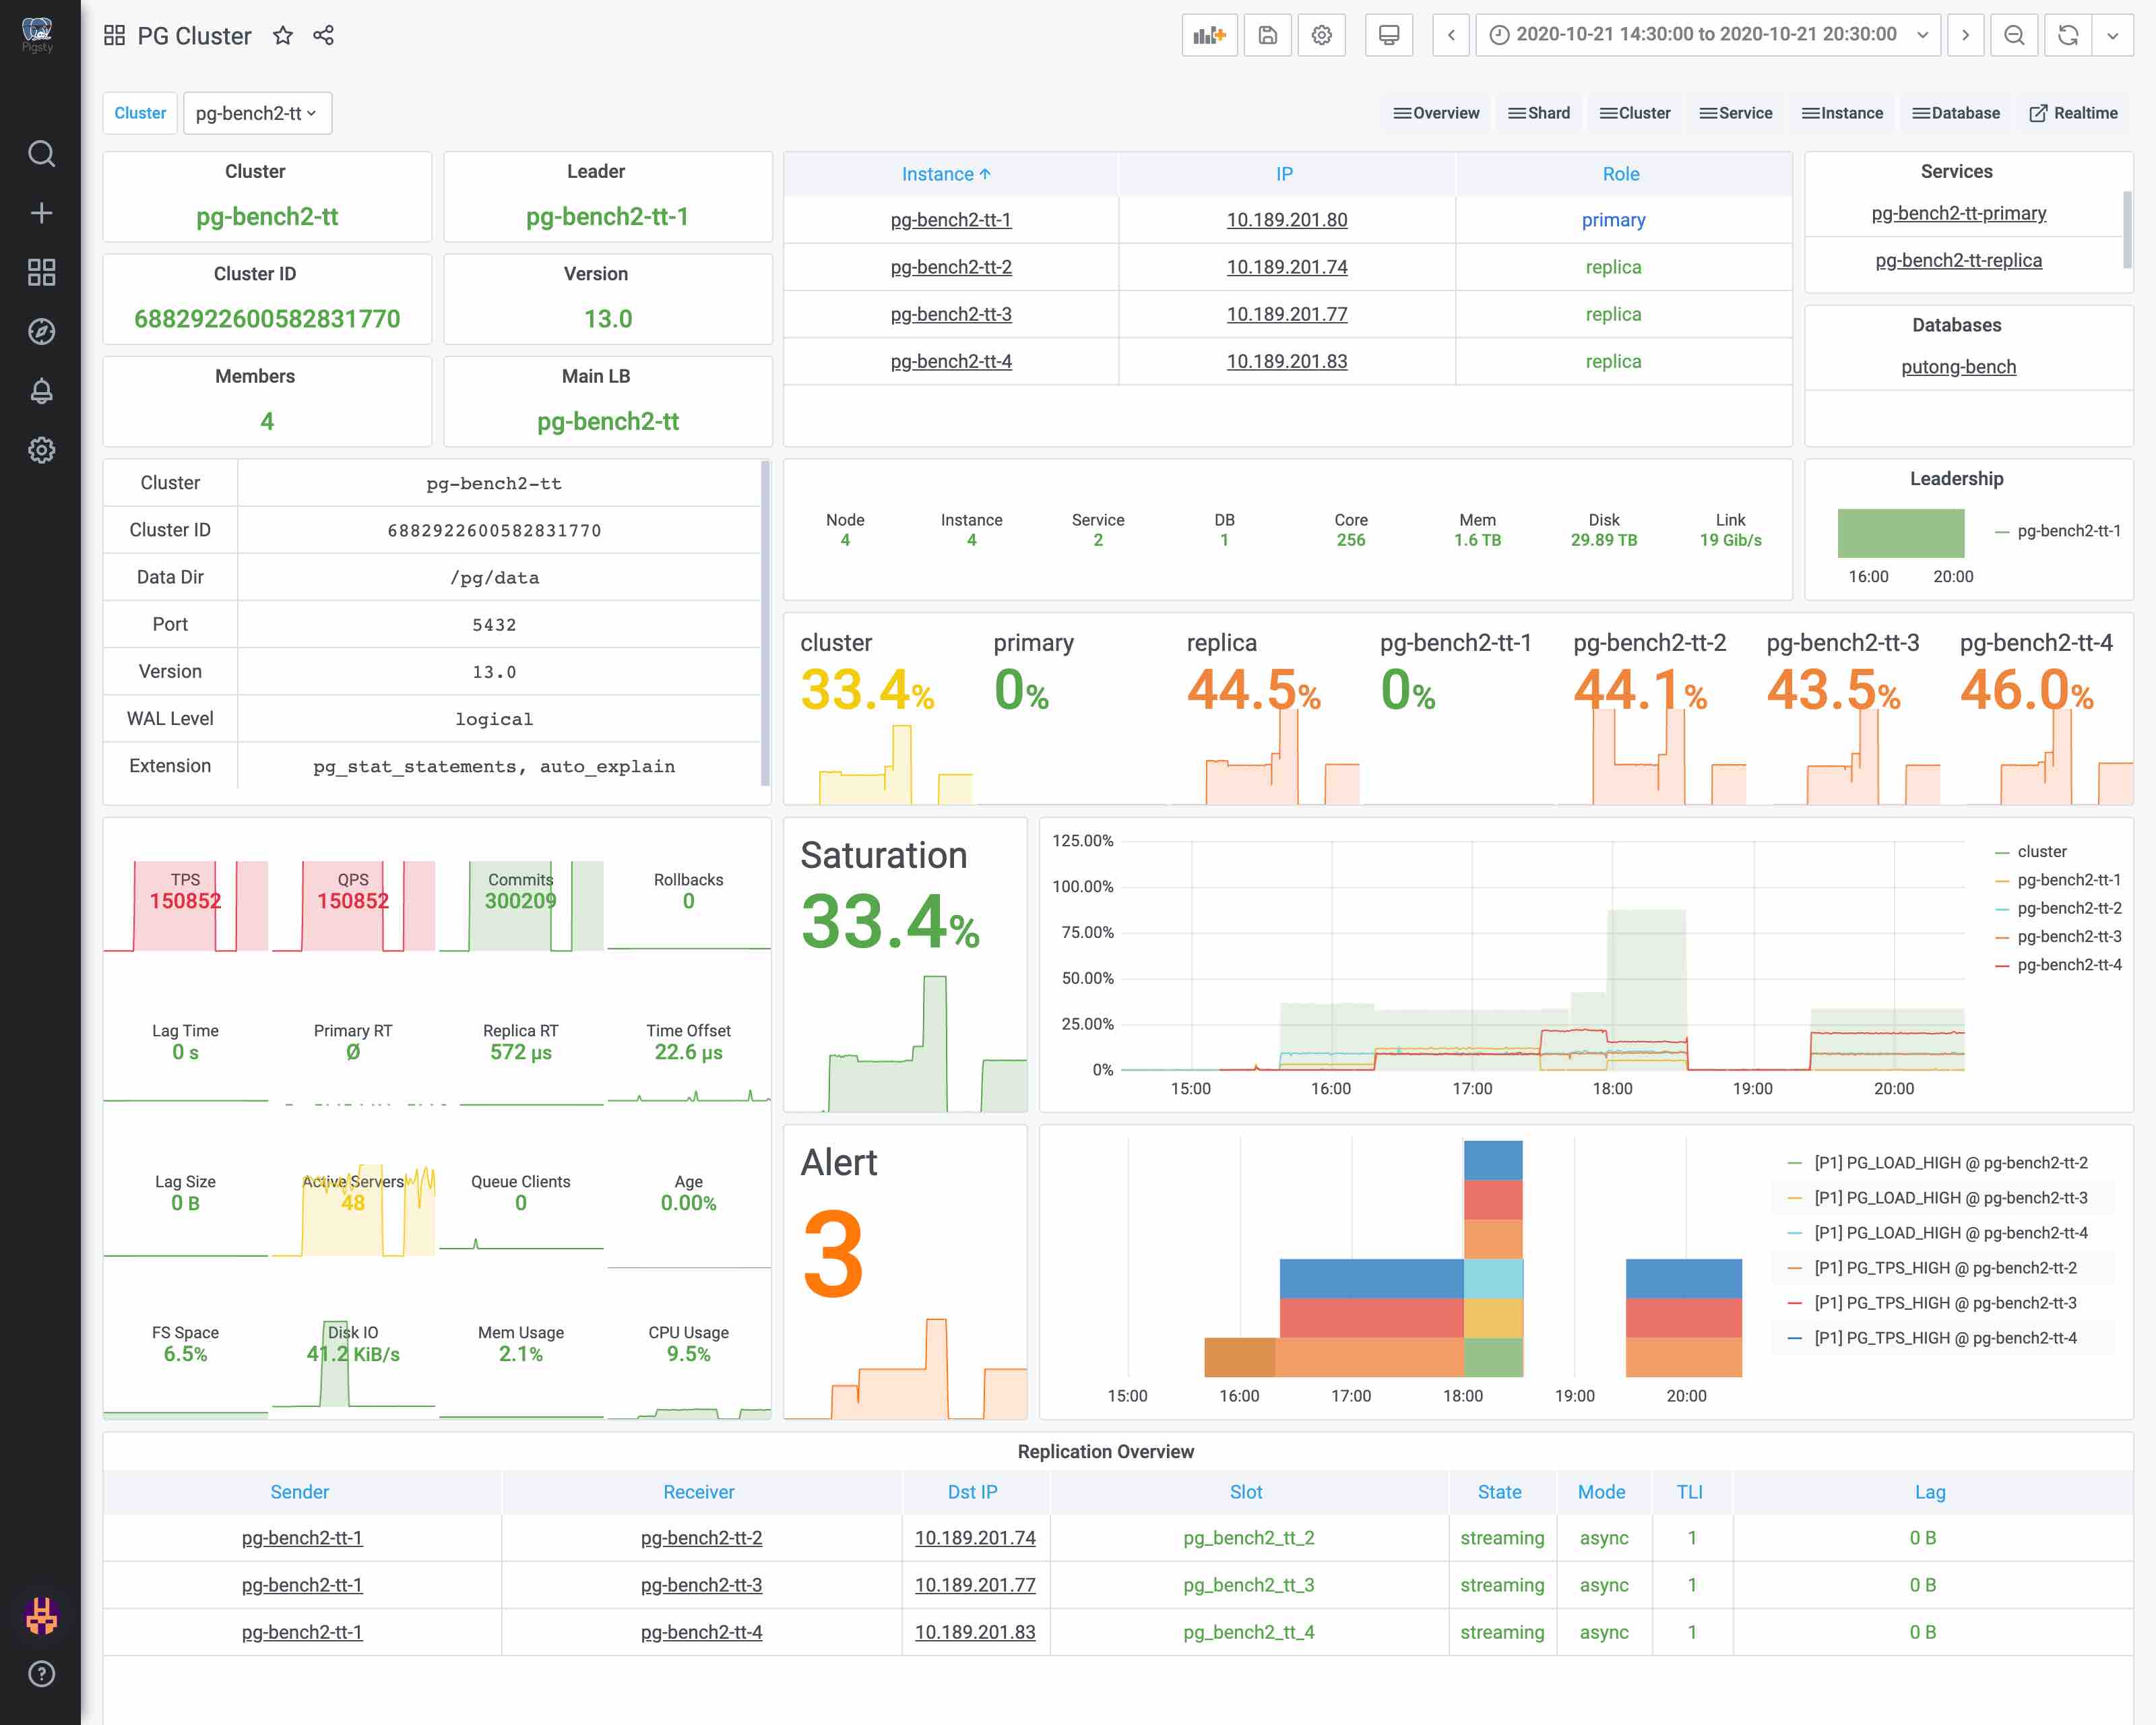
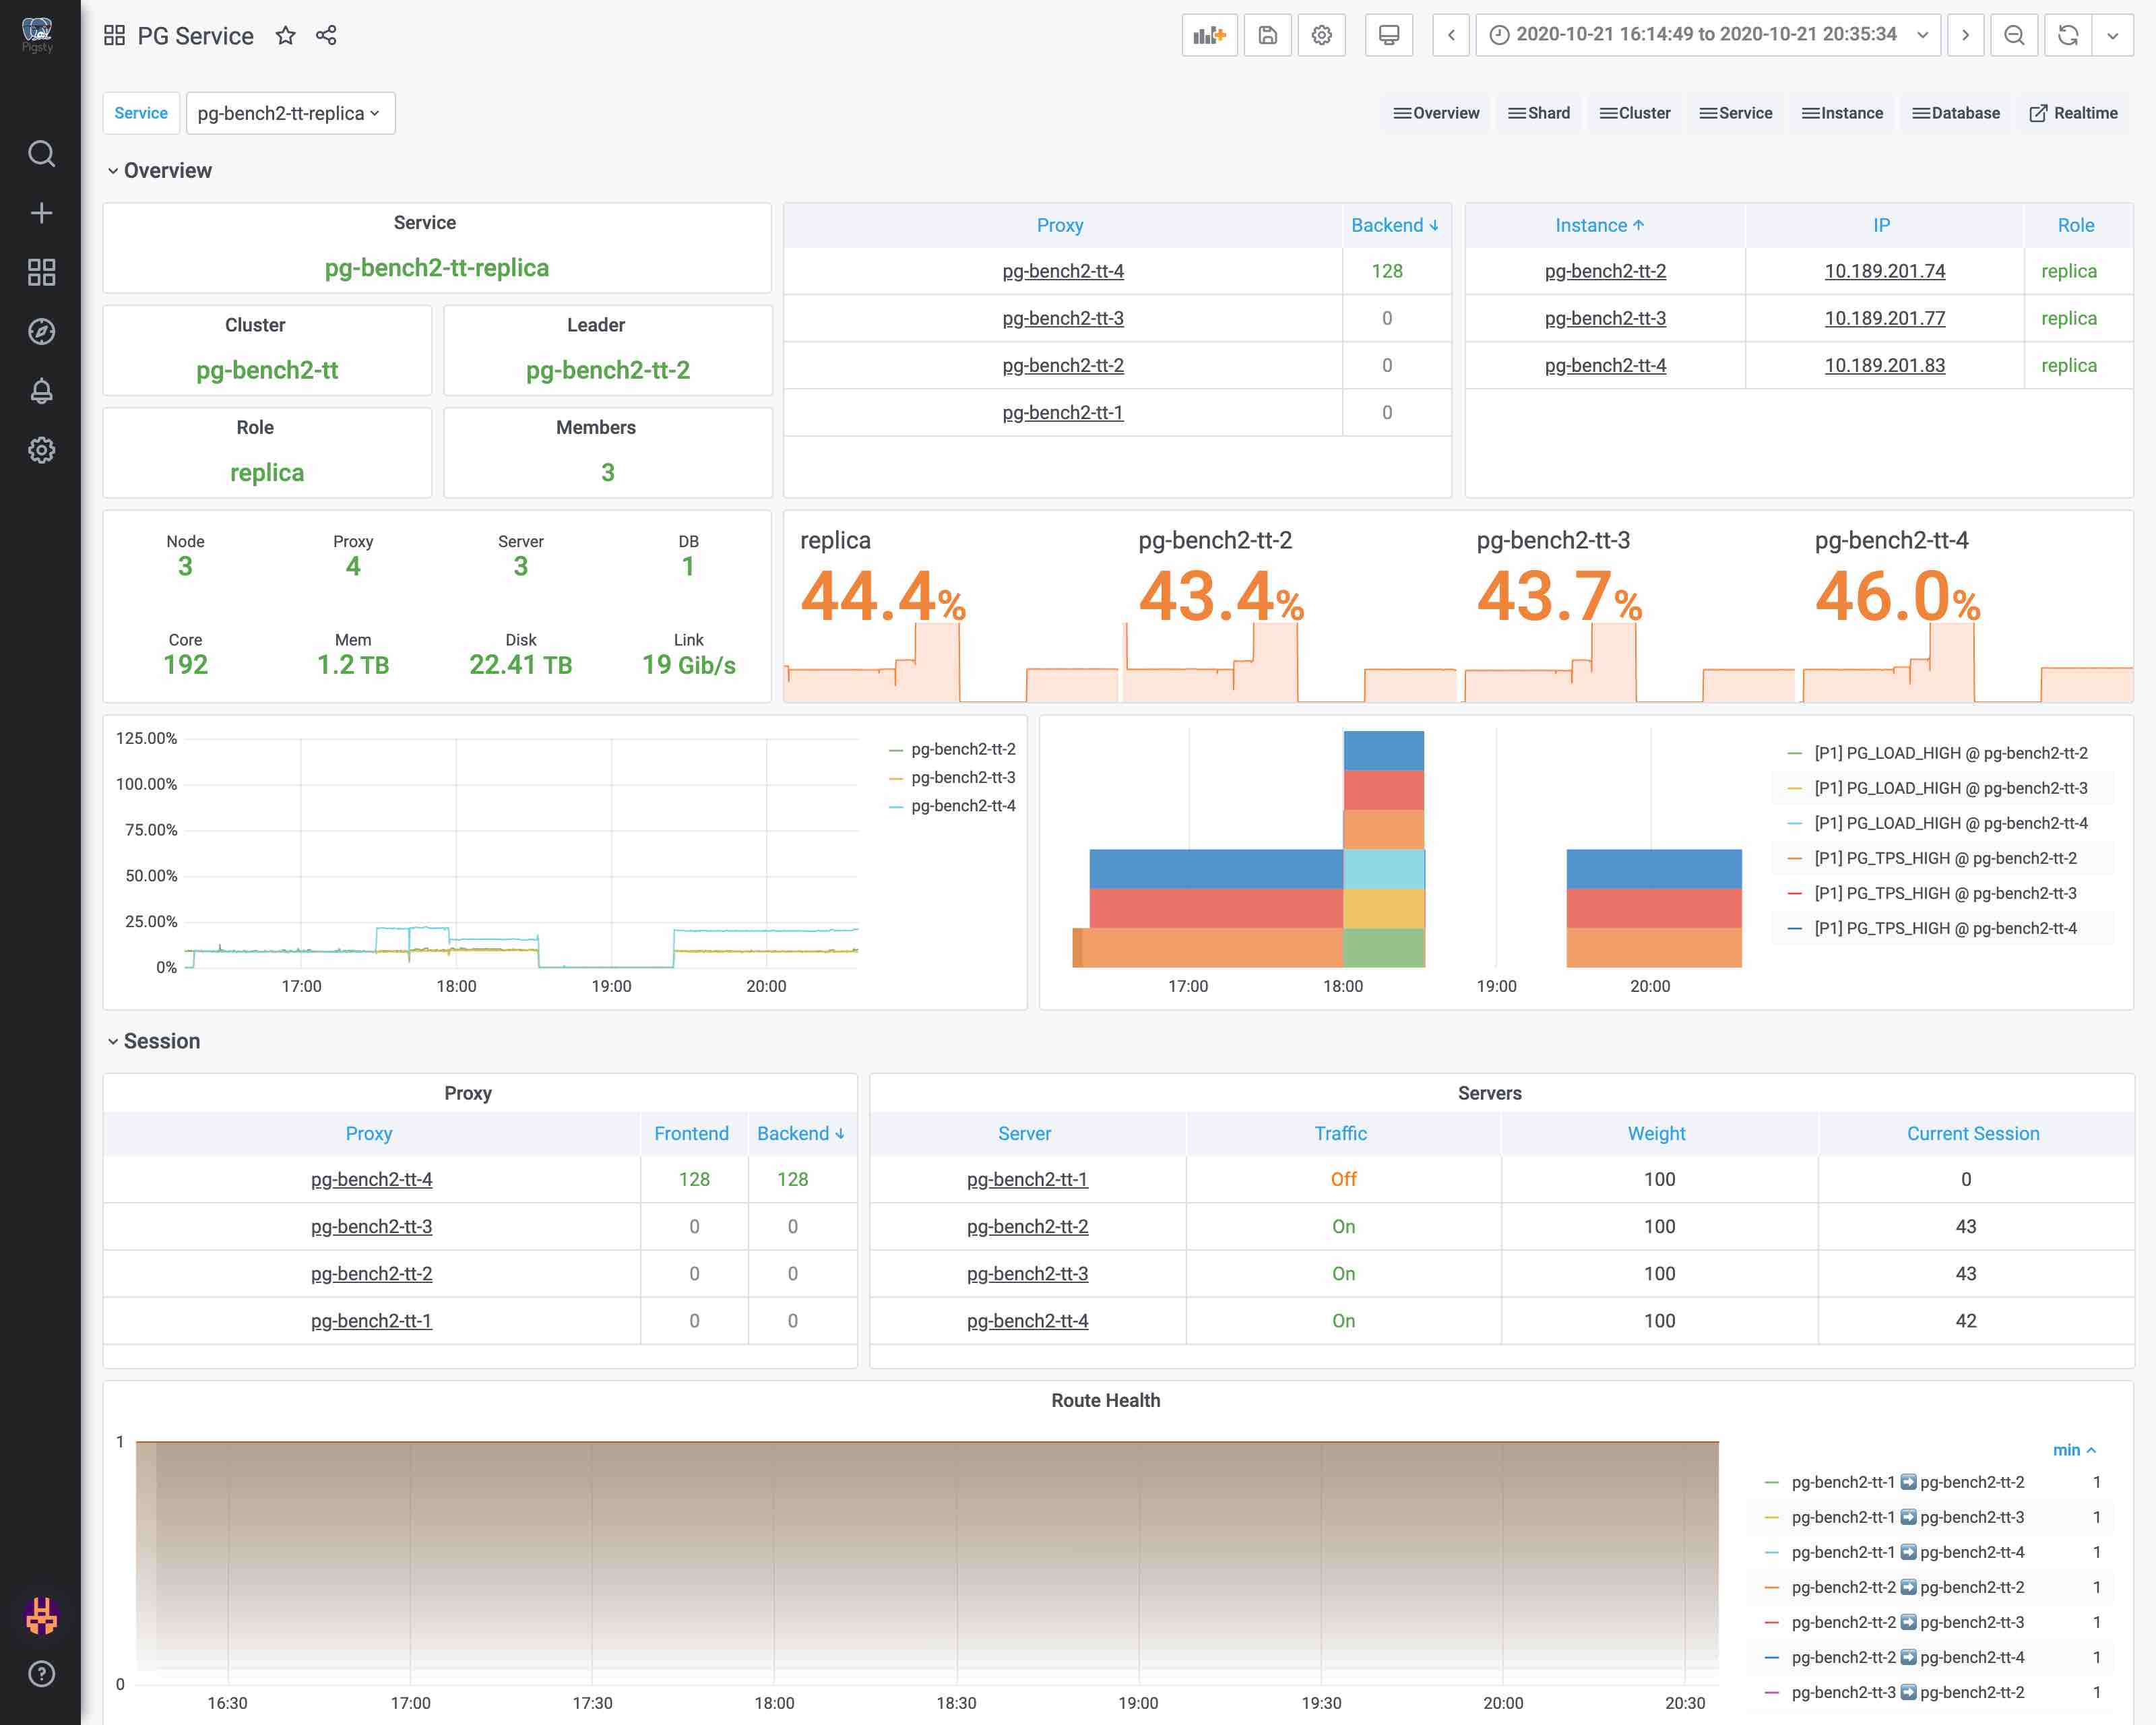
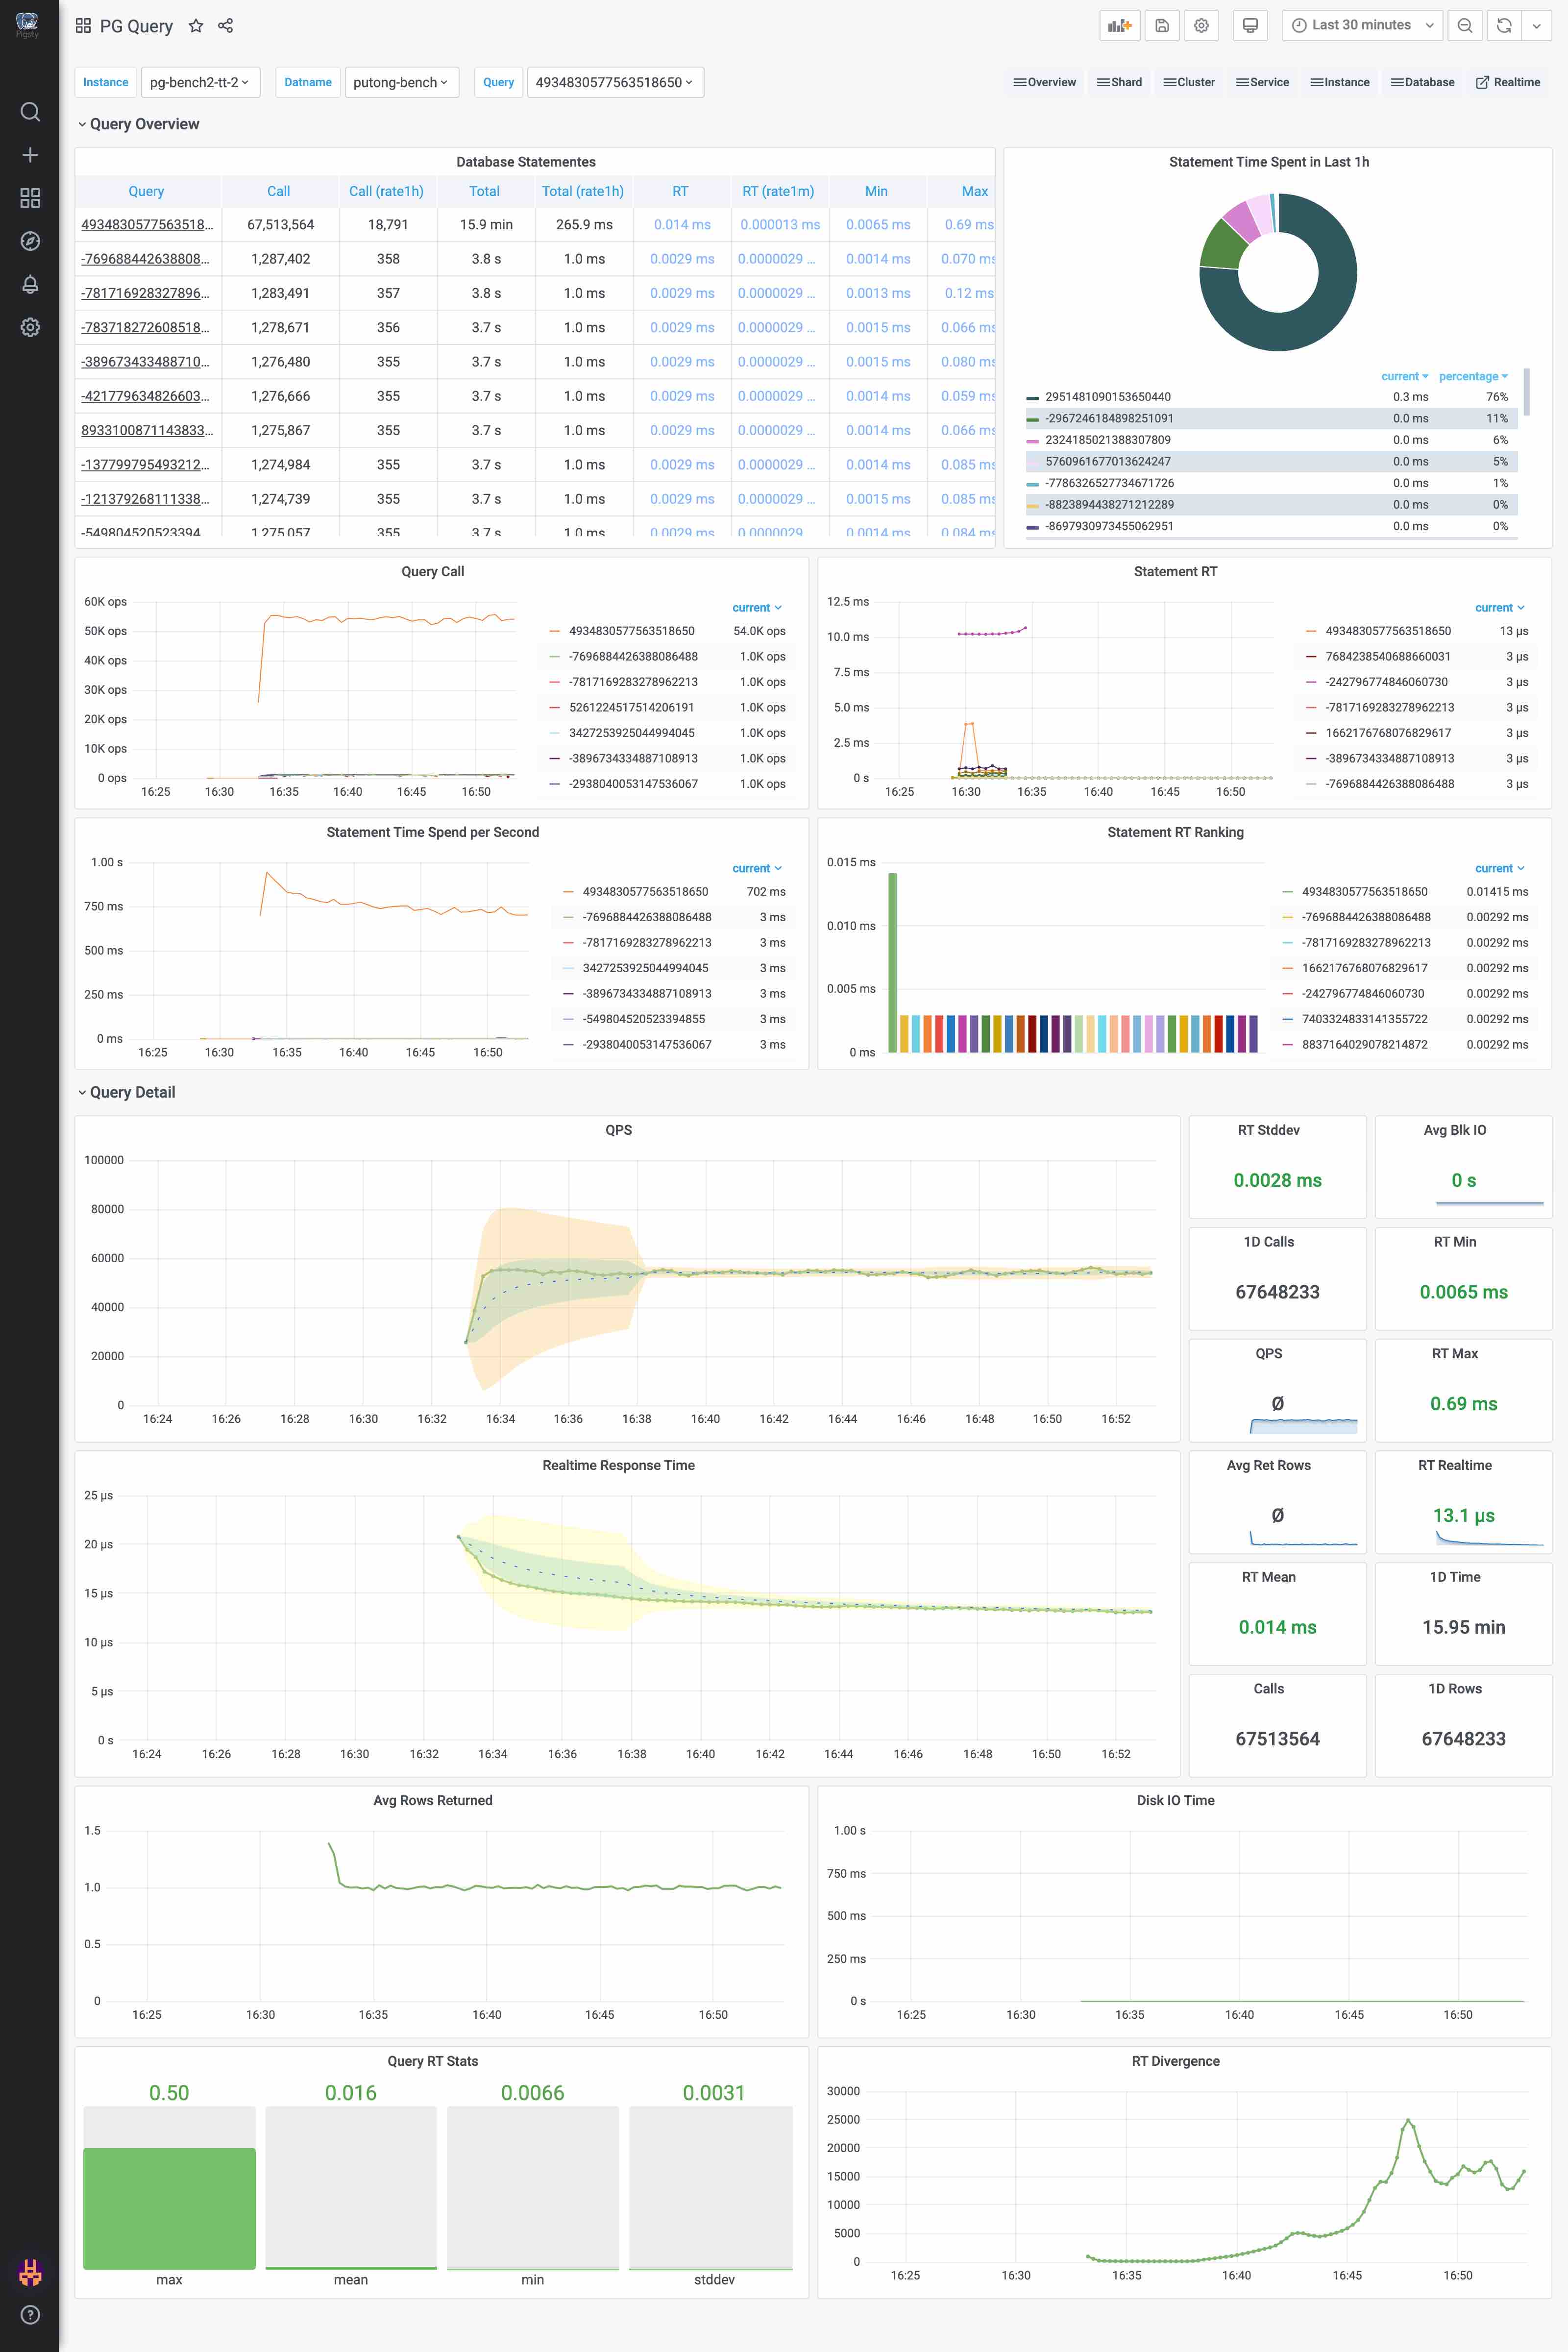
Prometheus exporter for PostgreSQL metrics. Gives you complete insight on your favourate elephant!
Latest binaries & rpms can be found on release page. Supported pg version: PostgreSQL 9.4+ & Pgbouncer 1.8+. Default collectors definition is compatible with PostgreSQL 10,11,12,13.
Latest pg_exporter version: 0.3.1
-
Support both Postgres & Pgbouncer
-
Flexible: Almost all metrics are defined in customizable configuration files in SQL style.
-
Fine-grained execution control (Tags Filter, Facts Filter, Version Filter, Timeout, Cache, etc...)
-
Dynamic Planning: User could provide multiple branches of a metric queries. Queries matches server version & fact & tag will be actually installed.
-
Configurable caching policy & query timeout
-
Rich metrics about
pg_exporteritself. -
Auto discovery multi database in the same cluster (multiple database scrape TBD)
-
Tested and verified in real world production environment for years (200+ Nodes)
-
Metrics overhelming! Gives you complete insight on your favourate elephant!
-
(Pgbouncer mode is enabled when target dbname is
pgbouncer)
To run this exporter, you will need two things
- Where to scrape: A postgres or pgbouncer URL given via
PG_EXPORTER_URLor--url - What to scrape: A path to config file or directory, by default
./pg_exporter.yamlor/etc/pg_exporter
export PG_EXPORTER_URL='postgres://postgres:password@localhost:5432/postgres'
export PG_EXPORTER_CONFIG='/path/to/conf/file/or/dir'
pg_exporter
pg_exporter only built-in with 3 metrics: pg_up,pg_version , and pg_in_recovery. All other metrics are defined in configuration files . You cound use pre-defined configuration file: pg_exporter.yaml or use separated metric query in conf dir.
Wanna see what pg_exporter can do?
Check this out, It's an entire monitoring system based on pg_exporter!
Pigsty -- Postgres in Graphic STYle
Parameter could be given via command line arguments or environment variables.
usage: pg_exporter [<flags>]

Flags:
  --help                        Show context-sensitive help (also try --help-long and --help-man).
  --url=URL                     postgres target url
  --config="pg_exporter.yaml"   path to config dir or file
  --label=""                    constant lables: separated list label=value pair
  --tag=""                      tags, separated list of server tag
  --disable-cache               force not using cache
  --auto-discovery              automatically scrape all database for given server (TBD)
  --exclude-database="postgres,template0,template1"
                                excluded databases when enabling auto-discovery
  --namespace=""                prefix of built-in metrics, (pg|pgbouncer) by default
  --fail-fast                   fail fast instead of waiting during start-up
  --web.listen-address=":9630"  prometheus web server listen address
  --web.telemetry-path="/metrics"
                                URL path under which to expose metrics.
  --dry-run                     dry run and print raw configs
  --explain                     explain server planned queries
  --version                     Show application version.
  --log.level="info"            Only log messages with the given severity or above. Valid levels: [debug, info, warn, error, fatal]
--log.format="logger:stderr" Set the log target and format. Example: "logger:syslog?appname=bob&local=7" or "logger:stdout?json=true"--urlorPG_EXPORTER_URLdefines where to scrape, it should be a valid DSN or URL. (note thatsslmode=disablemust be specifed explicitly for database that does not using SSL)--configorPG_EXPORTER_CONFIGdefines how to scrape. It could be a single yaml files or a directory contains a series of separated yaml config. In the later case, config will be load in alphabetic order.--labelorPG_EXPORTER_LABELdefines constant labels that are added into all metrics. It should be a comma separated list oflabel=valuepair.--tagorPG_EXPORTER_TAGwill mark this exporter with given tags. Tags are comma separated list of string. which could be used for query filtering and execution control.--disable-cacheorPG_EXPORTER_DISABLE_CACHEwill disable metric cache.--auto-discoveryorPG_EXPORTER_AUTO_DISCOVERYwill automatically spawn peripheral servers for other databases in target PostgreSQL server. except for those listed in--exclude-databse. (Not implemented yet)--exclude-databaseorPG_EXPORTER_EXCLUDE_DATABASEis a comma separated list of database name. Which are not scrapped when--auto-discoveryis enabled--namespaceorPG_EXPORTER_NAMESPACEdefineds internal metrics prefix, by defaultpg|pgbouncer.--fail-fastorPG_EXPORTER_FAIL_FASTis a flag. During start-up,pg_exporterwill wait if target is down. with--fail-fast=true,pg_exporterwill fail instead of wait on start-up procedure if target is down--listenAddressorPG_EXPORTER_LISTEN_ADDRESSis the endpoint that expose metrics--metricPathorPG_EXPORTER_TELEMETRY_PATHis the URL path under which to expose metrics.--dry-runwill print configuration files--explainwill actually connect to target server and planning queries for it. Then explain which queries are installed.
Here are pg_exporter REST APIs
# Fetch metrics (metrics path depends on parameters)
curl localhost:9630/metrics

# Reload configuration
curl localhost:9630/reload

# Explain configuration
curl localhost:9630/explain

# Aliveness health check (200 up, 503 down)
curl localhost:9630/up
curl localhost:9630/health
curl localhost:9630/liveness
curl localhost:9630/readiness

# traffic route health check

### 200 if not in recovery, 404 if in recovery, 503 if server is down
curl localhost:9630/primary
curl localhost:9630/leader
curl localhost:9630/master
curl localhost:9630/read-write
curl localhost:9630/rw

### 200 if in recovery, 404 if not in recovery, 503 if server is down
curl localhost:9630/replica
curl localhost:9630/standby
curl localhost:9630/slave
curl localhost:9630/read-only
curl localhost:9630/ro

### 200 if server is ready for read traffic (including primary), 503 if server is down
curl localhost:9630/readgo build
To build a static stand alone binary for docker scratch
CGO_ENABLED=0 GOOS=linux go build -a -ldflags '-extldflags "-static"' -o pg_exporterTo build a docker image, using:
docker build -t pg_exporter .
Or download latest prebuilt binaries on release page
A Redhat 7 / CentOS 7 rpm is shipped on release page. Includes:
Configs are core part of pg_exporter. Actually this project contains more lines of YAML than go.
- A monolith battery-include configuration file:
pg_exporter.yaml - Separated metrics definition in
conf - Example of how to write a config files:
doc.txt
Current pg_exporter is shipped with following metrics collector definition files
Supported version: PostgreSQL 10, 11, 12, 13
But you can still get PostgreSQL 9.4, 9.5, 9.6 support by switching to older version collector definition
- doc
- pg
- pg_meta
- pg_setting
- pg_replication
- pg_sync_standby
- pg_downstream
- pg_slot
- pg_walreceiver
- pg_size
- pg_bgwriter
- pg_recovery
- pg_checkpoint
- pg_slru
- pg_shmem
- pg_activity
- pg_wait
- pg_backend
- pg_xact
- pg_lock
- pg_query
- pg_vacuuming
- pg_indexing
- pg_clustering
- pg_backup
- pg_database
- pg_db
- pg_class
- pg_table
- pg_index
- pg_func
- pg_defpart
- pg_table_size
- pg_table_bloat
- pg_index_bloat
- pgbouncer_list
- pgbouncer_database
- pgbouncer_stat
- pgbouncer_pool
pg_exporter will generate approximately 200~300 metrics for completely new database cluster. For a real-world database with 10 ~ 100 tables, it may generate serveral 1k ~ 10k metrics. You may need modifying or disable some database-level metrics on database with serveral thousands or more tables in order to complete scrape in time.
Config files are using YAML format, there are lots of examples in the conf dir. and here is a sample config.
#┏━━━━━━━━━━━━━━━━━━━━━━━━━━━━━━━━━━━━━━━━━━━━━━━━━━━━━━━━━━━━━━━━━━━━━━━━━━━━━━━━━━━━━━━━━━━━━━━━━━━━━━━
#┃ 1. Configuration File
#┣┈┈┈┈┈┈┈┈┈┈┈┈┈┈┈┈┈┈┈┈┈┈┈┈┈┈┈┈┈┈┈┈┈┈┈┈┈┈┈┈┈┈┈┈┈┈┈┈┈┈┈┈┈┈┈┈┈┈┈┈┈┈┈┈┈┈┈┈┈┈┈┈┈┈┈┈┈┈┈┈┈┈┈┈┈┈┈┈┈┈┈┈┈┈┈┈┈┈┈┈┈┈┈
#┃ The configuration file for pg_exporter is a YAML file.
#┃ Default configuration are retrieved via following precedence:
#┃     1. command line args:            --config=<config path>
#┃     2. environment variables:        PG_EXPORTER_CONFIG=<config path>
#┃     3. pg_exporter.[yaml.yml]        (Current directory)
#┃     4. /etc/pg_exporter.[yaml|yml]   (etc config file)
#┃     5. /etc/pg_exporter              (etc config dir)
#┣━━━━━━━━━━━━━━━━━━━━━━━━━━━━━━━━━━━━━━━━━━━━━━━━━━━━━━━━━━━━━━━━━━━━━━━━━━━━━━━━━━━━━━━━━━━━━━━━━━━━━━━
#┃ 2. Config Format
#┣┈┈┈┈┈┈┈┈┈┈┈┈┈┈┈┈┈┈┈┈┈┈┈┈┈┈┈┈┈┈┈┈┈┈┈┈┈┈┈┈┈┈┈┈┈┈┈┈┈┈┈┈┈┈┈┈┈┈┈┈┈┈┈┈┈┈┈┈┈┈┈┈┈┈┈┈┈┈┈┈┈┈┈┈┈┈┈┈┈┈┈┈┈┈┈┈┈┈┈┈┈┈┈
#┃ pg_exporter config could be a single yaml file, or a directory contains a series of separated yaml files.
#┃ each yaml config file is consist of one or more metrics Collector definition. Which are top level objects
#┃ If a directory is provided, all yaml in that directory will be merge in alphabetic order.
#┃ Collector definition example are shown below.
#┣━━━━━━━━━━━━━━━━━━━━━━━━━━━━━━━━━━━━━━━━━━━━━━━━━━━━━━━━━━━━━━━━━━━━━━━━━━━━━━━━━━━━━━━━━━━━━━━━━━━━━━━
#┃ 3. Collector Example
#┣┈┈┈┈┈┈┈┈┈┈┈┈┈┈┈┈┈┈┈┈┈┈┈┈┈┈┈┈┈┈┈┈┈┈┈┈┈┈┈┈┈┈┈┈┈┈┈┈┈┈┈┈┈┈┈┈┈┈┈┈┈┈┈┈┈┈┈┈┈┈┈┈┈┈┈┈┈┈┈┈┈┈┈┈┈┈┈┈┈┈┈┈┈┈┈┈┈┈┈┈┈┈┈
#┃  # Here is an example of metrics collector definition
#┃  pg_primary_only:       <---- Collector branch name. Must be UNIQUE among entire configuration
#┃    name: pg             <---- Collector namespace, used as METRIC PREFIX, set to branch name by default, can be override
#┃                               Same namespace may contain multiple collector branch. It's user's responsibility
#┃                               to make sure that AT MOST ONE collector is picked for each namespace.
#┃
#┃    desc: PostgreSQL basic information (on primary)                 <---- Collector description
#┃    query: |                                                        <---- SQL string
#┃
#┃      SELECT extract(EPOCH FROM CURRENT_TIMESTAMP)                  AS timestamp,
#┃             pg_current_wal_lsn() - '0/0'                           AS lsn,
#┃             pg_current_wal_insert_lsn() - '0/0'                    AS insert_lsn,
#┃             pg_current_wal_lsn() - '0/0'                           AS write_lsn,
#┃             pg_current_wal_flush_lsn() - '0/0'                     AS flush_lsn,
#┃             extract(EPOCH FROM now() - pg_postmaster_start_time()) AS uptime,
#┃             extract(EPOCH FROM now() - pg_conf_load_time())        AS conf_reload_time,
#┃             pg_is_in_backup()                                      AS is_in_backup,
#┃             extract(EPOCH FROM now() - pg_backup_start_time())     AS backup_time;
#┃
#┃                                <---- [OPTIONAL] metadata fields, control collector behavior
#┃    ttl: 10                     <---- Cache TTL: in seconds, how long will pg_exporter cache this collector's query result.
#┃    timeout: 0.1                <---- Query Timeout: in seconds, query exceed this limit will be canceled.
#┃    min_version: 100000         <---- minimal supported version, boundary IS included. In server version number format,
#┃    max_version: 130000         <---- maximal supported version, boundary NOT included, In server version number format
#┃    fatal: false                <---- Collector marked `fatal` fails, the entire scrape will abort immediately and marked as fail
#┃    skip: false                 <---- Collector marked `skip` will not be installed during planning procedure
#┃
#┃    tags: [cluster, primary]    <---- tags is a list of string, which could be:
#┃                                        * 'cluster' marks this query as cluster level, so it will only execute once for same PostgreSQL Server
#┃                                        * 'primary' or 'master'  mark this query can only run on a primary instance (WILL NOT execute if pg_is_in_recovery())
#┃                                        * 'standby' or 'replica' mark this query can only run on a replica instance (WILL execute if pg_is_in_recovery())
#┃                                      some special tag prefix have special interpretation:
#┃                                        * 'dbname:<dbname>' means this query will ONLY be executed on database with name '<dbname>'
#┃                                        * 'username:<user>' means this query will only be executed when connect with user '<user>'
#┃                                        * 'extension:<extname>' means this query will only be executed when extension '<extname>' is installed
#┃                                        * 'schema:<nspname>' means this query will only by executed when schema '<nspname>' exist
#┃                                        * 'not:<negtag>' means this query WILL NOT be executed when exporter is tagged with '<negtag>'
#┃                                        * '<tag>' means this query WILL be executed when exporter is tagged with '<tag>'
#┃                                           ( <tag> could not be cluster,primary,standby,master,replica,etc...)
#┃
#┃
#┃    metrics:                    <---- List of returned columns, each column must have a `name` and `usage`, `rename` and `description` are optional
#┃      - timestamp:              <---- Column name, should be exactly same as returned column name
#┃          rename: ts            <---- Alias, optional, alias will be used instead of column name
#┃          usage: GAUGE          <---- Metric type, `usage` could be
#┃                                        * DISCARD: completely ignoring this field
#┃                                        * LABEL:   use columnName=columnValue as a label in metric
#┃                                        * GAUGE:   Mark column as a gauge metric, fullname will be '<query.name>_<column.name>'
#┃                                        * COUNTER: Same as above, except for it is a counter rather than gauge.
#┃
#┃          description: database current timestamp <----- Description of the column, will be used as metric description, optional
#┃
#┃      - lsn:
#┃          usage: COUNTER
#┃          description: log sequence number, current write location (on primary)
#┃      - insert_lsn:
#┃          usage: COUNTER
#┃          description: primary only, location of current wal inserting
#┃      - write_lsn:
#┃          usage: COUNTER
#┃          description: primary only, location of current wal writing
#┃      - flush_lsn:
#┃          usage: COUNTER
#┃          description: primary only, location of current wal syncing
#┃      - uptime:
#┃          usage: GAUGE
#┃          description: seconds since postmaster start
#┃      - conf_reload_time:
#┃          usage: GAUGE
#┃          description: seconds since last configuration reload
#┃      - is_in_backup:
#┃          usage: GAUGE
#┃          description: 1 if backup is in progress
#┃      - backup_time:
#┃          usage: GAUGE
#┃          description: seconds since current backup start. null if don't have one
#┃
#┃
#┣━━━━━━━━━━━━━━━━━━━━━━━━━━━━━━━━━━━━━━━━━━━━━━━━━━━━━━━━━━━━━━━━━━━━━━━━━━━━━━━━━━━━━━━━━━━━━━━━━━━━━━━
#┃ Collector Presets
#┣┈┈┈┈┈┈┈┈┈┈┈┈┈┈┈┈┈┈┈┈┈┈┈┈┈┈┈┈┈┈┈┈┈┈┈┈┈┈┈┈┈┈┈┈┈┈┈┈┈┈┈┈┈┈┈┈┈┈┈┈┈┈┈┈┈┈┈┈┈┈┈┈┈┈┈┈┈┈┈┈┈┈┈┈┈┈┈┈┈┈┈┈┈┈┈┈┈┈┈┈┈┈┈
#┃ pg_exporter is shipped with a series of preset collector (already numbered and ordered with file prefix)
#┃
#┃ 1xx  Common, basic information
#┃ 2xx  Replication metrics:  sender, receiver, downstream, sync standby, slots
#┃ 3xx  Persist metrics:      size, background writer, checkpoint, recovery, cache, shmem usage
#┃ 4xx  Activity metrics:     backend count group by state, wait event, locks, xacts, queries
#┃ 5xx  Maintenance metrics:  progress of vacuum, indexing, clustering, and basebackup
#┃ 6xx  Database metrics:     pg_database and pg_stat_database
#┃ 7xx  Object metrics:       pg_class, table, index, function, partition table
#┃ 8xx  Optional metrics:     optional metrics collector (usually slow)
#┃ 9xx  Pgbouncer metrics:    metrics from admin database `pgbouncer`
#┃
#┃ 100-599 Metrics for entire database cluster  (scrape once)
#┃ 600-899 Metrics for single database instance (scrape for each database)
#┃
#┣┈┈┈┈┈┈┈┈┈┈┈┈┈┈┈┈┈┈┈┈┈┈┈┈┈┈┈┈┈┈┈┈┈┈┈┈┈┈┈┈┈┈┈┈┈┈┈┈┈┈┈┈┈┈┈┈┈┈┈┈┈┈┈┈┈┈┈┈┈┈┈┈┈┈┈┈┈┈┈┈┈┈┈┈┈┈┈┈┈┈┈┈┈┈┈┈┈┈┈┈┈┈┈
#┃ Cache TTL
#┣┈┈┈┈┈┈┈┈┈┈┈┈┈┈┈┈┈┈┈┈┈┈┈┈┈┈┈┈┈┈┈┈┈┈┈┈┈┈┈┈┈┈┈┈┈┈┈┈┈┈┈┈┈┈┈┈┈┈┈┈┈┈┈┈┈┈┈┈┈┈┈┈┈┈┈┈┈┈┈┈┈┈┈┈┈┈┈┈┈┈┈┈┈┈┈┈┈┈┈┈┈┈┈
#┃ Cache can be used for reducing query overhead, it can be enabled by setting a non-zero value for `ttl`
#┃ It is highly recommended using cache to avoid duplicate scrapes. Especially when you got multiple prometheus
#┃ scraping same instance with slow monitoring queries. Setting `ttl` to zero or leaving blank will disable
#┃ result caching, which is default behavior
#┃
#┃ TTL has to be smaller than your scrape interval. 15s scrape interval and 10s TTL is a good start for
#┃ production environment. Some expensive monitoring query (such as table bloat check) will have longer `ttl`
#┃ which can also be used as a mechanism to achieve 'different scrape frequency'
#┣┈┈┈┈┈┈┈┈┈┈┈┈┈┈┈┈┈┈┈┈┈┈┈┈┈┈┈┈┈┈┈┈┈┈┈┈┈┈┈┈┈┈┈┈┈┈┈┈┈┈┈┈┈┈┈┈┈┈┈┈┈┈┈┈┈┈┈┈┈┈┈┈┈┈┈┈┈┈┈┈┈┈┈┈┈┈┈┈┈┈┈┈┈┈┈┈┈┈┈┈┈┈┈
#┃ Query Timeout
#┣┈┈┈┈┈┈┈┈┈┈┈┈┈┈┈┈┈┈┈┈┈┈┈┈┈┈┈┈┈┈┈┈┈┈┈┈┈┈┈┈┈┈┈┈┈┈┈┈┈┈┈┈┈┈┈┈┈┈┈┈┈┈┈┈┈┈┈┈┈┈┈┈┈┈┈┈┈┈┈┈┈┈┈┈┈┈┈┈┈┈┈┈┈┈┈┈┈┈┈┈┈┈┈
#┃ Collectors can be configured with a optional Timeout. If collector's query executing more that that
#┃ timeout, it will be canceled immediately. Setting `timeout` to 0 or leaving blank will reset it to
#┃ default timeout 0.1 (100ms). Setting it to any negative number will disable query timeout feature.
#┃ All query have a default timeout 100ms, if exceed, the query will be canceled immediately to avoid
#┃ avalanche. You can explict overwrite that option. but be ware: in some extreme case, if all your
#┃ timeout sum up greater your scrape/cache interval (usually 15s) , the query may still be jammed.
#┃ or , you can just disable potential slow queries with --tag=bulky
#┣┈┈┈┈┈┈┈┈┈┈┈┈┈┈┈┈┈┈┈┈┈┈┈┈┈┈┈┈┈┈┈┈┈┈┈┈┈┈┈┈┈┈┈┈┈┈┈┈┈┈┈┈┈┈┈┈┈┈┈┈┈┈┈┈┈┈┈┈┈┈┈┈┈┈┈┈┈┈┈┈┈┈┈┈┈┈┈┈┈┈┈┈┈┈┈┈┈┈┈┈┈┈┈
#┃ Version Compatibility
#┣┈┈┈┈┈┈┈┈┈┈┈┈┈┈┈┈┈┈┈┈┈┈┈┈┈┈┈┈┈┈┈┈┈┈┈┈┈┈┈┈┈┈┈┈┈┈┈┈┈┈┈┈┈┈┈┈┈┈┈┈┈┈┈┈┈┈┈┈┈┈┈┈┈┈┈┈┈┈┈┈┈┈┈┈┈┈┈┈┈┈┈┈┈┈┈┈┈┈┈┈┈┈┈
#┃ Each collector have two optional version compatibility parameters: `min_version` and `max_version`.
#┃ These two parameters specify version compatibility of the collector. If target postgres/pgbouncer
#┃ version is less than `min_version`, or higher than `max_version`, the collector will not be installed.
#┃ These two parameters are using PostgreSQL server version number format, will is a 6-digit integer
#┃ format as <major:2 digit><minor:2 digit>:<release: 2 digit>.
#┃ For example, 090600 stands for 9.6 and 120100 stands for 12.1
#┃ And beware that version compatibility range is left-inclusive right exclusive: [min,max), set to zero or
#┃ leaving blank will effect as -inf or +inf
#┣┈┈┈┈┈┈┈┈┈┈┈┈┈┈┈┈┈┈┈┈┈┈┈┈┈┈┈┈┈┈┈┈┈┈┈┈┈┈┈┈┈┈┈┈┈┈┈┈┈┈┈┈┈┈┈┈┈┈┈┈┈┈┈┈┈┈┈┈┈┈┈┈┈┈┈┈┈┈┈┈┈┈┈┈┈┈┈┈┈┈┈┈┈┈┈┈┈┈┈┈┈┈┈
#┃ Fatality
#┣┈┈┈┈┈┈┈┈┈┈┈┈┈┈┈┈┈┈┈┈┈┈┈┈┈┈┈┈┈┈┈┈┈┈┈┈┈┈┈┈┈┈┈┈┈┈┈┈┈┈┈┈┈┈┈┈┈┈┈┈┈┈┈┈┈┈┈┈┈┈┈┈┈┈┈┈┈┈┈┈┈┈┈┈┈┈┈┈┈┈┈┈┈┈┈┈┈┈┈┈┈┈┈
#┃ If collector marked with `fatal` fails, entire scrape operation will be marked as fail, and key metrics
#┃ `pg_up` / `pgbouncer_up` will be reset to 0. It always a good practice to setup AT LEAST ONE fatal
#┃ collector for pg_exporter. `pg.pg_primary_only` and `pgbouncer_list` are the default fatal collector.
#┃
#┃ If collector without `fatal` flag fails, it will increase global fail counters. But the scrape operation
#┃ will carry on. The entire scrape result will not be marked as fail, thus will not affect `<xx>_up` metric.
#┣┈┈┈┈┈┈┈┈┈┈┈┈┈┈┈┈┈┈┈┈┈┈┈┈┈┈┈┈┈┈┈┈┈┈┈┈┈┈┈┈┈┈┈┈┈┈┈┈┈┈┈┈┈┈┈┈┈┈┈┈┈┈┈┈┈┈┈┈┈┈┈┈┈┈┈┈┈┈┈┈┈┈┈┈┈┈┈┈┈┈┈┈┈┈┈┈┈┈┈┈┈┈┈
#┃ Skip
#┣┈┈┈┈┈┈┈┈┈┈┈┈┈┈┈┈┈┈┈┈┈┈┈┈┈┈┈┈┈┈┈┈┈┈┈┈┈┈┈┈┈┈┈┈┈┈┈┈┈┈┈┈┈┈┈┈┈┈┈┈┈┈┈┈┈┈┈┈┈┈┈┈┈┈┈┈┈┈┈┈┈┈┈┈┈┈┈┈┈┈┈┈┈┈┈┈┈┈┈┈┈┈┈
#┃ Collector with `skip` flag set to true will NOT be installed.
#┣┈┈┈┈┈┈┈┈┈┈┈┈┈┈┈┈┈┈┈┈┈┈┈┈┈┈┈┈┈┈┈┈┈┈┈┈┈┈┈┈┈┈┈┈┈┈┈┈┈┈┈┈┈┈┈┈┈┈┈┈┈┈┈┈┈┈┈┈┈┈┈┈┈┈┈┈┈┈┈┈┈┈┈┈┈┈┈┈┈┈┈┈┈┈┈┈┈┈┈┈┈┈┈
#┃ Tags and Planning
#┣┈┈┈┈┈┈┈┈┈┈┈┈┈┈┈┈┈┈┈┈┈┈┈┈┈┈┈┈┈┈┈┈┈┈┈┈┈┈┈┈┈┈┈┈┈┈┈┈┈┈┈┈┈┈┈┈┈┈┈┈┈┈┈┈┈┈┈┈┈┈┈┈┈┈┈┈┈┈┈┈┈┈┈┈┈┈┈┈┈┈┈┈┈┈┈┈┈┈┈┈┈┈┈
#┃ Tags are designed for collector planning. It can be handy to customize which queries runs on which
#┃ instances. And enables you using same configuration file everywhere
#┃
#┃  Tags are list of string, each string could be:
#┃  Pre-defined special tags
#┃    * 'cluster' marks this collector as cluster level, so it will ONLY BE EXECUTED ONCE for same PostgreSQL Server
#┃    * 'primary' or 'master' mark this collector as primary-only, so it WILL NOT work iff pg_is_in_recovery()
#┃    * 'standby' or 'replica' mark this collector as replica-only, so it WILL work iff pg_is_in_recovery()
#┃  Special tag prefix which have different interpretation:
#┃    * 'dbname:<dbname>' means this collector will ONLY work on database with name '<dbname>'
#┃    * 'username:<user>' means this collector will ONLY work when connect with user '<user>'
#┃    * 'extension:<extname>' means this collector will ONLY work when extension '<extname>' is installed
#┃    * 'schema:<nspname>' means this collector will only work when schema '<nspname>' exists
#┃  Customized positive tags (filter) and negative tags (taint)
#┃    * 'not:<negtag>' means this collector WILL NOT work when exporter is tagged with '<negtag>'
#┃    * '<tag>' means this query WILL work if exporter is tagged with '<tag>' (special tags not included)
#┃
#┃  pg_exporter will trigger Planning procedure after connecting to target. It will gather database facts
#┃  and match them with tags and other metadata (such as supported version range). Collector will only
#┃  be installed if and only if it is compatible with target server.
#┗━━━━━━━━━━━━━━━━━━━━━━━━━━━━━━━━━━━━━━━━━━━━━━━━━━━━━━━━━━━━━━━━━━━━━━━━━━━━━━━━━━━━━━━━━━━━━━━━━━━━━━━
You could visualize these metrics via fancy grafana dashboards. There are lot's of dashboards available based pg_exporter, Check pigsty for detail.
Author:Vonng (fengruohang@outlook.com)
License: Apache Apache License Version 2.0


