Simple command line pomodoro app with visualization of statistics. The Pomodoro technique is a time management technique for improving productivity.
Check (https://en.wikipedia.org/wiki/Pomodoro_Technique) for more details.
The code is based on:
git clone https://github.com/dportalesr/pomodoro
cd pomodoro
pip install -r requirements.txt
python3 setup.py install
After installation, it's safe to remove the repo completely.
pomodoro [work-minutes] [rest-minutes] --grace=[grace-time-seconds] --repeat=[repeat]Default values:
- Work time: 26 min
- Rest time: 6 min
- Grace time before switching between work and rest: 20 seconds
- Repeat: 6 times
A Growl notification will be triggered at the end of pomodoros.
each time a pomodoro is performed, its recorded on a small text database in your HOME/.pomodoro. To visualize the statistics of your pomodoros, you can use pomostat. Here are some examples:
pomostat overall
pomostat week
pomostat thisweek
pomostat lastweek
pomostat week --weekof='2018-01-01'
pomostat stats
pomostat weeks
pomostat today
pomostat yesterday
Check pomostat --help for more information.
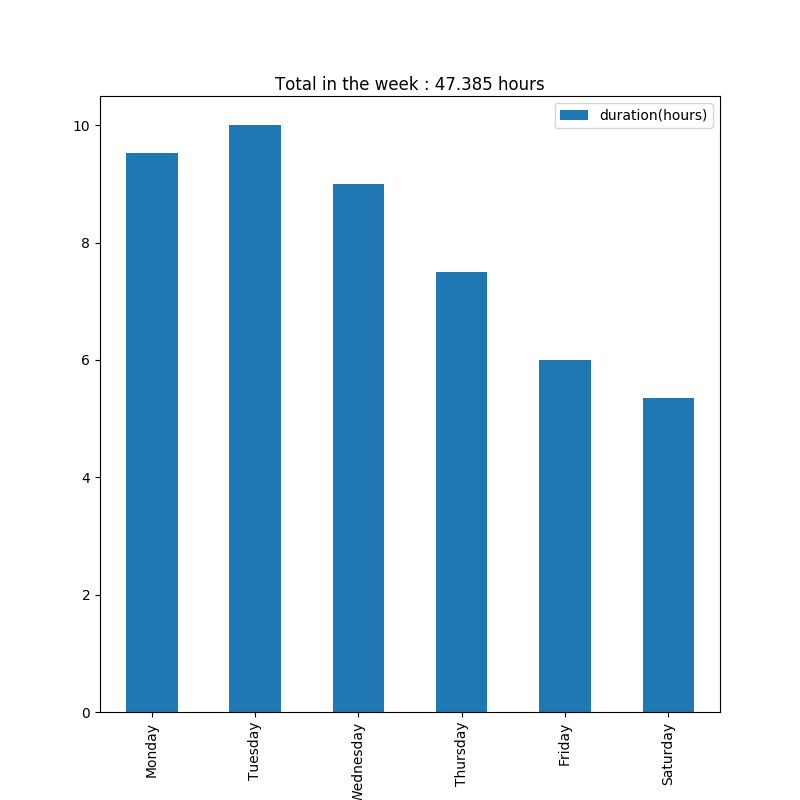
Here is an example of graph with pomostat thisweek: