Talk: Tracing Kafka-based applications with Zipkin
Demo material from talk about tracing Kafka-based applications with Zipkin
Labs
- Hello world distributed tracing: Understand basics about distributed tracing.
- Tracing Kafka-based apps: Instrumenting Kafka-based applications with Zipkin.
Spigodemo: How to experiment with Zipkin and models built on top of Tracing data.
Pre-requisites
- jdk-8+
- docker-engine, docker-compose
Build applications and starts Docker compose environment:
make
Lab 1: Hello world distributed tracing
This lab will introduce initial concepts about distributed tracing like Span, Trace and Context Propagation.
Initial Scenario: Hello World Services
There is a service called Hello World that is capable of say hi in different languages, by using a Hello Translation service, and return a response to a user.
+--------+   +---------------+   +--------------------+
| Client |-->| Hello Service |-->| Transation Service |
+--------+   +---------------+   +--------------------+
An HTTP Client will call the Hello Service expecting a greeting. The execution of
this operation will be traced, and the trace created by this execution is called a
span. The Hello Service then will call then the Translation Service, to translate
the "Hello" word according to the request.
As the Translation Service is also instrumented to trace the execution of its operations
exposed via HTTP, then the execution of translation operation will create another
span.
For the translation span to be aware that is part of a bigger trace, it should receive
some references of the parent trace. This will come as part of the HTTP Request.
As the HTTP Client call from Hello Service is instrumented with tracing, it will "inject"
the tracing context on the HTTP Headers.
The Translation Service, by receiving the trace context as part of the headers, will create
its spans with reference to that context.
The instrumentation libraries will send the spans created to a tracing system, Zipkin in this case, for it to recreate the complete trace from distributed spans.
How to run it
- Start
hello-servicein one terminal:
make hello-service
The service by itself is not enough to produce a successful -it requires the translation service. To know that is working successfully: you have to participate in a transaction (e.g. make a request), be watching the logs, or produce some evidence from instrumentation.
If you instrument your service for tracing correctly you will have evidence of each operation.
- Make a call (that will produce an error):
$ curl localhost:18000/hello/service
{"code":500,"message":"There was an error processing your request. It has been logged (ID f0cbd609d1b40741)."}
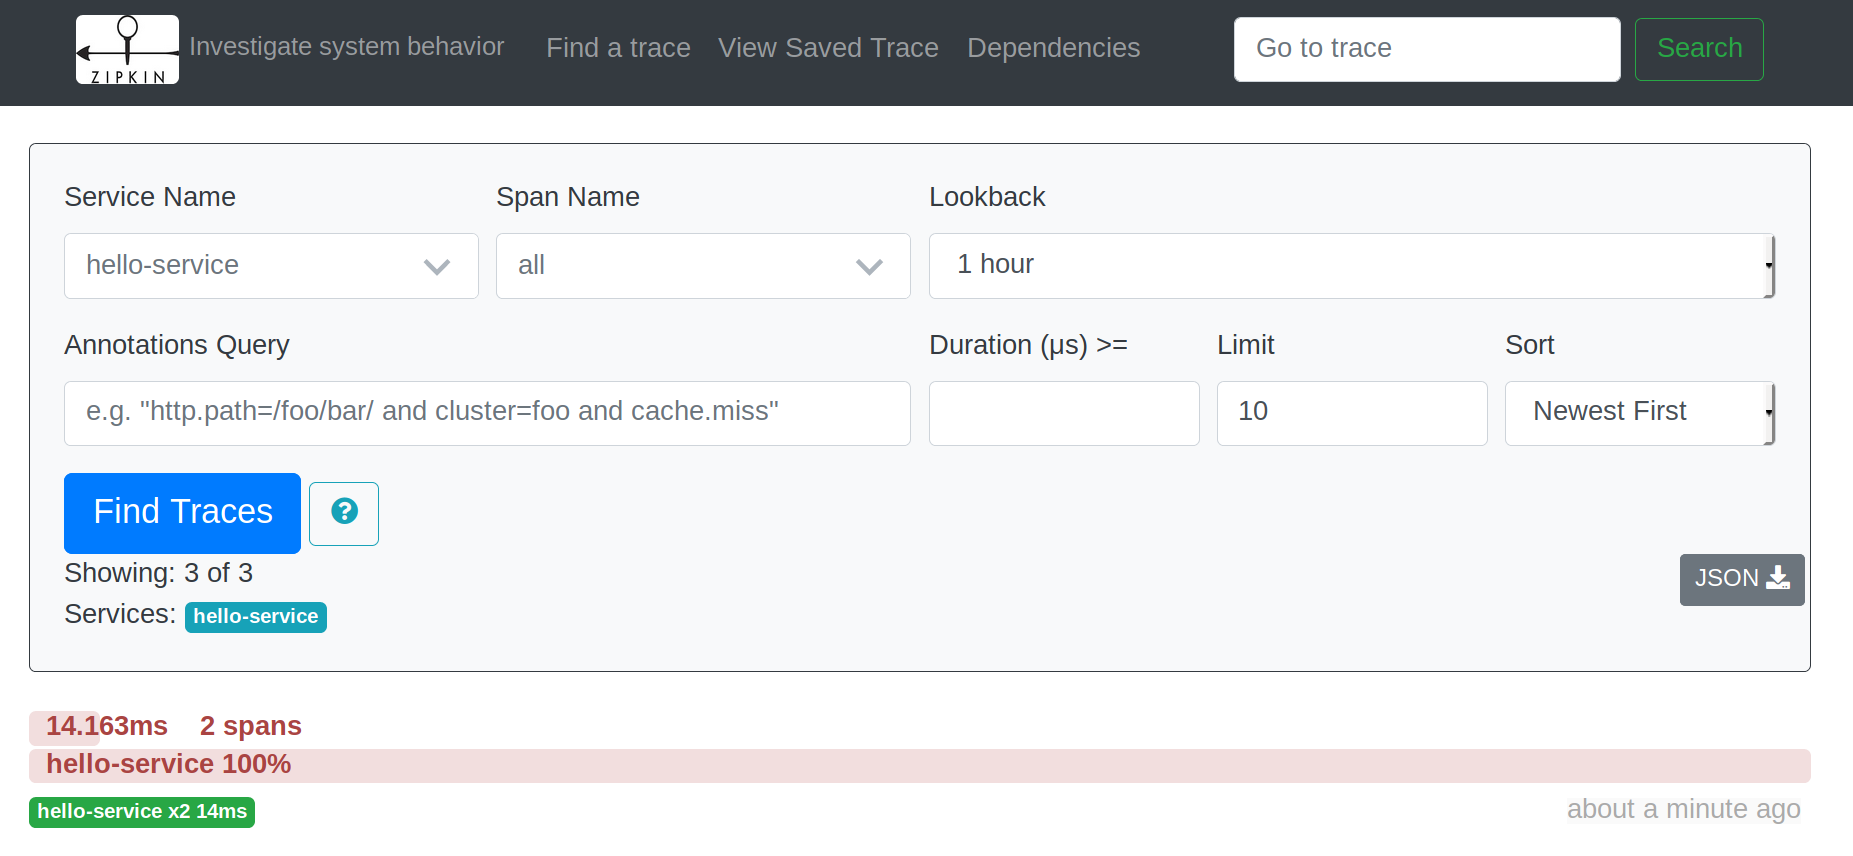
- Go to Zipkin to check the traces http://localhost:9411/:
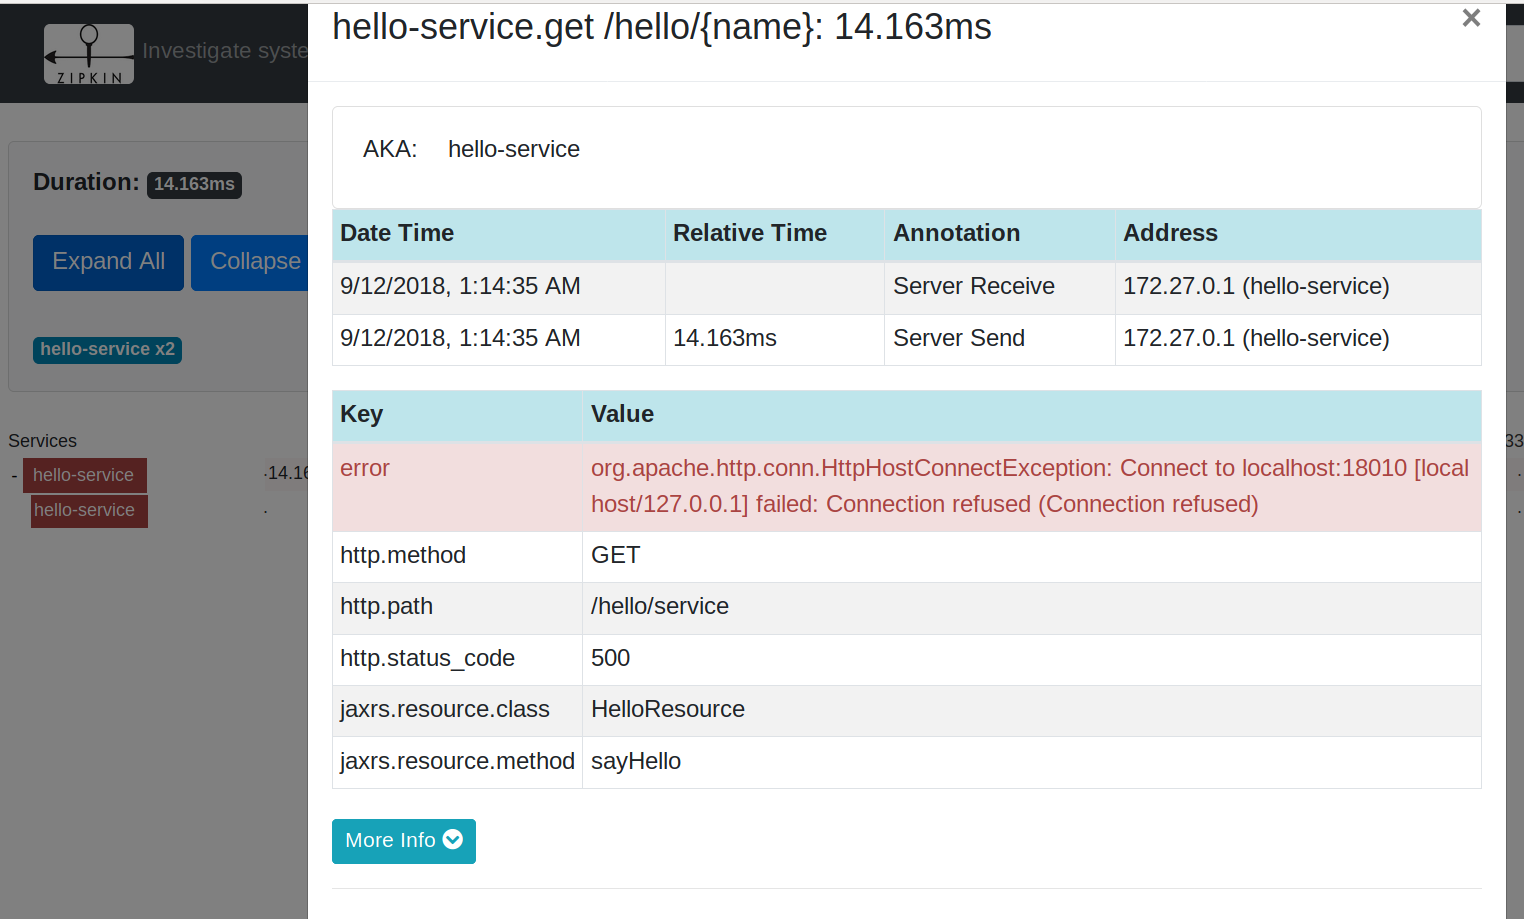
And check the details:
We have 2 spans: One created by the service operation exposed via HTTP interface, that
is the root span as is the first one of a trace. And there is a second child span
that is created by the HTTP Client operation attempting to call the Translation Service.
As this call has failed, the error is recorded as part of the trace and the trace is
marked as an error trace (i.e. red trace)
A trace can be tagged with related metadata that can facilitate the discovery of traces:
In this case, HTTP Method, HTTP Response Status are added to this trace.
- If we start the translation service, run in another terminal:
make hello-translation
- Now, try to call the
hello-servicevia curl:
$ curl localhost:18000/hello/service
{"hello":"Hello, service","lang":"en"}
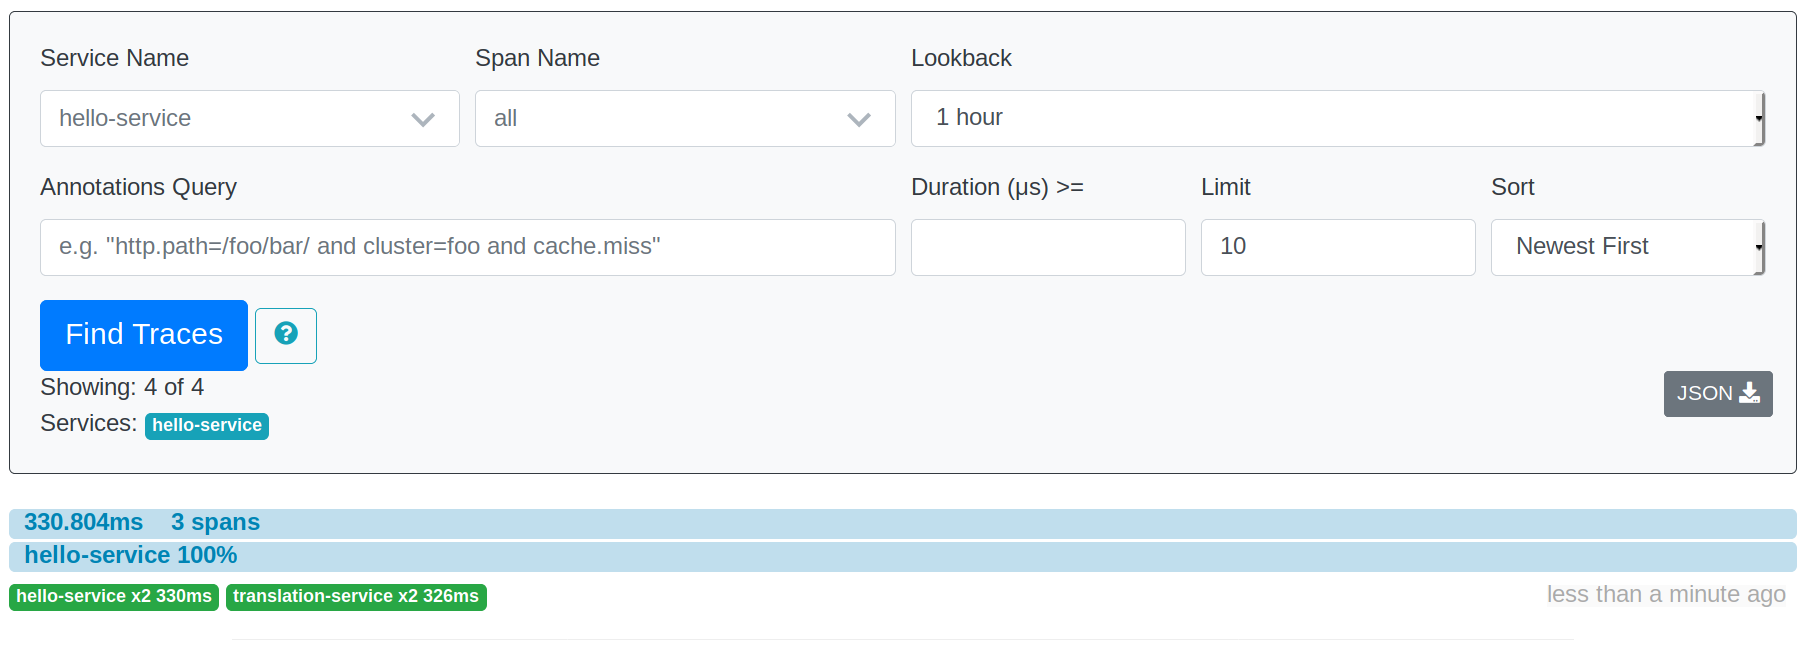
- Check that a new trace is recorded, and it has 2 services collaborating:
And in the trace details, you will see 3 spans, 1 from hello-service and 2
from translation-service:
The first 2 spans are created by the instrumentation for HTTP Client and HTTP Server:
But the last one is created by using brave library (Zipkin instrumentation library for
Java) directly on your code:
TranslationResource.java:
  @GET
  @Path("{lang}")
  @Produces(MediaType.TEXT_PLAIN)
  public Response translateHello(@PathParam("lang") final String lang) {
    /* START CUSTOM INSTRUMENTATION */
    final ScopedSpan span = tracer.startScopedSpan("query-repository");
    span.annotate("started-query");
    span.tag("lang", Optional.ofNullable(lang).orElse(""));
    final String hello = repository.find(lang);
    span.annotate("finished-query");
    span.finish();
    /* END CUSTOM INSTRUMENTATION */
    return Response.ok(hello).build();
  }
By using existing libraries instrumentation you will get most of the picture on how
your service collaborate, but when you need to get details about an specific task part
of your code, then you can add "custom" spans, so your debugging is more specific.
Scenario 02: Hello World Events
Instead of a web client, a Client application with implement a batch process to call Hello Service and produce events into a Kafka Topic.
+--------+   +---------------+   +------------------+
|        |-->| Hello Service |-->| Hello Transation |
|        |   +---------------+   +------------------+
| Hello* |
| Client |   +--------+   +-----------------+
|        |-->| Kafka* |-->| Hello Consumer* |
+--------+   +--------+   +-----------------+
(*) new components
This scenario represents how to propagate context when you are not communicating services directly by via messaging. In this case, we will use Kafka as an intermediate component to publish events.
How to run it
- Start the
hello-client:
make hello-client
This will run the batch process to call hello-service 6 times in sequence.
It will take around 15 secs. to execute.
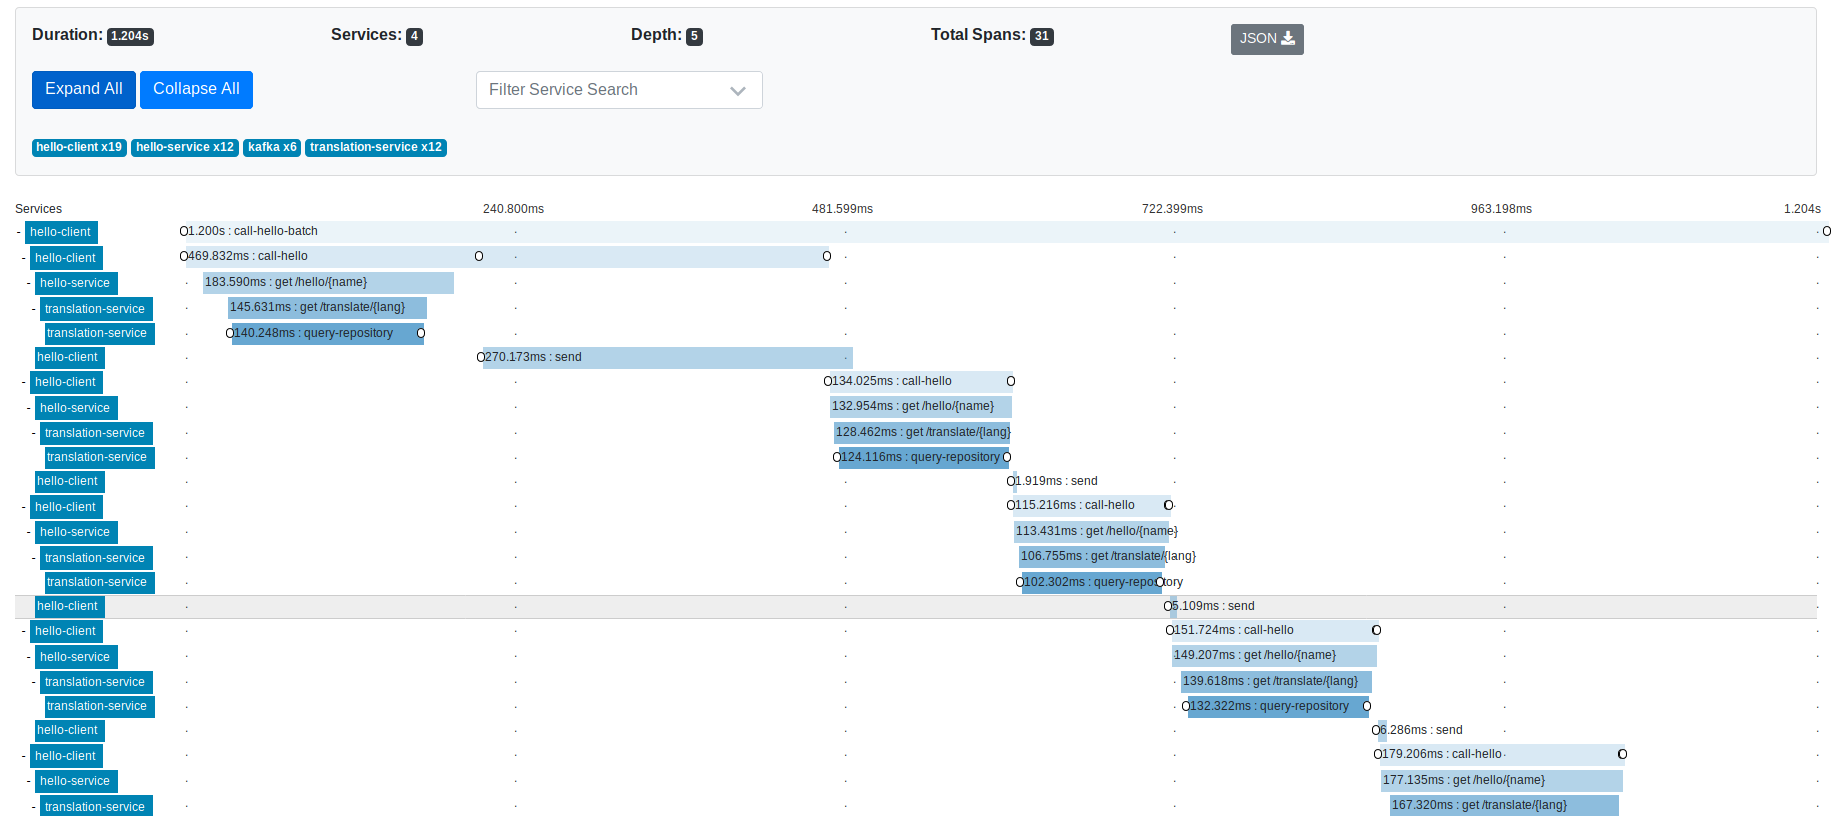
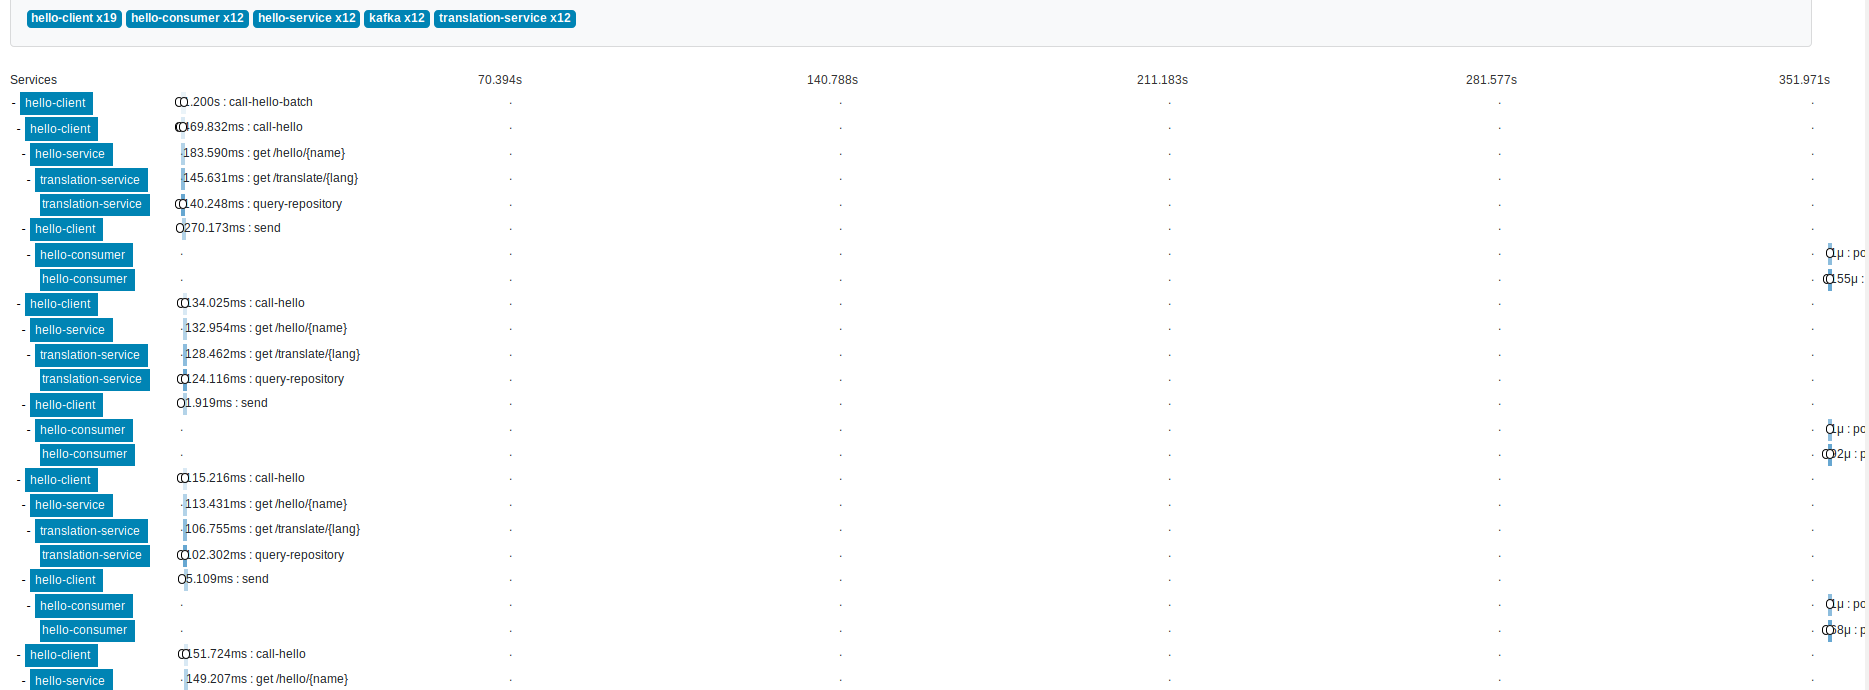
As this component is starting the trace, then hello-service and hello-translation
spans will become children of this parent span:
The messaging broker is defined as an external library here, as part of the kafka-clients
instrumentation, so we can have it as part of the picture.
Interesting finding: first send operation by
kafka-clientProducer, is slower than the others.
- Now, let's start the consumer to see how its executions will become part of the trace:
make hello-consumer
Benefit: Now we have evidence about how much time is taking for data to get downstream. For instance, is the goal of adopting Kafka is to reduce latency on your data pipelines, here is the evidence of how much latency you are saving, or not.
In the case of Kafka Producers and Consumers, the instrumentation provided by Brave is injecting the trace context on the Kafka Headers, so the consumers spans can reference to the parent span.
Lab 02: Twitter Kafka-based application
Kafka Platform provides different APIs to implement streaming applications. We have seen in the Lab 01 that Brave offers instrumentation for Kafka Client library. In this Lab, we will evaluate how to instrument the other APIs: Streams API and Connect API.
To do this, we will introduce a use-case:
We have applications developed around Tweets. First of all, we need to pull tweets from Twitter. Once we have Tweets available in our system, we need to parse them into our preferred format, to then be consumed by many applications.
For this use-case we will use a Twitter Source Connector to pull tweets into Kafka. We will implement a Kafka Streams application to transform from JSON to Avro format. On the other side of Kafka, a JDBC Source Connector will send records to PostgreSQL, and another consumer will print records to console.
Data-flow view:
+---------+   +-------------------+          +------------------+    +--------------+
| Twitter |-->| Twitter Connector |-(Kafka)->| Stream Transform |-+->| DB Connector |
+---------+   +-------------------+          +------------------+ |  +--------------+
                                                               (kafka)
                                                                  |  +--------------+
                                                                  +->| Consumer App |
                                                                     +--------------+
Choreography view:
                  Kafka
               +----------+
+---------+    |          |    +------------------+
| Twitter |--->|          |--->|                  |
+---------+    |          |    | Stream Transform |
               |          |<---|                  |
               |          |    +------------------+
               |          |
               |          |    +--------------+    +------------+
               |          |--->| DB Connector |--->| Postgresql |
               |          |    +--------------+    +------------+
               |          |
               |          |    +--------------+    +---------+
               |          |--->| Consumer App |--->| Console |
               |          |    +--------------+    +---------+
               +----------+
Instrumentation
For Kafka Clients and Kafka Streams, as you implement the code, there are existing libraries to instrument them:
- Kafka Clients (Producer/Consumer): https://github.com/openzipkin/brave/tree/master/instrumentation/kafka-clients
- Kafka Streams (WIP): https://github.com/openzipkin/brave/tree/master/instrumentation/kafka-streams
For the case of Kafka Connectors, implementation is already done, but Kafka offers an interface to inject some code before it produce records to Kafka, and before a record is consumed by consumers, called Kafka Interceptors.
At Sysco we have developed an initial version of interceptors for Zipkin that reuse some of the logic of Kafka Instrumentation.
- Kafka Interceptors for Kafka Connect, REST Proxy, etc (WIP): https://github.com/sysco-middleware/kafka-interceptors/tree/master/zipkin
These interceptors have to be added to the classpath where connectors are running, and the pass them via configuration:
      CONNECT_PRODUCER_INTERCEPTOR_CLASSES: 'no.sysco.middleware.kafka.interceptor.zipkin.TracingProducerInterceptor'
      CONNECT_CONSUMER_INTERCEPTOR_CLASSES: 'no.sysco.middleware.kafka.interceptor.zipkin.TracingConsumerInterceptor'
How to run it
-
Configure a Twitter applications here and set secrets here:
twitter-tweets-source-connector/twitter-source.json -
Deploy the Twitter Source Connector:
make twitter-source
This will start pulling tweets, based on the configuration from twitter-tweets-source-connector/twitter-source.json.
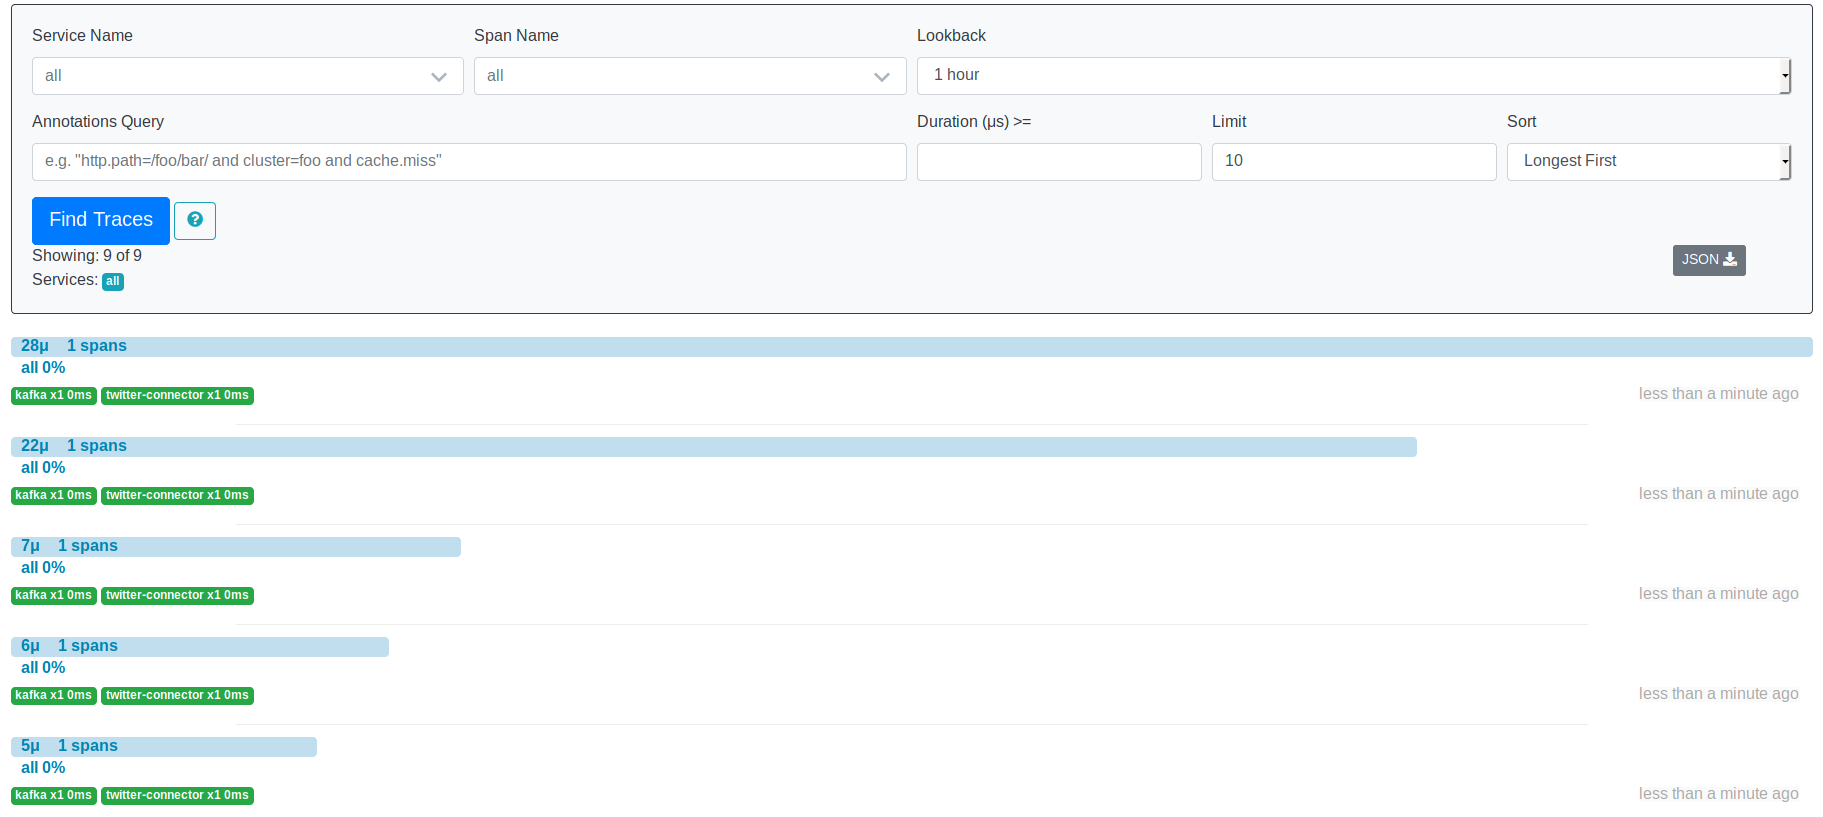
You can go to Zipkin, as connector is instrumented, to validate that is running:
Each span will represent each tweet that has been received by connector and sent to Kafka.
It is just including the on_send method execution, that is not significant, but
it brings Kafka Connectors into the distributed trace picture.
- Start the Stream Processing applications:
make twitter-stream
As you deploy Kafka-based applications, as they are instrumented, they will be added to the traces:
Here the stream processor is part of the picture.
- Let's now deploy the JDBC Sink Connector and the Console application:
make twitter-jdbc
make twitter-console
Now we have all distributed components collaboration, part of a Kafka data pipeline, evidenced as part of a trace:
Benefit: we can see which is the part of the data pipelines that I can start tuning/refactoring.
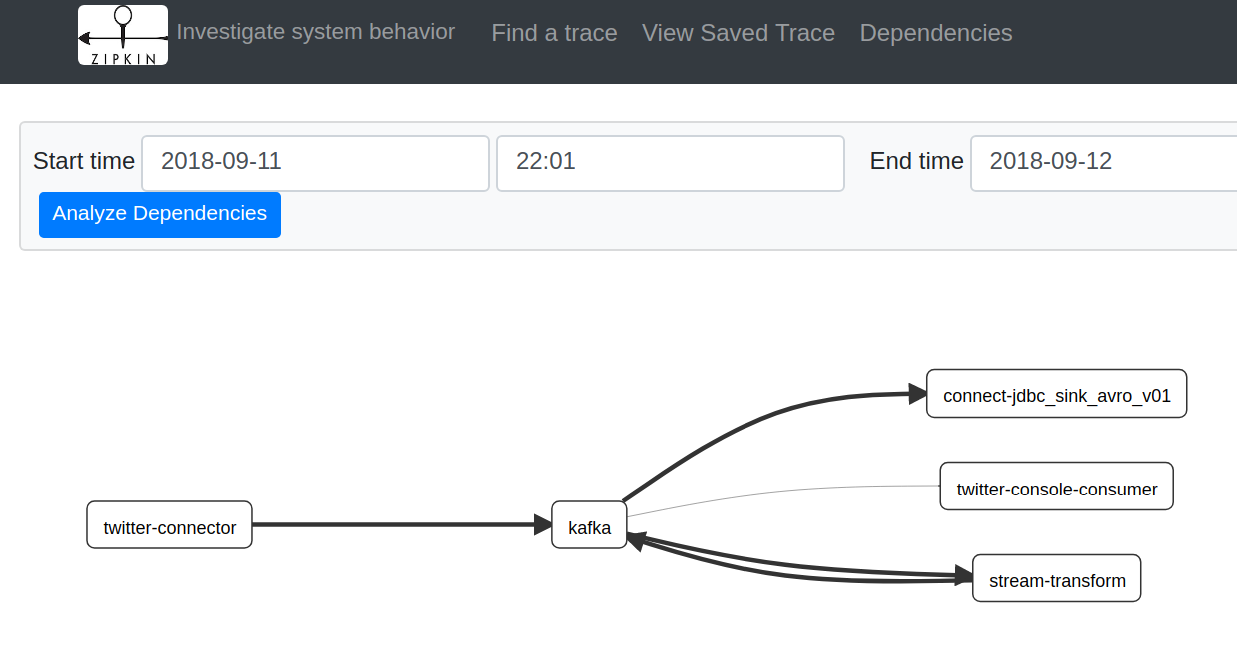
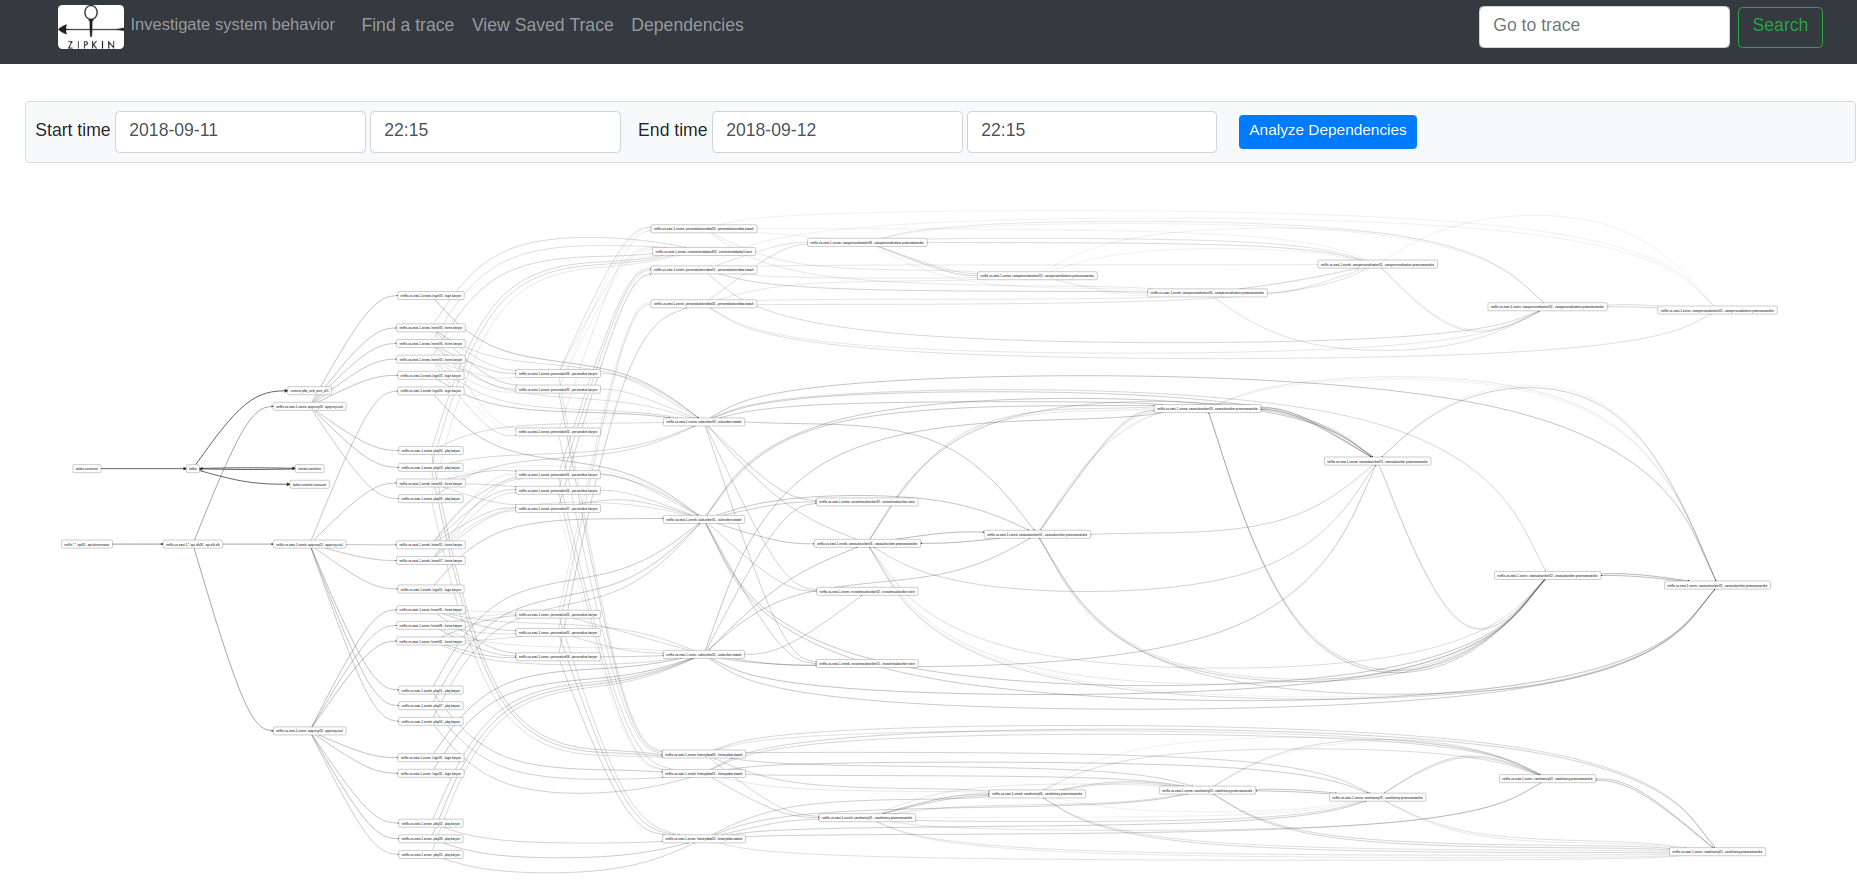
After recording traces from distributed components, you are storing real behaviour from your systems. Now you have the opportunity of creating models on top of tracing data. One example is the service dependency model that comes out of the box from Zipkin:
Lab 3: Spigo Simulation
This lab is prepared to give some hints on how to getting started with tracing by experimenting and simulating architecture models.
@adrianco has developed a tool call SPIGO that is able to model an architecture as a JSON file, where all components and dependencies are described. Then you can visualize and run this model. Finally you can export the traces from the simulation to Zipkin and Vizceral.
How to run it
3 submodules are cloned for this demo:
- spigo
- go-vizceral
- vizceral-example
- Describing and visualizing architecture
Spigo defines an architecture in JSON format, so you can use it later for visualization and simulation.
For instance a simple case is the LAMP (Linux, Apache, MySQL and PHP) architecture
(spigo/json_arch/lamp_arch.json):
{
    "arch": "lamp",
    "description":"Simple LAMP stack",
    "version": "arch-0.0",
    "victim": "",
    "services": [
        { "name": "rds-mysql",     "package": "store",       "count": 2,  "regions": 1, "dependencies": [] },
        { "name": "memcache",      "package": "store",       "count": 1,  "regions": 1, "dependencies": [] },
        { "name": "webserver",     "package": "monolith",    "count": 18, "regions": 1, "dependencies": ["memcache", "rds-mysql"] },
        { "name": "webserver-elb", "package": "elb",         "count": 0,  "regions": 1, "dependencies": ["webserver"] },
        { "name": "www",           "package": "denominator", "count": 0,  "regions": 0, "dependencies": ["webserver-elb"] }
    ]
}
And a more complex architecture would be Netflix one:
{
    "arch": "netflix",
    "description":"A simplified Netflix service. See http://netflix.github.io/ to decode the package names",
    "version": "arch-0.0",
    "victim": "homepage",
    "services": [
        { "name": "cassSubscriber",     "package": "priamCassandra", "count": 6, "regions": 1, "dependencies": ["cassSubscriber", "eureka"]},
        { "name": "evcacheSubscriber",  "package": "store",          "count": 3, "regions": 1, "dependencies": []},
        { "name": "subscriber",         "package": "staash",         "count": 3, "regions": 1, "dependencies": ["cassSubscriber","evcacheSubscriber"]},
        { "name": "cassPersonalization","package": "priamCassandra", "count": 6, "regions": 1, "dependencies": ["cassPersonalization", "eureka"]},
        { "name": "personalizationData","package": "staash",         "count": 3, "regions": 1, "dependencies": ["cassPersonalization"]},
        { "name": "cassHistory",        "package": "priamCassandra", "count": 6, "regions": 1, "dependencies": ["cassHistory", "eureka"]},
        { "name": "historyData",        "package": "staash",         "count": 3, "regions": 1, "dependencies": ["cassHistory"]},
        { "name": "contentMetadataS3",  "package": "store",          "count": 1, "regions": 1, "dependencies": []},
        { "name": "personalize",        "package": "karyon",         "count": 9, "regions": 1, "dependencies": ["contentMetadataS3", "subscriber", "historyData", "personalizationData"]},
        { "name": "login",              "package": "karyon",         "count": 6, "regions": 1, "dependencies": ["subscriber"]},
        { "name": "home",               "package": "karyon",         "count": 9, "regions": 1, "dependencies": ["contentMetadataS3", "subscriber", "personalize"]},
        { "name": "play",               "package": "karyon",         "count": 9, "regions": 1, "dependencies": ["contentMetadataS3", "historyData", "subscriber"]},
        { "name": "loginpage",          "package": "karyon",         "count": 6, "regions": 1, "dependencies": ["login"]},
        { "name": "homepage",           "package": "karyon",         "count": 9, "regions": 1, "dependencies": ["home"]},
        { "name": "playpage",           "package": "karyon",         "count": 9, "regions": 1, "dependencies": ["play"]},
        { "name": "wwwproxy",           "package": "zuul",           "count": 3, "regions": 1, "dependencies": ["loginpage", "homepage", "playpage"]},
        { "name": "apiproxy",           "package": "zuul",           "count": 3, "regions": 1, "dependencies": ["login", "home", "play"]},
        { "name": "www-elb",            "package": "elb",            "count": 0, "regions": 1, "dependencies": ["wwwproxy"]},
        { "name": "api-elb",            "package": "elb",            "count": 0, "regions": 1, "dependencies": ["apiproxy"]},
        { "name": "www",                "package": "denominator",    "count": 0, "regions": 0, "dependencies": ["www-elb"]},
        { "name": "api",                "package": "denominator",    "count": 0, "regions": 0, "dependencies": ["api-elb"]}
    ]
}
Package terms (e.g. denominator, zuul, karyon) emulate Netflix component names.
To visualize the architecture, open a new terminal and run:
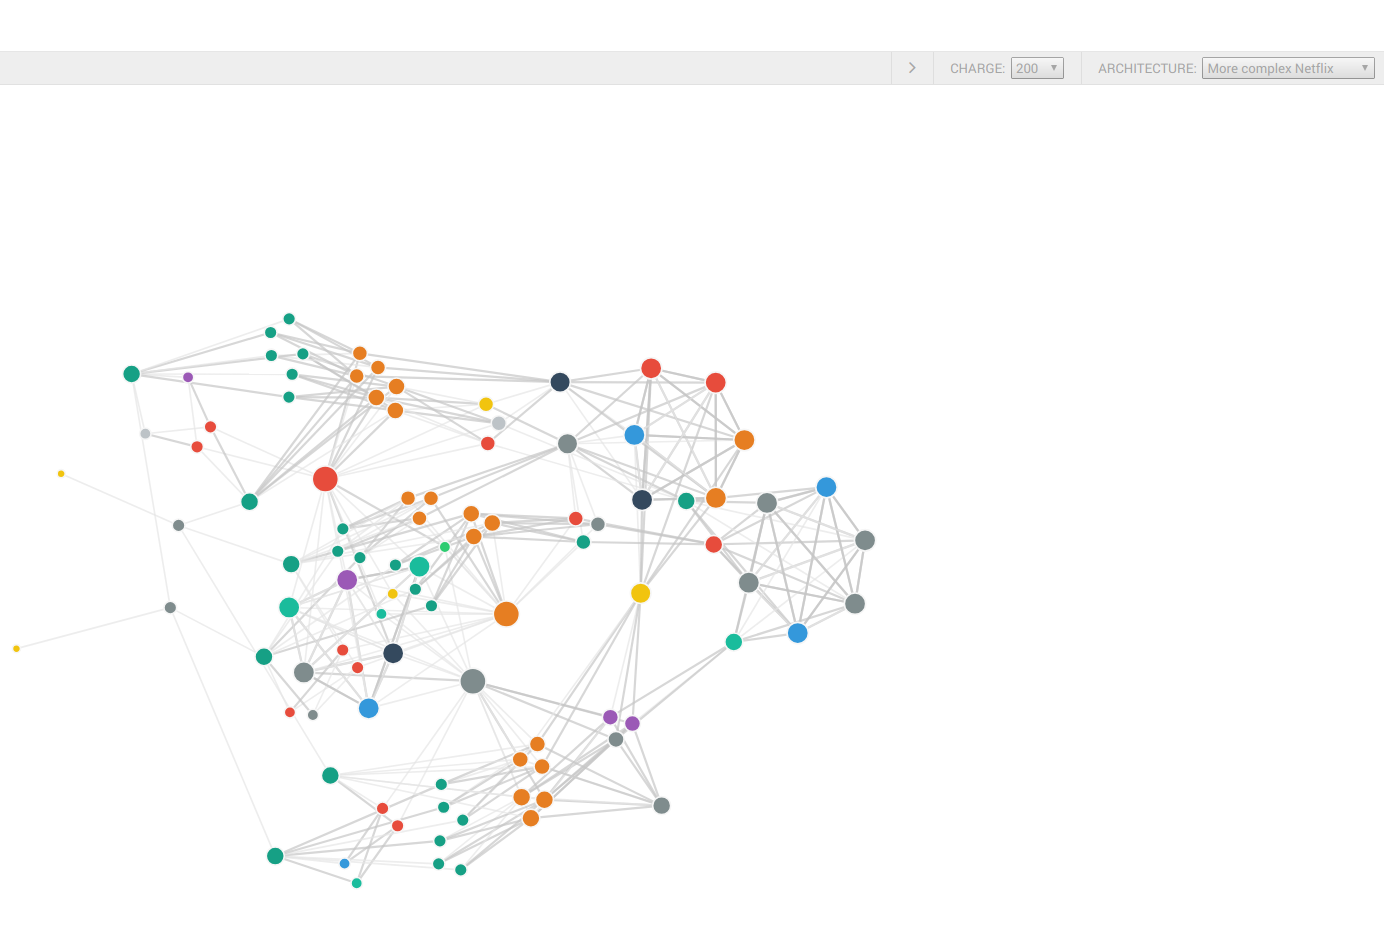
make spigo-ui
This will start a web application on http://localhost:8000 where you can visualize your architecture from above:
- Simulate your architecture
Once your architecture is defined, you can execute a simulation of requests from denominator component.
This simulation will run on your machine creating Goroutines and channels communication
between them to emulate comunication between distributed components.
Run Spigo to generate traces:
cd spigo/
spigo -c -d 5 -a netflix
- Export traces to Zipkin:
This execution will record Zipkin traces on json_metrics/netflix_flow.json file.
To export it to Zipkin, run:
cd spigo/
misc/zipkin.sh netflix
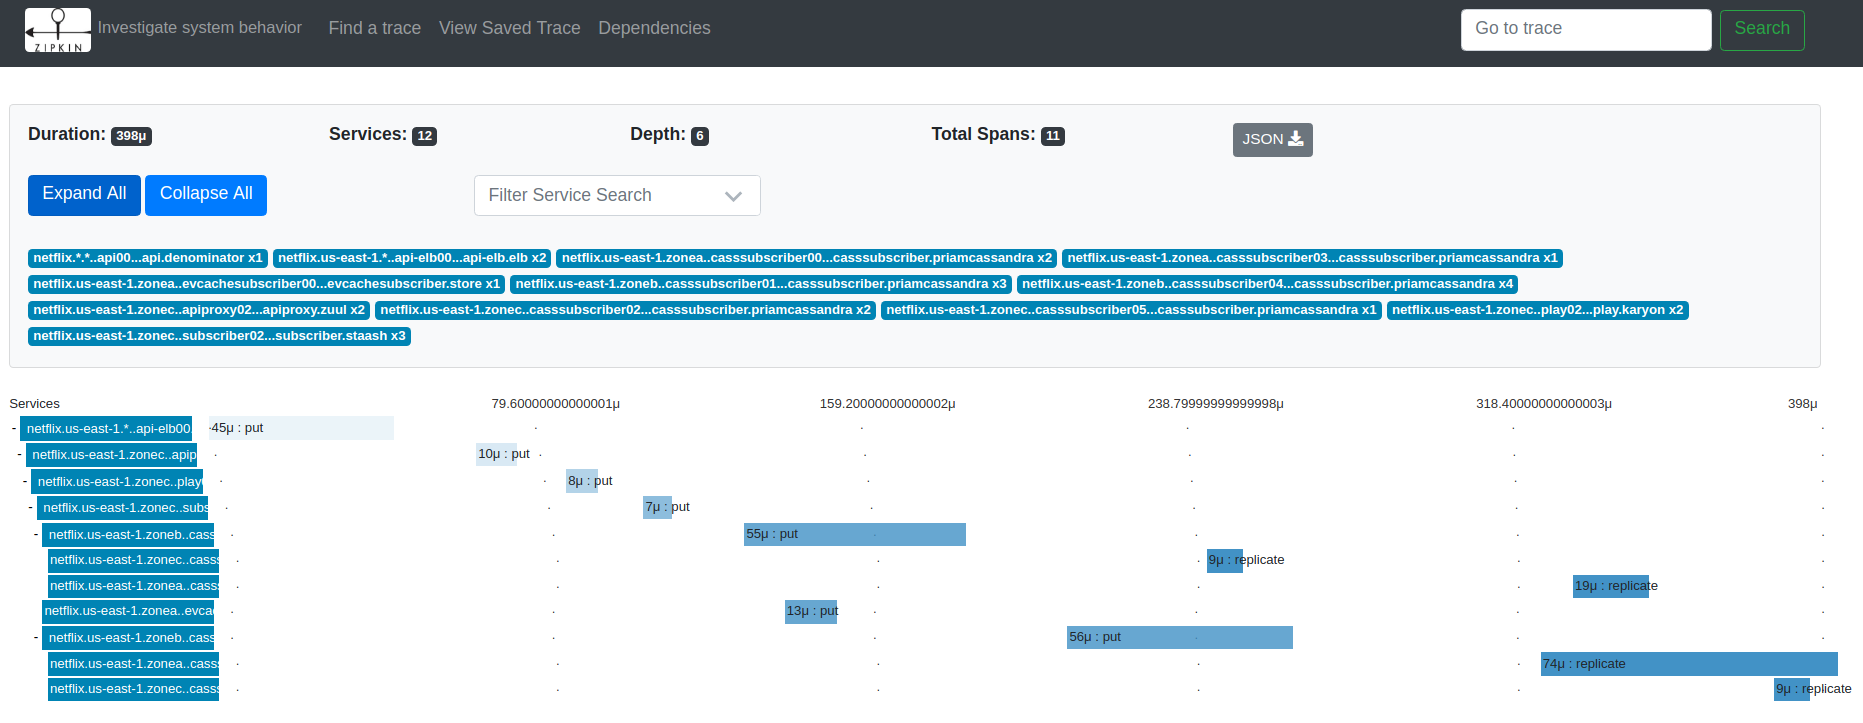
Then you can go to visualize traces on Zipkin
And check how the service dependency is represented:
You can follow the same example with the current or desired architecture of your organization and start experimenting with Distributed Tracing platforms like Zipkin.
- Generate Vizceral traffic monitoring from your architecture:
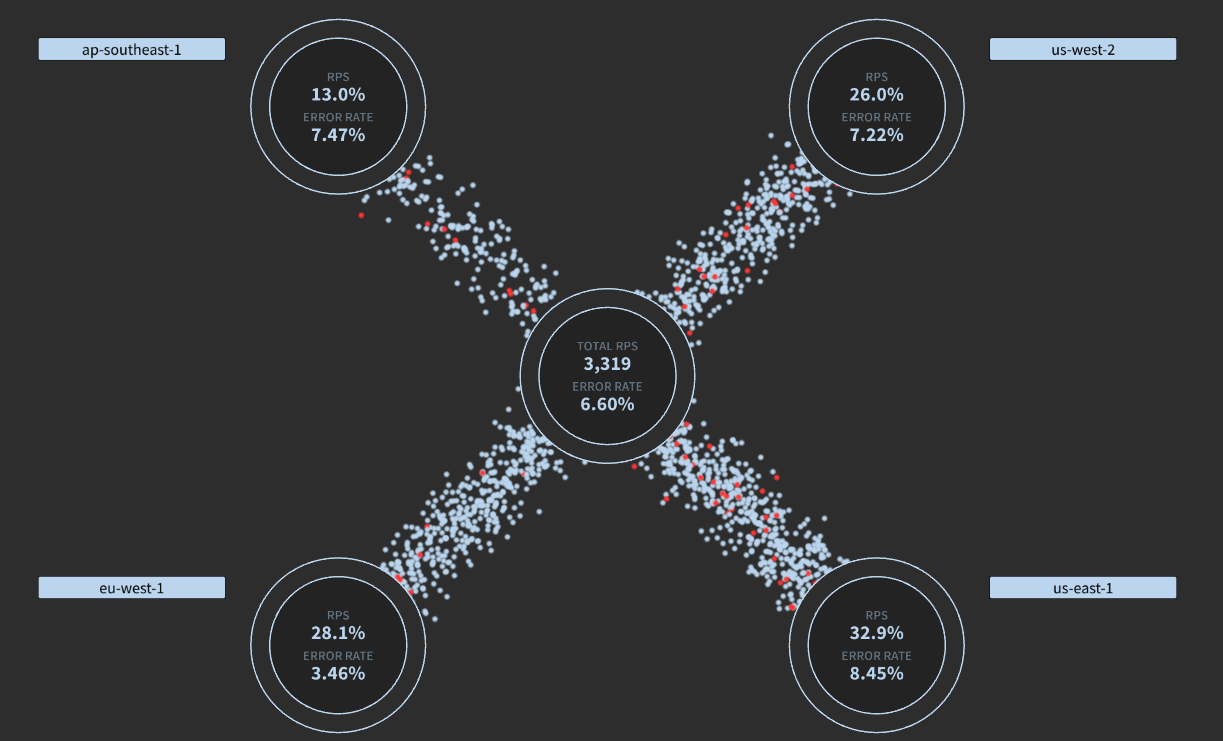
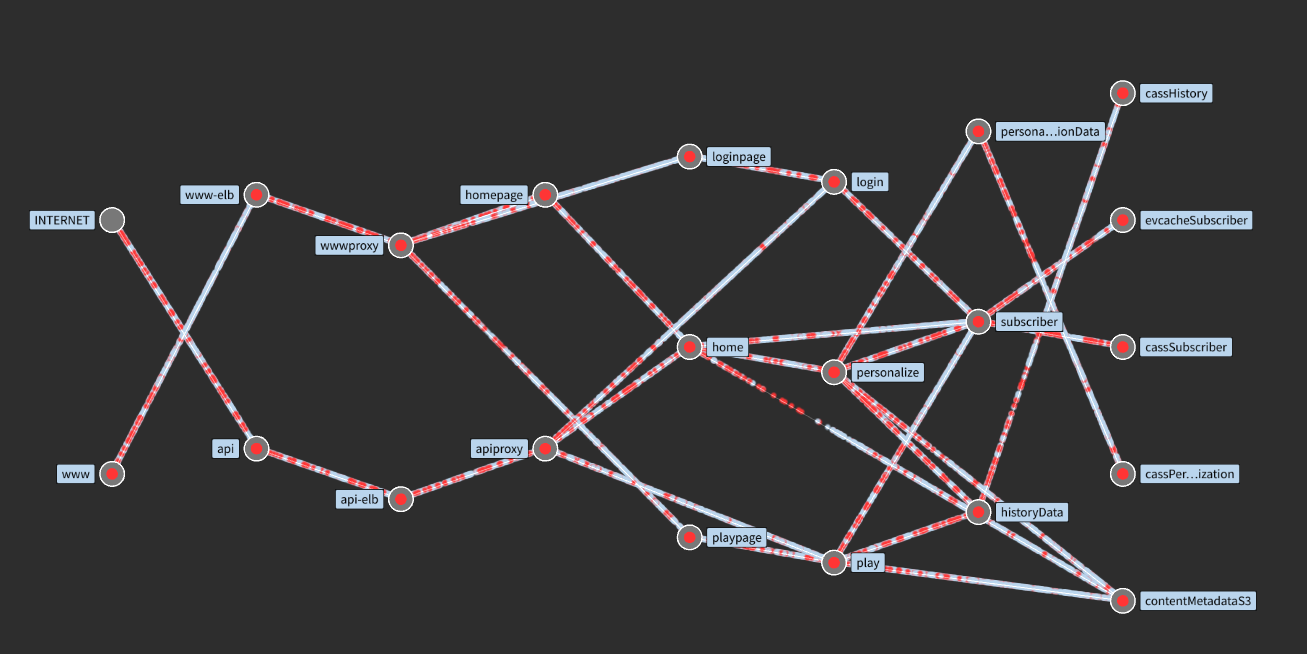
Vizceral is one more example of models that can be built on top of tracing data. It will show how messages are coming from the internet, are spread between data-centers and then you can drill down into the details of specific components.
Migrate your Spigo model to Vizceral JSON model:
cd go-vizceral/arch2vizceral
cp <arch json> arch_json/.
./arch2vizceral -arch netflix > netflix_vizceral.json
Update the hard-coded reference to JSON located on src/components/trafficFlow.jsx#L151:
  beginSampleData () {
    this.traffic = { nodes: [], connections: [] };
    request.get('netflix_vizceral.json')
      .set('Accept', 'application/json')
      .end((err, res) => {
        if (res && res.status === 200) {
          this.traffic.clientUpdateTime = Date.now();
          this.updateData(res.body);
        }
      });
  }
Copy Vizceral JSON to Vizceral example project and run example:
make vizceral
Go to http://localhost:8080
Traffic from internet to datacenters:
If you check one of the data centers, you will see the traffic between services:
