tracing_malloc is a memory analyzer and memory leak detector for Linux C/C++. It's very convenient to use:
- No need to modify or recompile the target executable. It injects into the target process via LD_PRELOAD method to monitor memory allocation(such as malloc)
- Low performance cost of collecting time-based memory activity data compared with valgrind and memloax. It can be used for large projects like Dedicated Server of UE4.
- Realtime track of non-freed memory, including stack, allocation size and time.
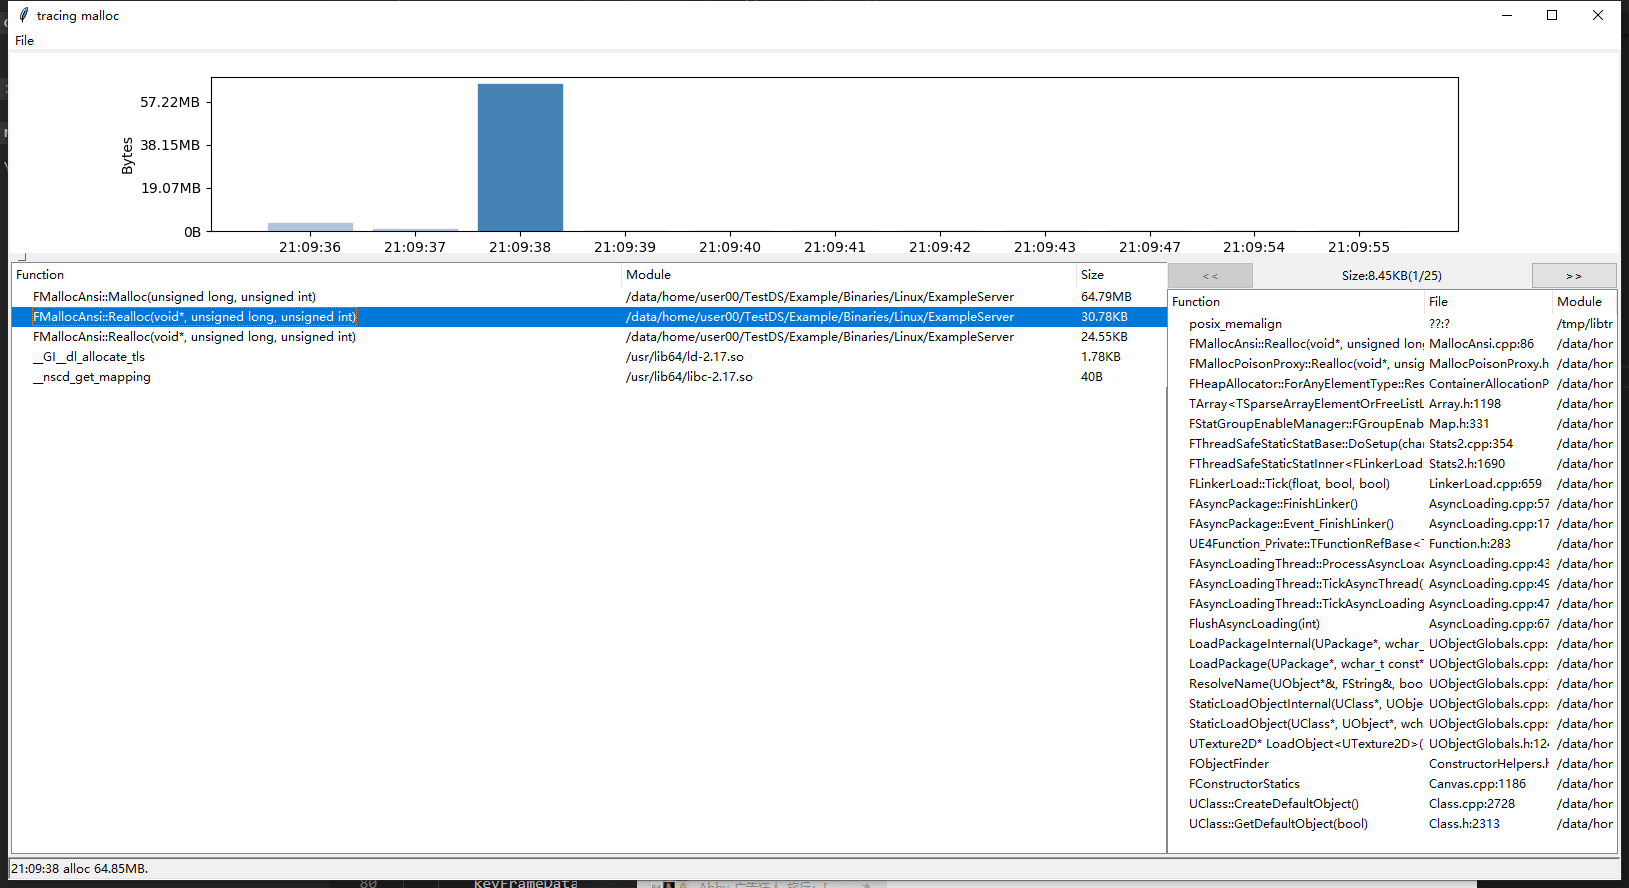
- Visual analyzation tool, easy inspection of memory allocation based on time.
- Run ./build_libunwind to install libunwind
- Create a temporary dir and run
cmake -DCMAKE_BUILD_TYPE=RelWithDebInfo ${proj}/src - make
For example, in order to analyze ./alloc_comparison whose command line arguments are "4096 1024 2"
Run tracing.py --collection_interval_ms=1000 ./alloc_comparison 4096 1024 2
This will generate tracing.malloc.pid.time files in current directory for every 1000ms. An example file name is tracing.malloc.4098.2019_12_05_09_56_43_069546
After the process quits, a tracing.malloc.pid is generated, like tracing.malloc.4098
To see unfreed memory and its allocation time, use ${proj}/tools/disuse/allocation/main.py to open tracing.malloc.pid or tracing.malloc.pid.time.
-
time ./Example/Binaries/Linux/ExampleServer Example -ansimallocreal 0m5.375s user 0m0.760s sys 0m0.212s
-
time LD_PRELOAD=/tmp/libtracing_malloc.so ./Example/Binaries/Linux/ExampleServer Example -ansimallocreal 0m6.888s user 0m1.868s sys 0m0.740s
-
time valgrind ./Example/Binaries/Linux/ExampleServer Example -ansimallocreal 0m53.204s user 0m48.016s sys 0m1.300s
