Data Analysis With Python Practice


DA1 (Temperature analysis with public csv data)

  • highest temperature print max_temp

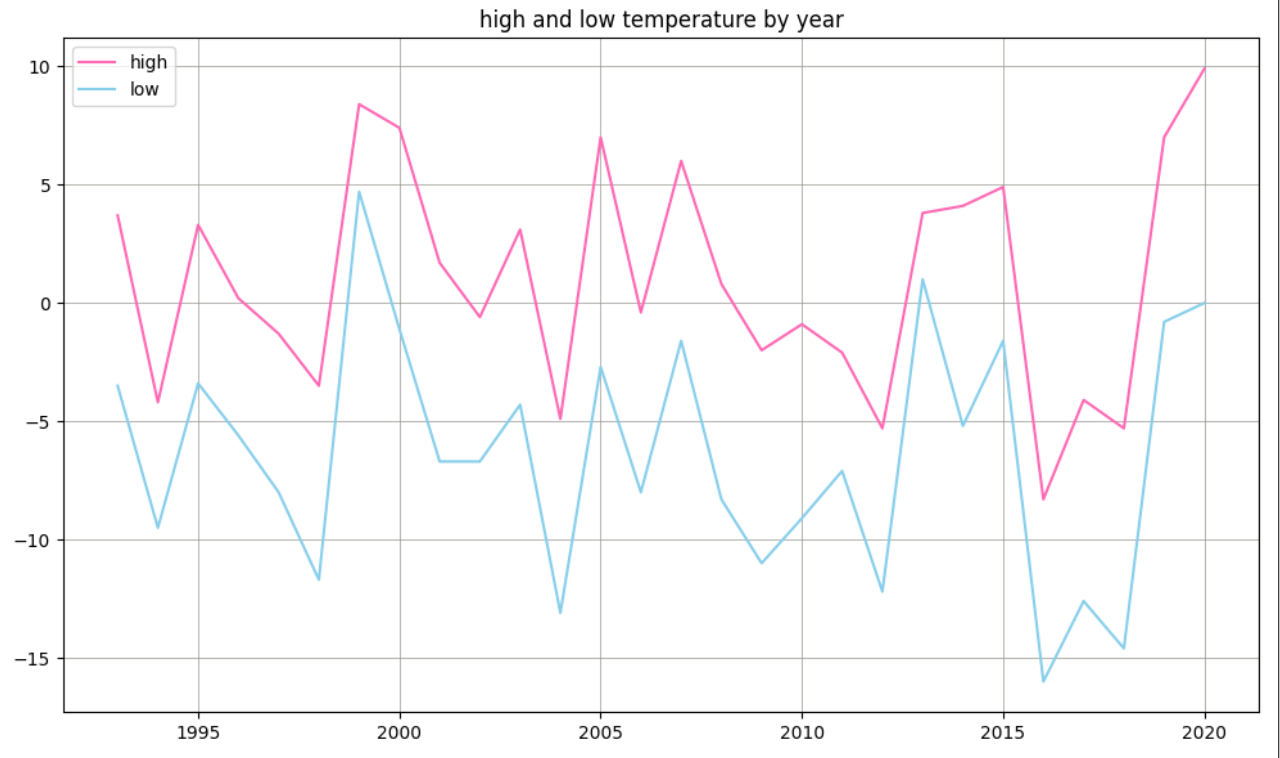
  • biggest high and low temperature print biggest_high_low

DA2 (Data Visualization with matplotlib)

  • high and low temperature liner chart high_low

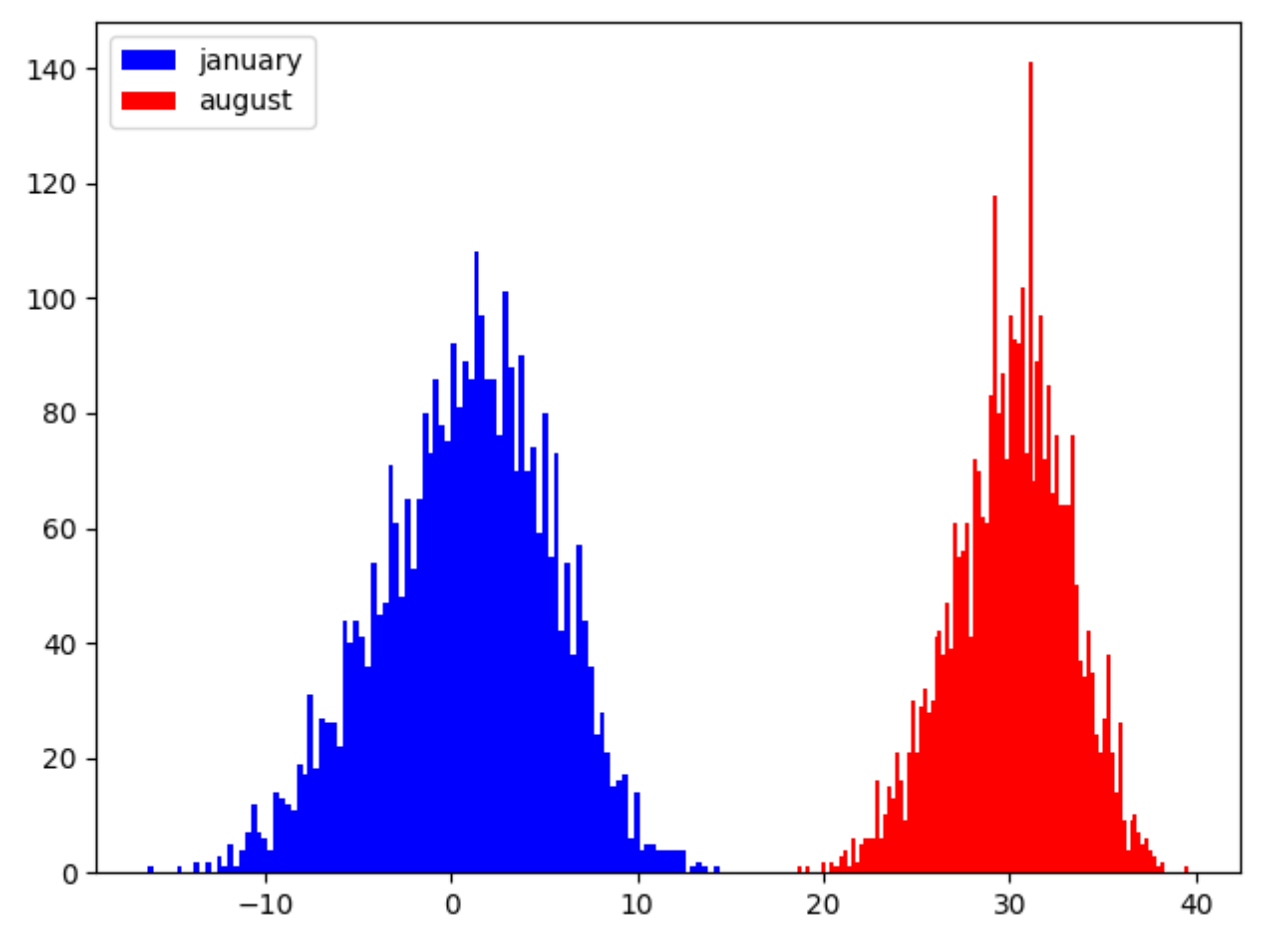
  • winter and summer temperature histogram winter_summer_histogram

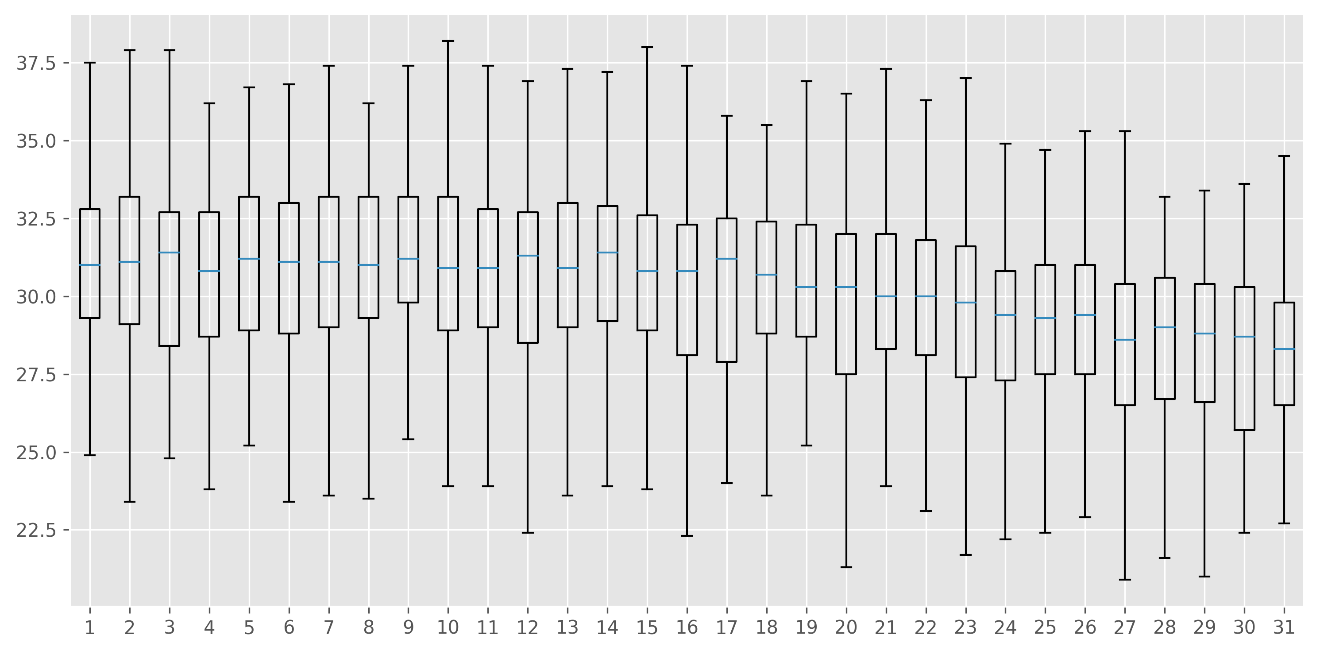
  • average temperature box plot graph in august august_box_plot

DA3 (Korea Population analysis with public csv data)

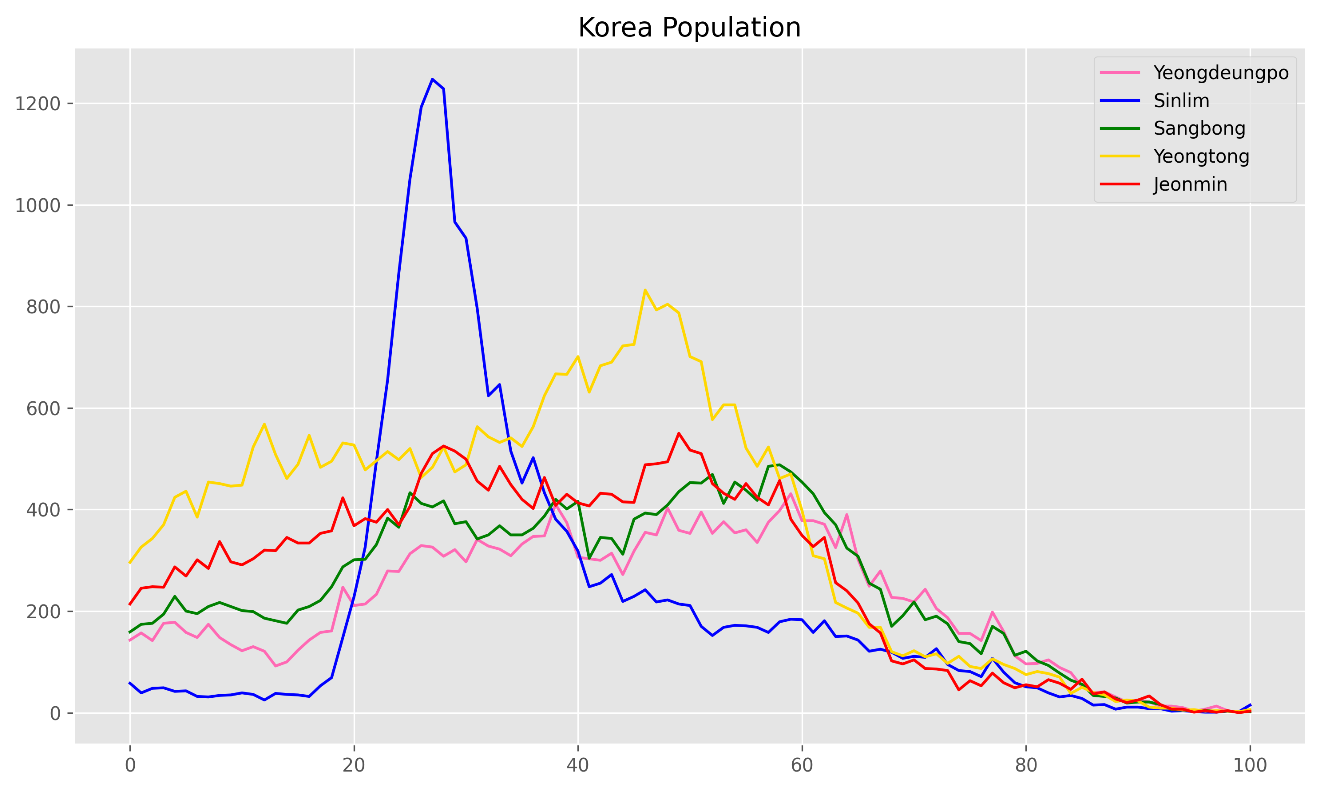
  • korea population liner chart korea_population_liner

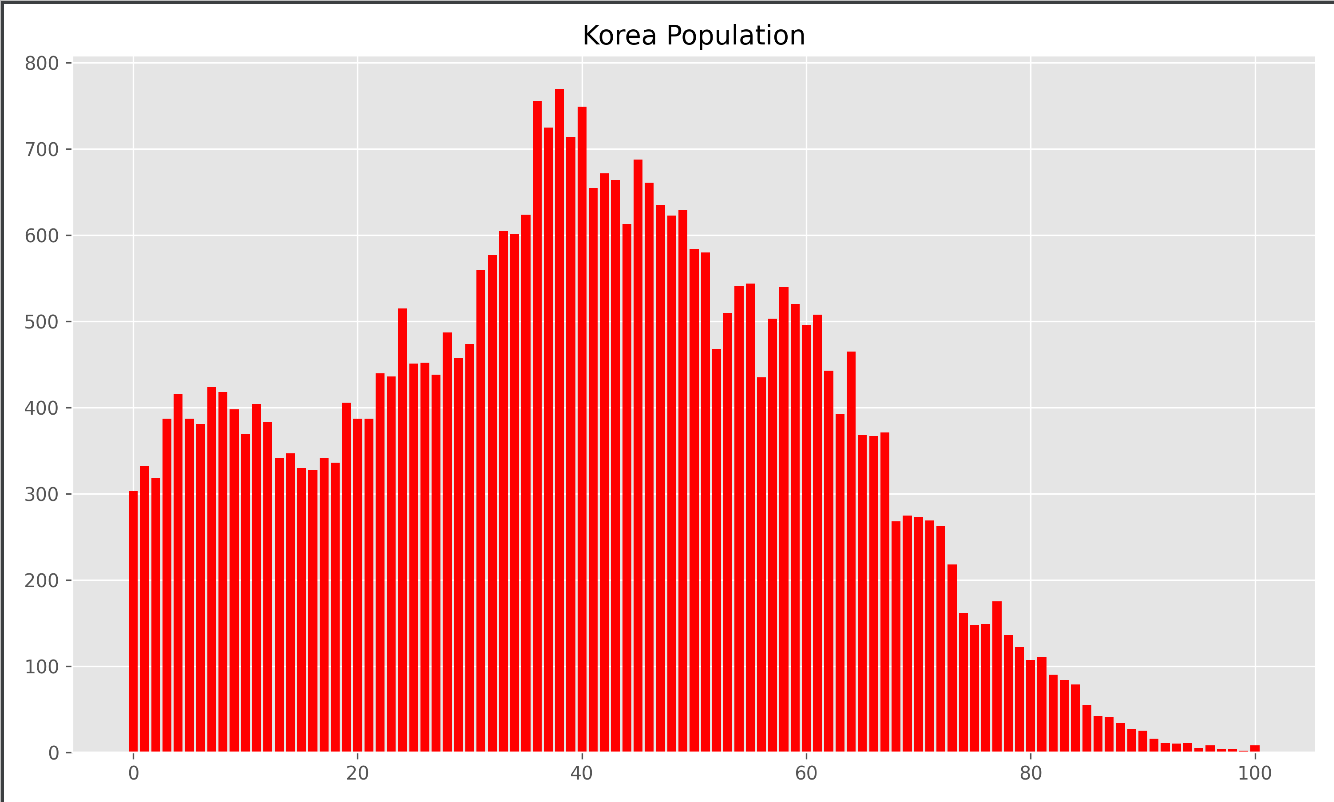
  • district population by input value popultion_input population_bar_input

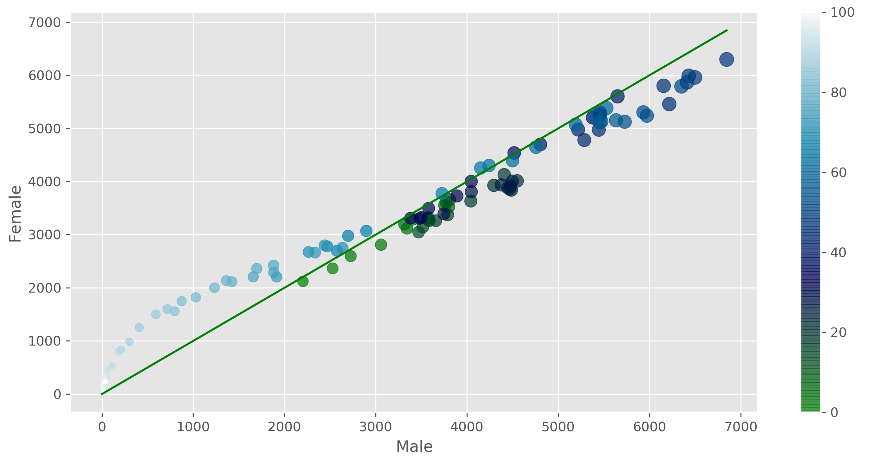
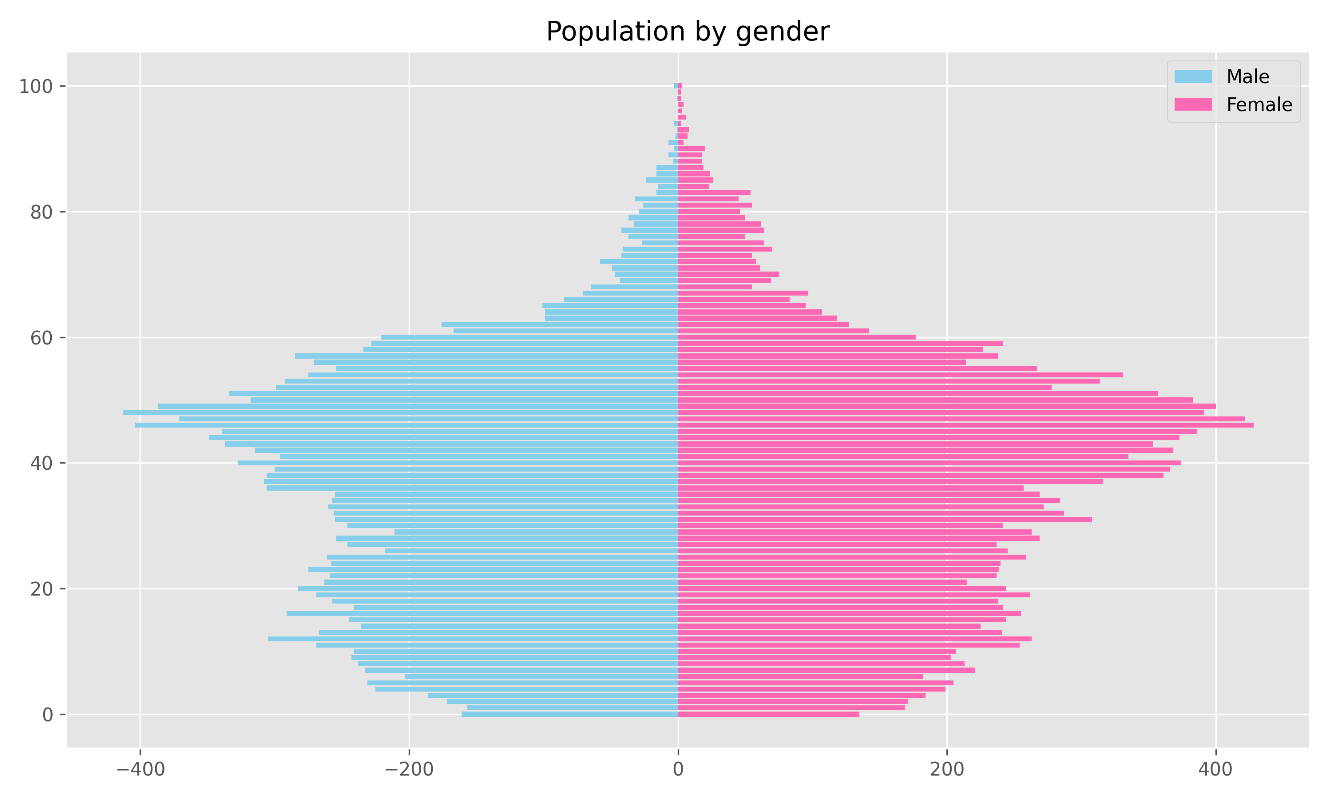
  • population ratio by gender
    population_gender_input population_gender_jar

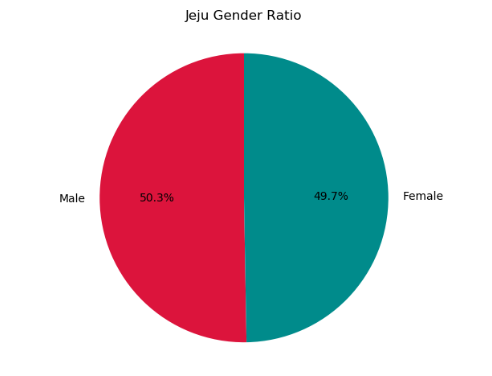
  • Jeju population ratio pie chart by gender
    jeju_gender_ratio

  • Jeju population ratio scatter chart by gender
    jeju_gender_ratio