Use weather-icons in ggplot2, markdown and shiny.
You can install the development version from GitHub with:
# install.packages("devtools")
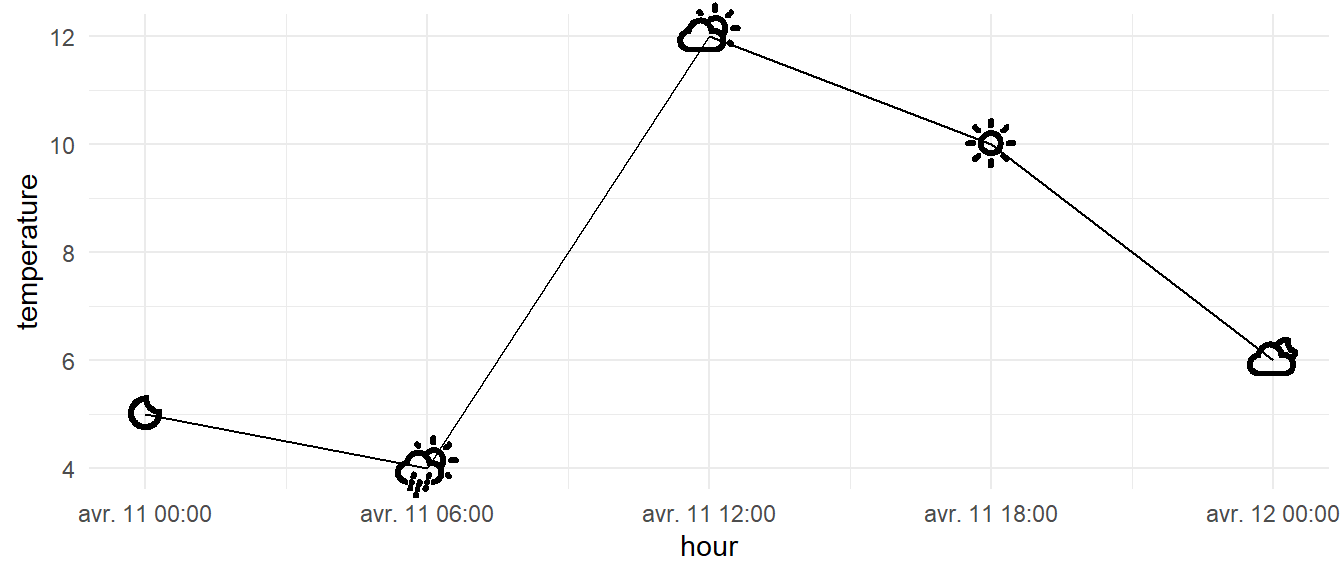
devtools::install_github("dreamRs/weather")Plot weather icons with geom_weather :
library(ggplot2)
library(weather)

df <- data.frame(
  hour = seq(as.POSIXct("2017-04-11"), by = "6 hour", length.out = 5),
  temperature = c(5, 4, 12, 10, 6),
  weather = c("night-clear", "day-rain-mix",
              "day-cloudy", "day-sunny",
              "night-alt-cloudy")
)

ggplot(data = df) +
  geom_line(aes(hour, temperature)) +
  geom_weather(aes(hour, temperature, weather = weather)) +
  theme_minimal()
Icons available are listed in weather_icon_names.
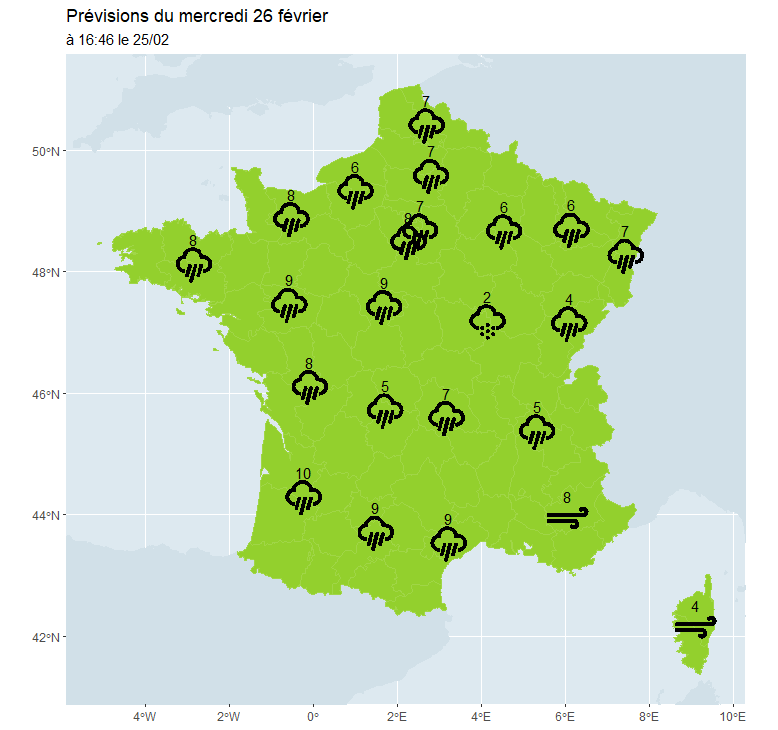
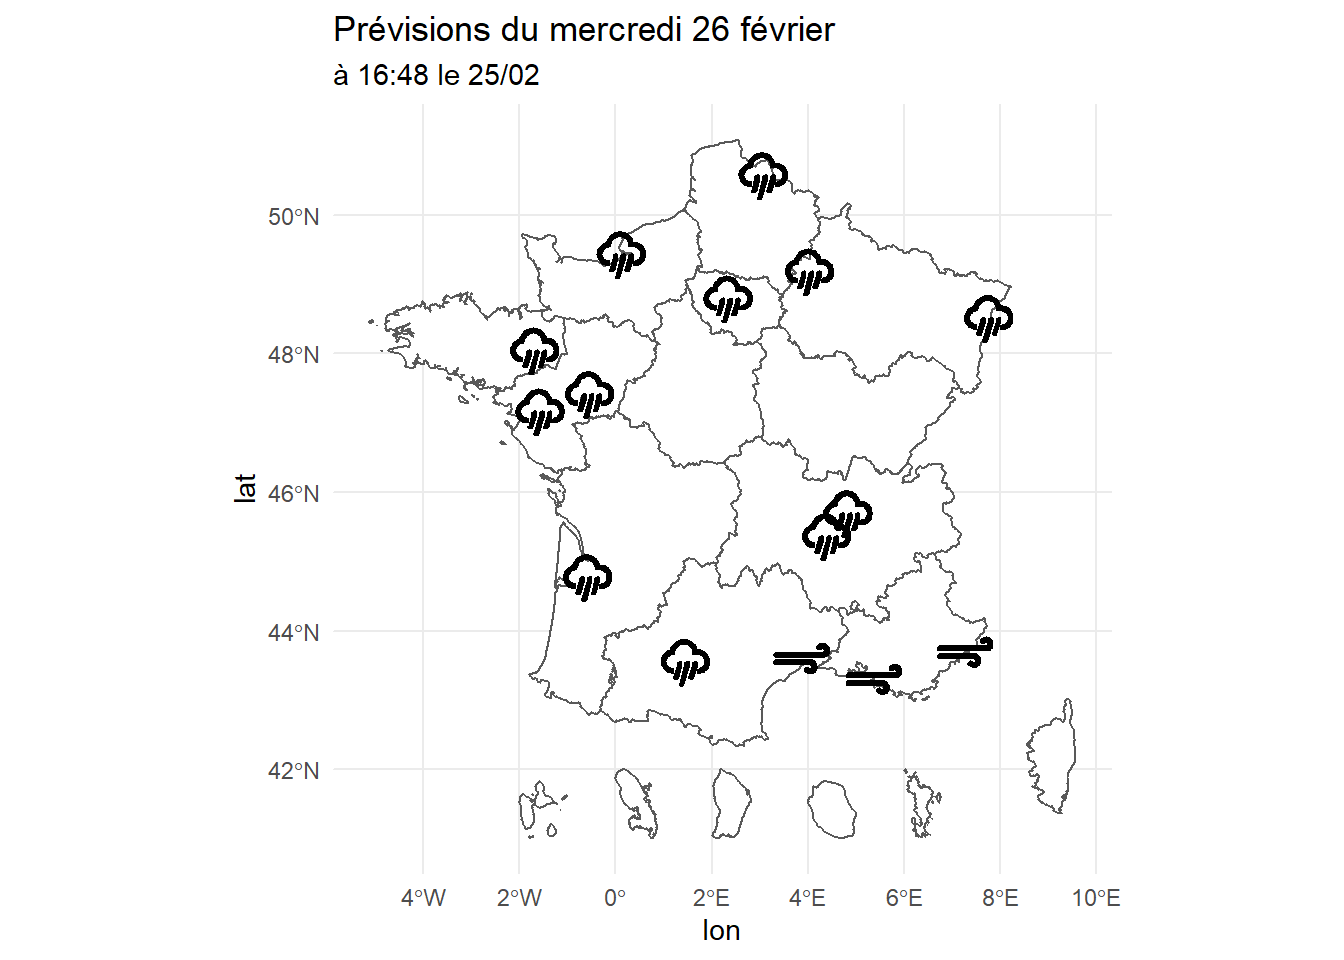
Or plot on a map:
library(ggplot2)
library(weather)
library(darksky)
library(sf)
# devtools::install_github("antuki/CARTElette/CARTElette@RPackage")
library(CARTElette)

# Get forecast for some cities
fr_now <- mapply(
  FUN = function(latitude, longitude) {
    res <- get_current_forecast(
      latitude = latitude,
      longitude = longitude,
      exclude = "currently,minutely,hourly,alerts,flags"
    )
    res <- res$daily
    res$lat <- latitude
    res$lon <- longitude
    res
  },
  latitude = c(48.86, 43.31, 45.76, 43.62, 43.7, 47.23, 48.58, 43.61, 50.64,
               44.84, 48.11, 49.25, 49.5, 45.43, 47.48),
  longitude = c(2.34, 5.37, 4.83, 1.45, 7.27, -1.57, 7.76, 3.87, 3.07, -0.58,
                -1.68, 4.03, 0.12, 4.39, -0.54),
  SIMPLIFY = FALSE
)
fr_now <- do.call("rbind", fr_now)
fr_tomorrow <- fr_now[as.character(fr_now$time) == Sys.Date() + 1, ]


# Load France polygons
france <- charger_carte(nivsupra = "REG")
france <- sf::st_transform(france, crs = 4326)

ggplot(data = france) +
  geom_sf(fill = "white") +
  geom_weather(
    data = fr_tomorrow,
    mapping = aes(lon, lat, weather = icon),
    api = "darksky"
  ) +
  theme_minimal() +
  labs(
    title = paste(
      "Pr\u00e9visions du",
      format(fr_tomorrow$time[1], format = "%A %d %B")
    ),
    subtitle = paste("\u00e0", format(Sys.time(), format = "%H:%M le %d/%m"))
)Display icons in rmarkdown document and shiny application with
weather_icon. You can control size and color :
weather_icon("day-sunny", size = "50px", color = "goldenrod")Example in shiny:
navbarPage(
  title = "App Title",
  tabPanel(
    title = "Plot", icon = weather_icon("sunrise"),
    actionButton("go", "a button", icon = weather_icon("day-rain"))
  ),
  tabPanel("Summary", icon = weather_icon("cloud")),
  tabPanel("Table", icon = weather_icon("tornado"))
)
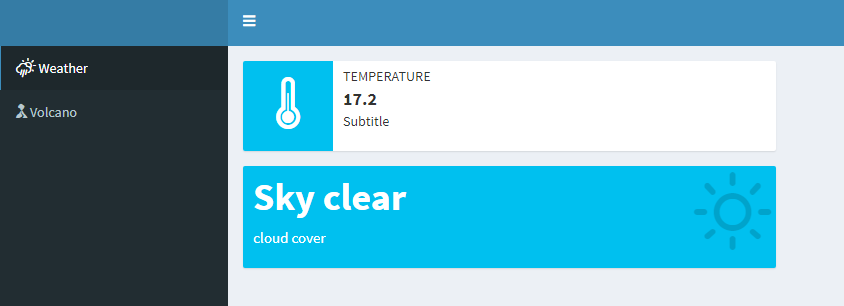
In shinydashboard:
# In sidebar
menuItem("Weather", tabName = "Weather", icon = weather_icon("day-rain"))

# In infoBox
infoBox(
  "Temperature", "17.2", "Subtitle", icon = weather_icon("thermometer")
)

# In valueBox
valueBox(
  "Sky clear", "cloud cover", icon = weather_icon("day-sunny")
)geom_weather is largely inspired by ggflags
(https://github.com/ellisp/ggflags &
https://github.com/rensa/ggflags).
