Project Overview: Sparkify is a digital music service similar to Spotfiy and Pandora. In Sparkify, users can either listen to music for free or buy a subscription. Customer churn prevention is a hot and challenging problem in almost every product and service company. If companies were able to utilize customer-usage data to find unique trends and accurately map them to indicate which customers may churn, it would be possible to incentivize customers to remain using their services giving them a loyal customer base which is key for a company’s growth.
Project Purpose: In order to identify users who are likely to churn, it’s important to perform an exploratory analysis to glean insights from the data set and identify key variables of interest. The next process is to experiment different model algorithms and then select the best model based on key evaluation metric such as F1 Score and accuracy using Spark ML Library.
The expectation is that some of these features will reveal a substantial difference between customers that churn versus those that don't. This information is used to create useful features for a classification model for churn. We will experiment using models such as Logistic regression, random forest, gradient boosting, and decision tree to evaluate the problem.
Metrics: The classification model is evaluated using standard metrics for binary output data - accuracy and F1-score. F1-score is given greater importance from an interpretation perspective due to imbalanced nature of the output data (significantly fewer customers churn than don't). Accuracy only works well when the dataset classes are balanced
Data: The data we have from Sparkify is that of user events. Every interaction of every user with the application is given to us. This means every time a user goes to the Home page, listens to a song, thumbs up a song, etc. we have an event in the data corresponding to the same.
I wrote an article on medium that provides more details and indepth explanations: Here
The following Features will be created at user level:
- gender: gender of the user. Male = "1", Female = "0" [binary]
- churn: a page for 'Cancel Confirmation' defined as churn. Churn = "1", Absence of churn = "0" binary
- level: latest level of a user. paid = "1", free = "0" [binary]
- length: user total length of songs listened [float]
- avg_session_duration: user average session duration [float]
- location: location of the user [binary]
- page: number visits per page feature - Add friend, Add to Playlist, Downgrade, Error, Help, Home, etc.. [int]
- time_since_reg: time since registration [int]
- sessions: total number of sessions [int]
- songs: total number of songs played [int]
- userAgent: agents/device used by the user [binary]
We fitted logistic regression, Random Forest, Gradient boosting and Decision Tree classifier with default parameter. We'll look for f1 score and accuracy, however f1 score is more reliable in this case due to imbalance in class from accuracy.
The table summarised the scores for these classifiers.
| Classifier | f1-score | accuracy |
|---|---|---|
| Logistic Regression | 0.86539 | 0.87685 |
| Random Forest | 0.94284 | 0.94692 |
| Gradient Boosting | 0.99038 | 0.99044 |
| Decision Tree | 0.93170 | 0.93418 |
With the default parameter, Gradient Boosting has the highest score of all the metrics and Random forest comes second.
The table summarised the scores for the tuned classifiers.
| Classifier | f1-score | accuracy |
|---|---|---|
| Logistic Regression Tuned | 0.89731 | 0.90552 |
| Random Forest Tuned | 0.98705 | 0.98726 |
| Gradient Boosting Tuned | 0.99146 | 0.99150 |
| Decision Tree Tuned | 0.98497 | 0.98513 |
After tuning with various gridsearch parameters, Gradient Boosting remains the highest score of all the metrics and Random forest comes second.
Feature importance was calculated using the Logistic Regression model
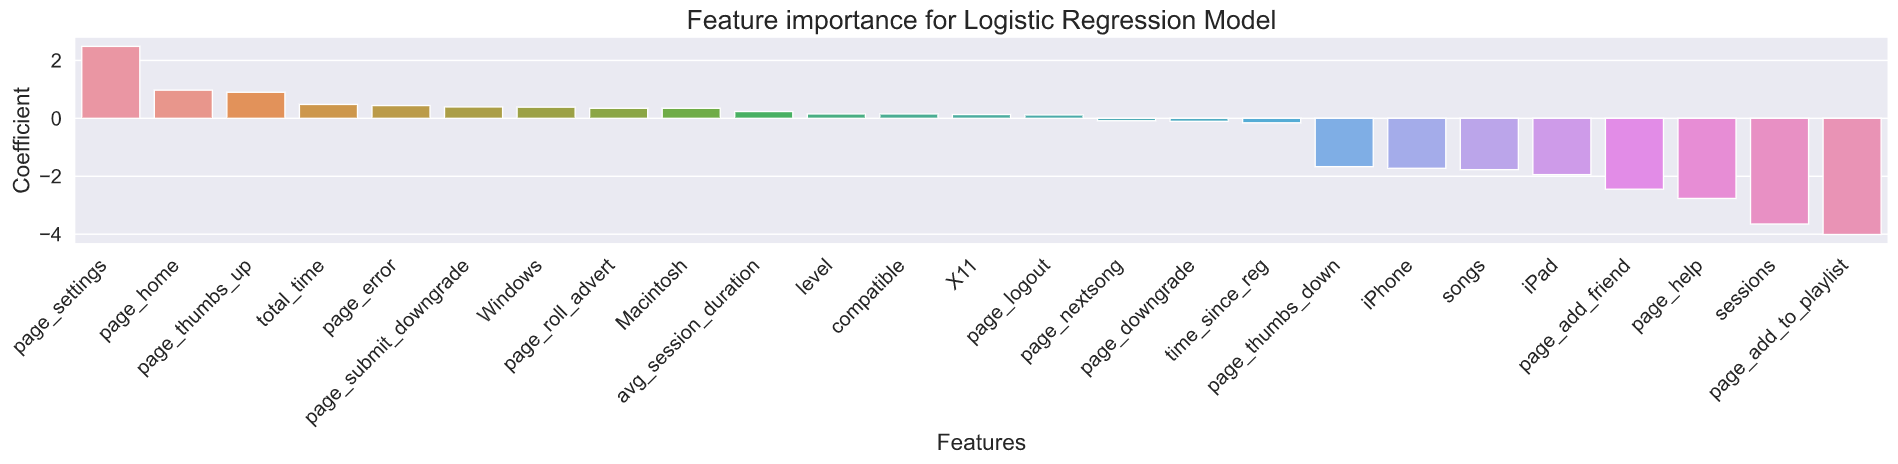
Top 5 Feature Importances were as listed below:
- Page Settings
- Page Home
- Page Thumbs Up
- Total Time
- Page Error
![]()
Python 3.5+, Spark
- pandas
- numpy
- matplotlib
- time, datetime
- scikit-learn
- pyspark.sql
- pyspark.ml
- Sparkify.ipynb - Jupyter notebook containing Spark implementation.
- README.md (this file)
- Sparkify - Extra EDA.ipynb - extra Exploratory Analysis
- images - contains charts and images used