Built-in metrics for external services HTTP calls! This gem is a Part of the yabeda suite.
Read introduction article on dev.to.
Works as the Puma plugin and provides following metrics:
http_request_total- the number of external HTTP request attempts (by host, port, method)http_response_total- the number of made external HTTP requeusts (by host, port, method, status)http_response_duration- the histogram of response duration (by host, port, method, status)
Add this line to your application's Gemfile:
gem 'yabeda-http_requests'And then execute:
$ bundle install
Or install it yourself as:
$ gem install yabeda-http_requests
After plugin the gem, you just have to set up metrics exporting with yabeda-prometheus gem.
The metrics page will look like this:
# TYPE http_requests_total_count counter
# HELP http_requests_total_count A counter of the total number of external HTTP requests.
http_request_total{host="twitter.com",port="443",method="GET",query="/dsalahutdinov1"} 149.0
http_request_total{host="dev.to",port="443",method="GET",query="/amplifr"} 145.0
...
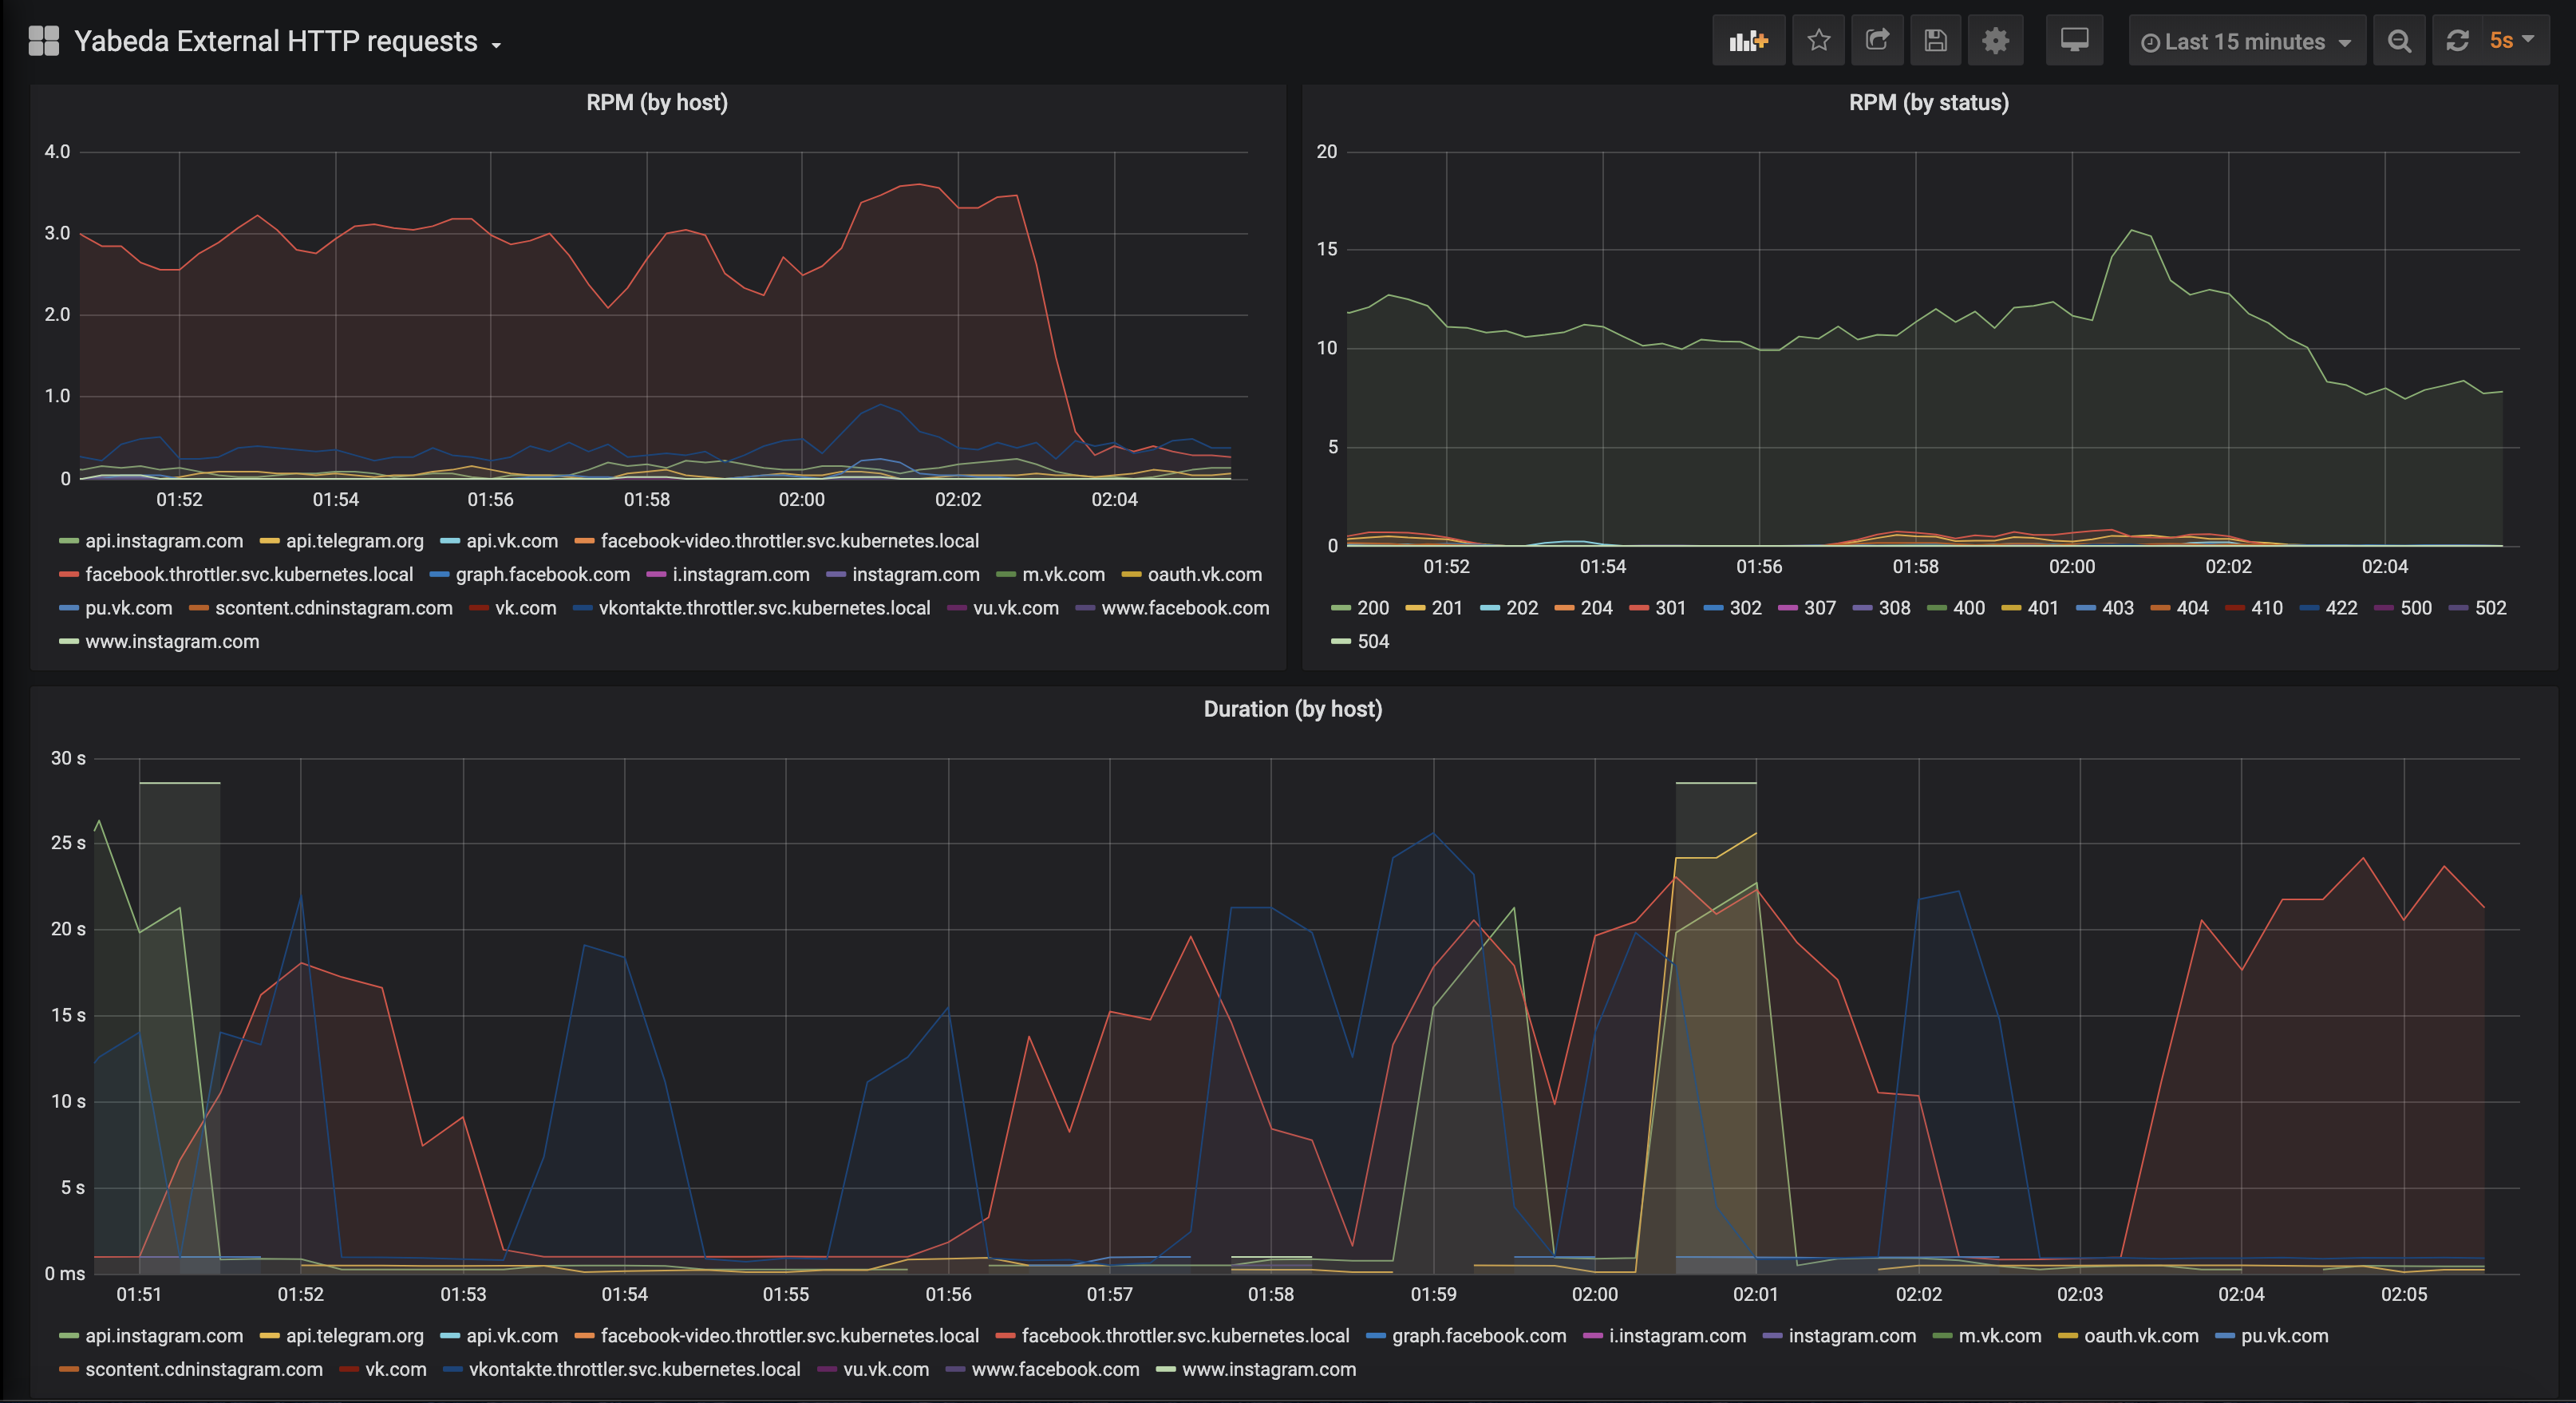
To simple set up Grafana, try the sample dashboard.
Sample application aims to show how Ruby web-application, this gem and Prometheus/Grafana work togather.
Get into example directory and run docker compose:
$ cd example
$ docker-compose up
After docker image builds and all the services get up, you can browse application endpoints:
- Ruby web-application runs on http://localhost:9292/. Everytime you request page, it schedules random web-scrapping job into sidekiq.
- Sidekiq exposes prometheus metrics on http://localhost:9394/metrics. This endpoint is scrapped by prometheus exporter every 5 seconds.
- Grafana runs on http://localhost:3000/. Use
admin/foobaras login and password to get in. Grafana already has specific dashboard with data visualisation.
Follow the yabeda-external-http-requests dashboard in Grafana.
Finally, after a couple of minutes when data collected you will see the following:

Get local development environment working and tests running is very easy with docker-compose:
docker-compose run app bundle
docker-compose run app bundle exec rspecBug reports and pull requests are welcome on GitHub at https://github.com/yabeda-rb/yabeda-http_requests.
The gem is available as open source under the terms of the MIT License.