PubNub Real-Time WebGL Visualization
A visualization of real-time PubNub traffic written using JavaScript and WebGL.
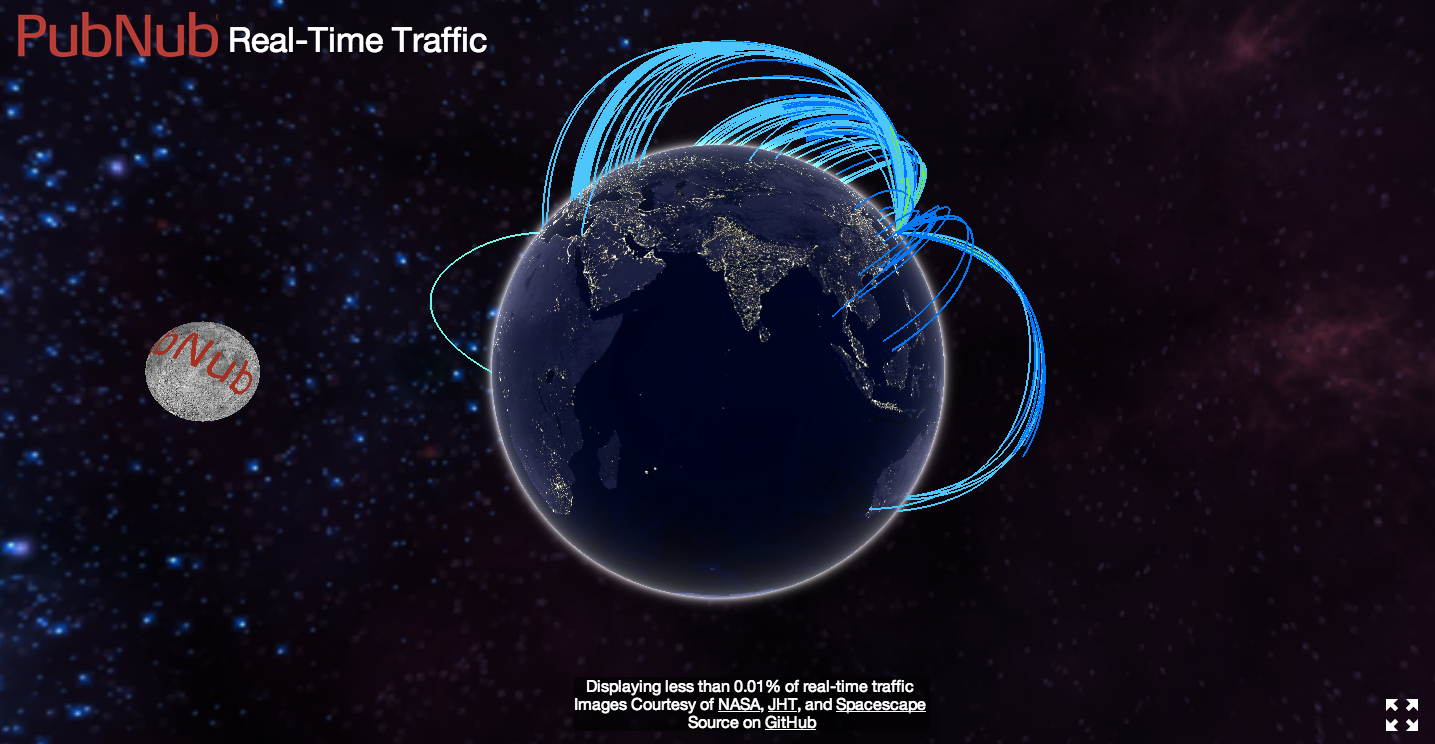
This demo uses PubNub Data Streaming technology to get a feed of geolocation coordinates from the PubNub network. It then converts those geo coordinates to Vector3 positions on the globe and links them with a bezier curve. Finally we animate everything and add controls to make it interactive!
Interested in learning more? Visit PubNub to find out!