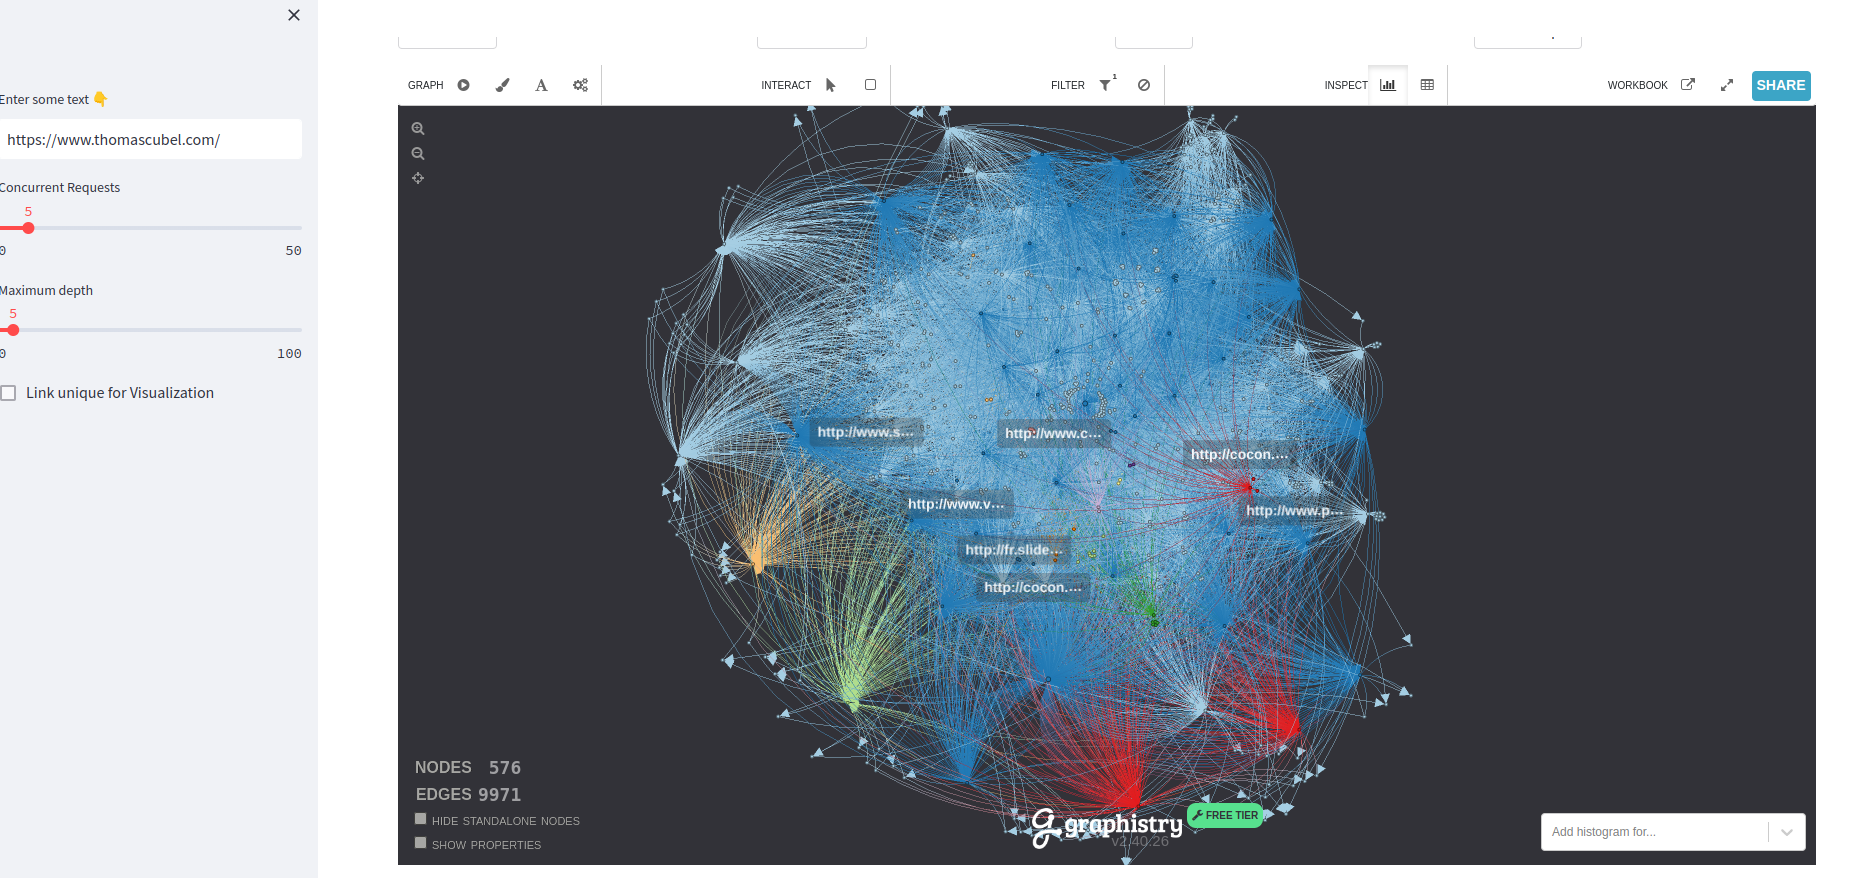
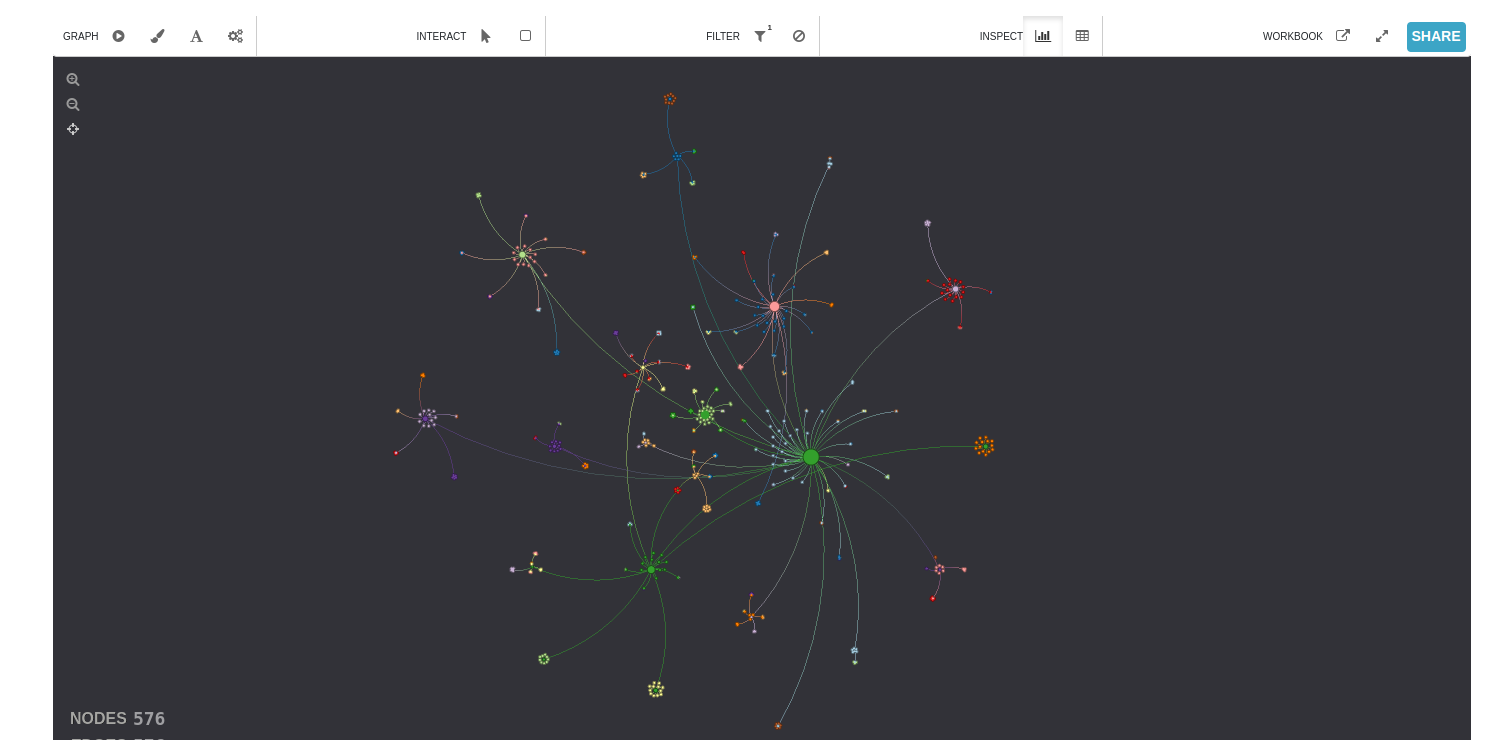
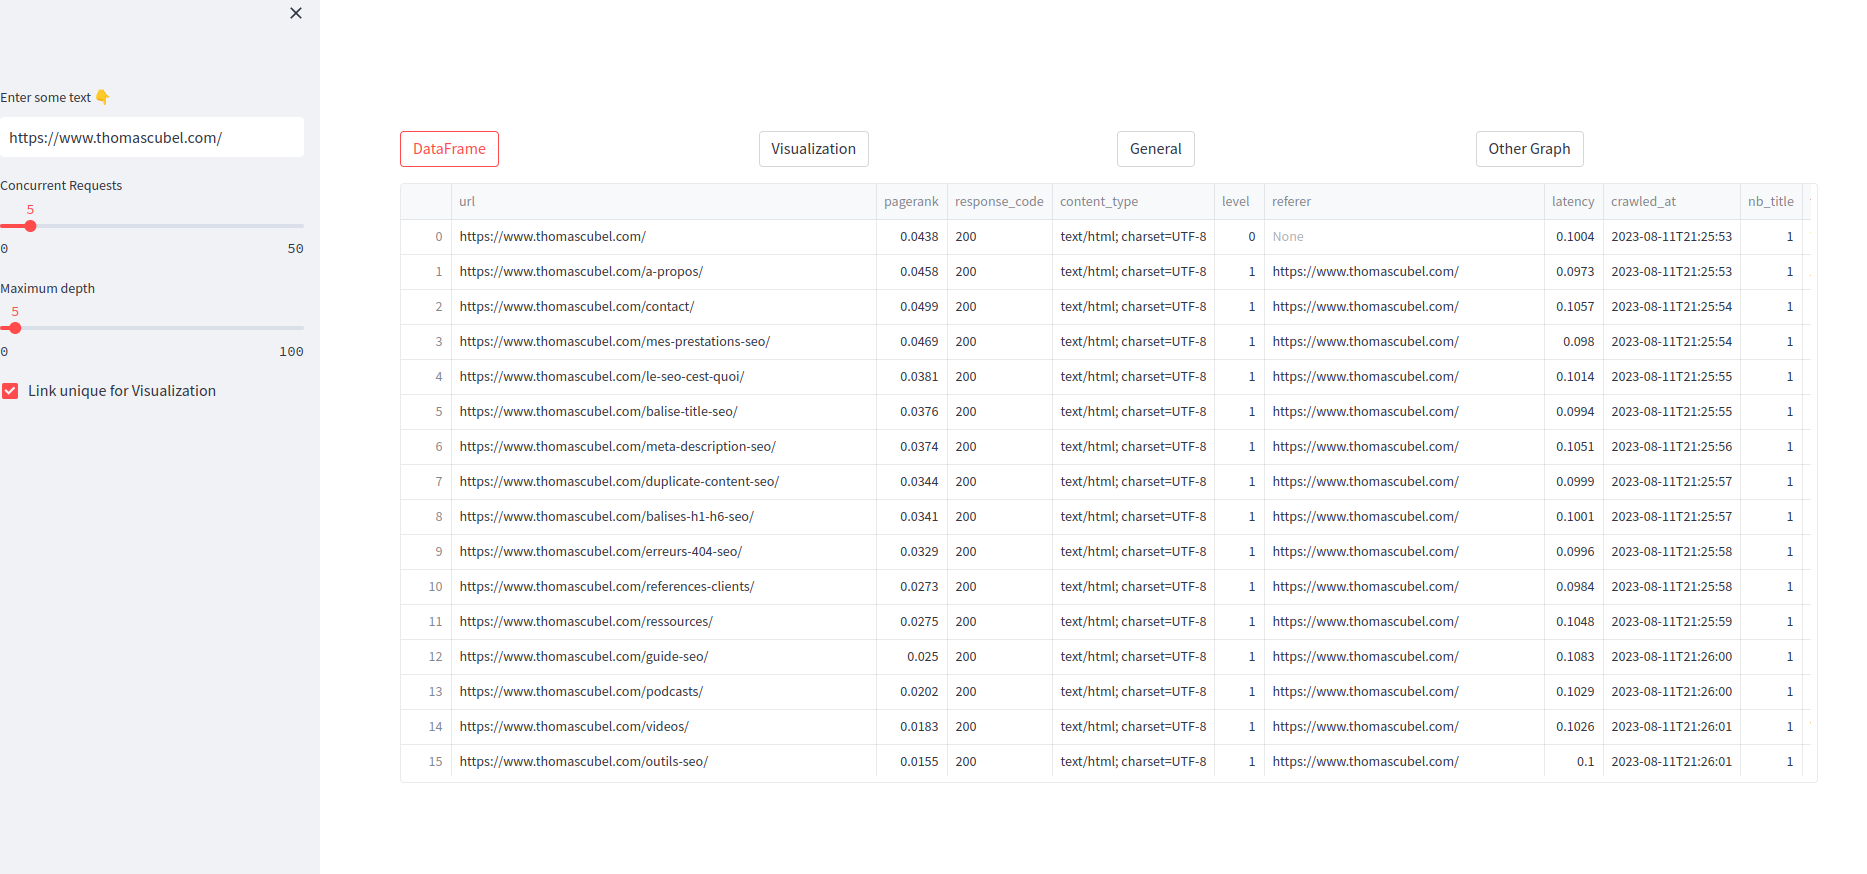
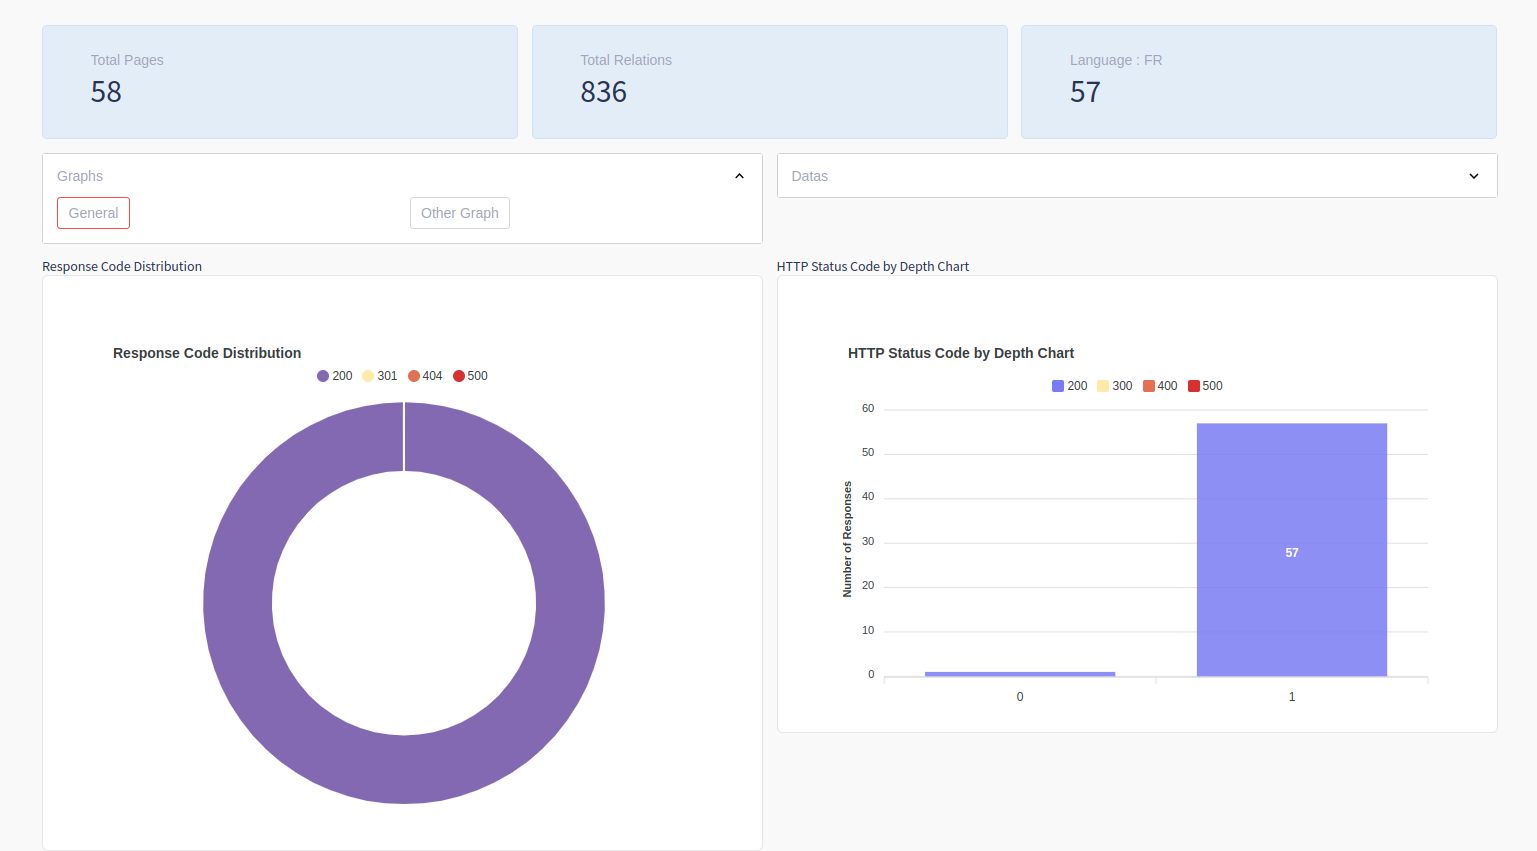
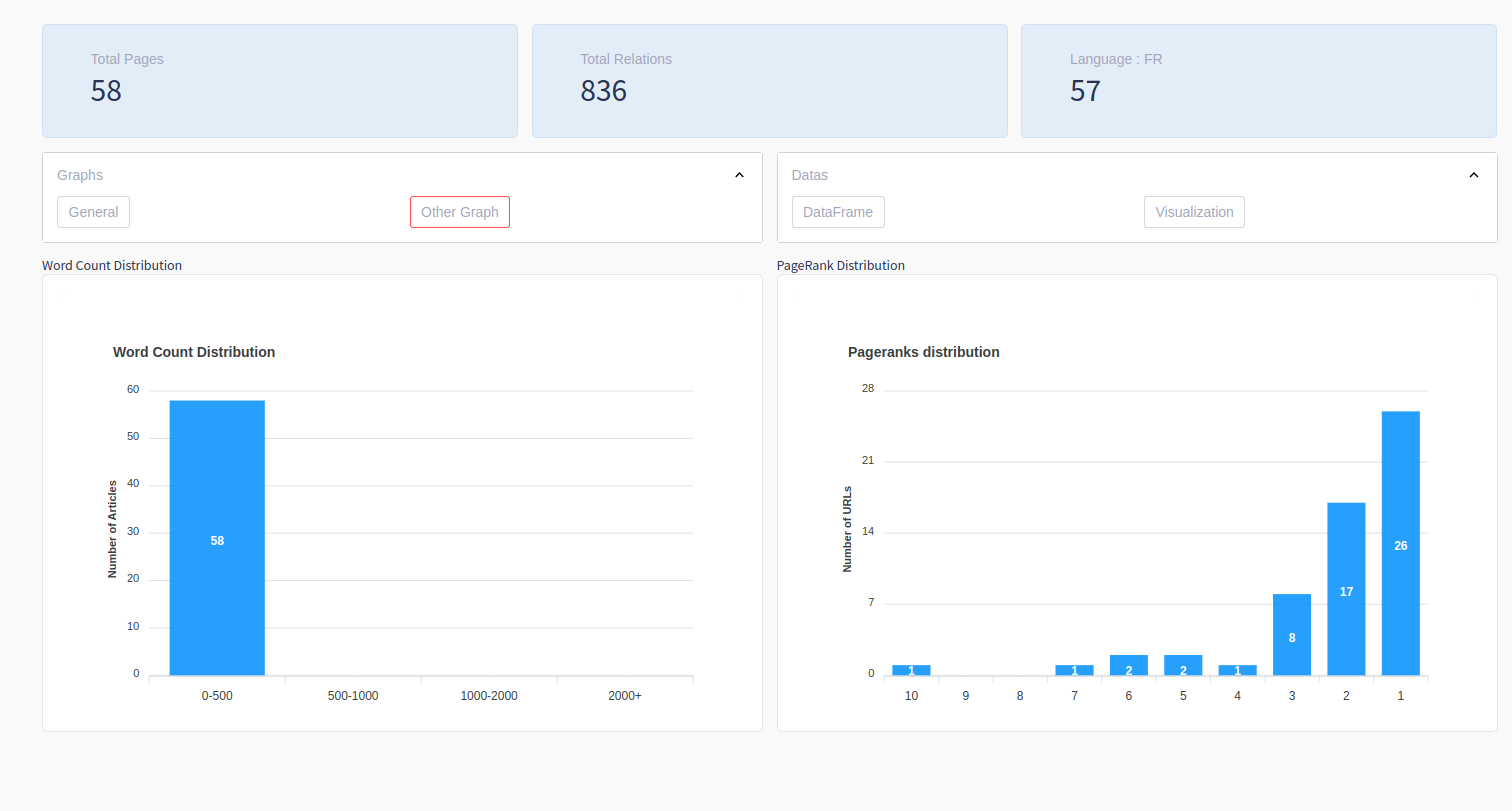
This project is a web crawler based on Scrapy (and Crowl.tech), enriched by a Streamlit user interface to visualize and analyze the results.
- Web Crawler: Uses Scrapy (Crowl) to browse and collect data from specified websites.
- Streamlit interface: Allows interactive visualization and analysis of collected data, including a distribution of PageRanks.
- CSV Export: Ability to export collected data in a CSV format for further processing.
In this project, we use a method to calculate the PageRank of different pages, inspired by the original algorithm. By adding the concept of the reasonable surfer.
We use ECharts, an open source visualization library, to display the distribution of PageRanks of our crawled web pages. The distribution of response statuses, links by depth, and other information.
-
Type: We opted for a bar graph to clearly visualize the distribution of PageRank scores.
-
Tooltips: By hovering over each bar, you can see a tooltip that shows the precise number of URLs with that PageRank score.
-
Axes: The X axis shows the PageRank score (from 1 to 10), while the Y axis shows the number of URLs corresponding to each score.
- Scrapy
- Crowl
- Igraph
- Streamlit
- streamlit_echarts
- pymysql
- twisted
- adbapi
- streamlit_apexjs
- Clone repository
git clone https://github.com/drogbadvc/crawlit.git- Navigate to the project directory
cd your_project_name- Install dependencies
pip install -r requirements.txt- Execution
streamlit run graph-streamlit.py- Streamlit Interface: Go to http://localhost:8501 in your browser after launching Streamlit.
- Web Crawler: Please see the Scrapy documentation for more details on running and configuring spiders.
