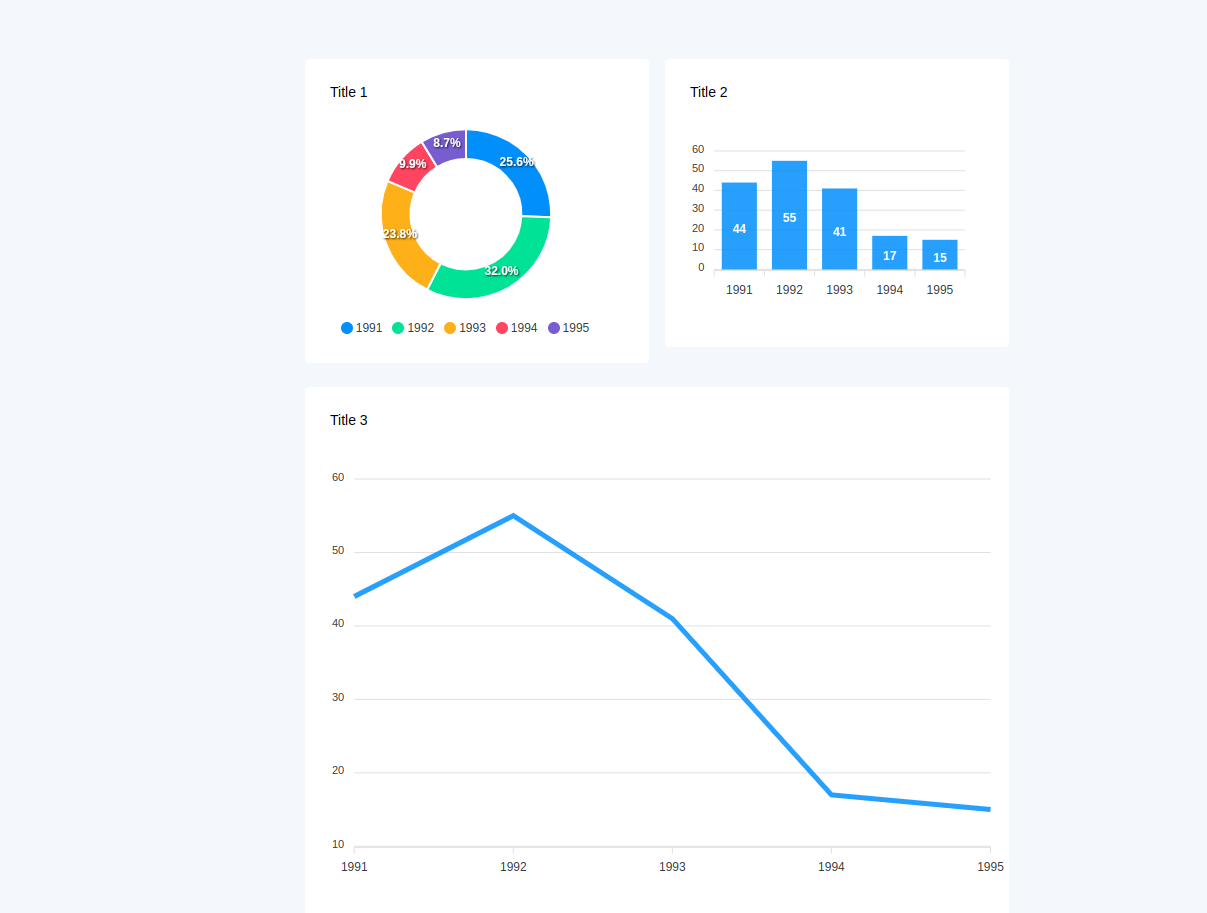
A Streamlit simple component to display ApexChart.
pip install streamlit_apexjsfrom streamlit_apexjs import st_apexcharts
options = {
"chart": {
"toolbar": {
"show": False
}
},
"labels": [1991, 1992, 1993, 1994, 1995]
,
"legend": {
"show": True,
"position": "bottom",
}
}
series = [44, 55, 41, 17, 15]
st_apexcharts(options, series, 'donut', '600', 'title')st_apexcharts(
options: Dict
series: List
type: str
width: str, number
title: str
)
Thank you for inspiration :) andfanilo.
