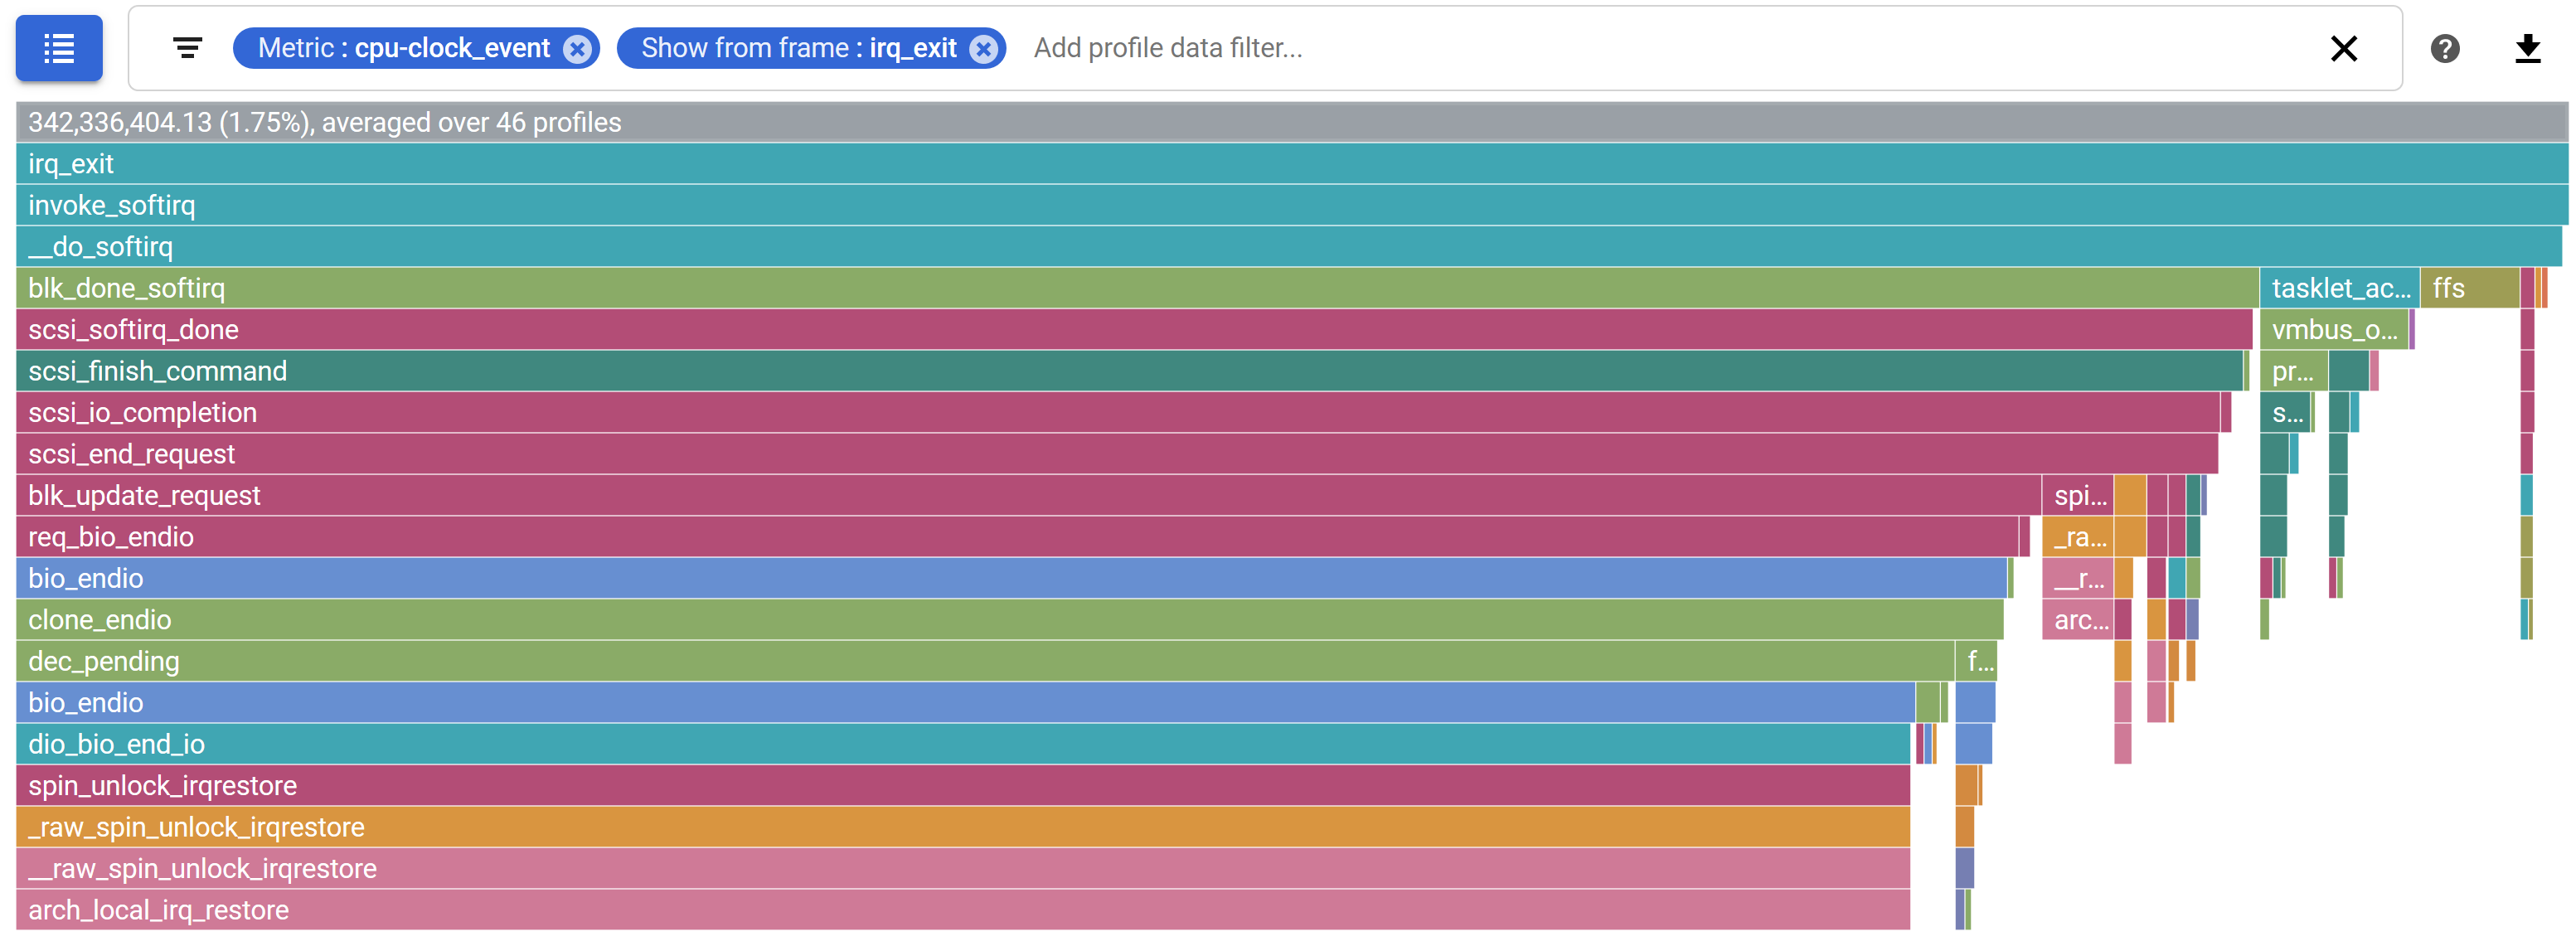
This is a proof-of-concept agent for the Cloud
Profiler that makes tunable
perf_events profiles available
in the Google Cloud console. It is a wrapper for the perf record
command that converts its output to the format expected by the cloud
profiler and uploads it using the credentials provided via command line.
The Cloud Profiler UI can then be used to view flame graphs.
The cloud-profiler-perf-record command runs forever, collecting
profiles at the cadence established by the Cloud Profiler service.
Once they are uploaded, the profiles can be viewed as call graphs or flame graphs or any other visualization supported by the product.
BUILD
bazel build :cloud-profiler-perf-record
The command requires the pprof and perf_to_profile commands to be in its $PATH.
To create useful traces, the agent requires debug symbols. The agent
attempts to use the perf buildid-list command to discover symbols
automatically.
On debian/ubuntu, ensure you have the relevant -dbgsym packages
installed for the applications you want to monitor.
RUN
cloud-profiler-perf-record is configured to run using service account
credentials. It us run like so:
cloud-profiler-perf-record \
	--credentials path/to/credentials.json \
	--project my-project-id \
	--service my-service-name
If --service will be the name of the service in cloud profiler. Agents
using the same service name will get profile requests at a reduced rate
proportional to the number of agents. If --service is not provided,
the instance's hostname is used.
USING A CUSTOM PERF COMMAND
By default, the following perf command is run to obtain a system-wide profile:
perf record -F 99 -ag -- sleep '{{ .Duration.Seconds }}'
where '{{ .Duration.Seconds }}' is replaced by a duration provided by
the cloud profiler API, typically 10 seconds. The command acts as a
drop-in replacement for perf record, so any additional arguments can
be passed to customize the profile.
cloud-profiler-perf-record -- -p $(pidof mysqld)
The only restrictions on the perf command is that it must write its output
to perf.data in the current directory.
