Z-Wave Embedded Trace Module (ETM) debugging example code
The ETM is an invaluable tool for debugging embedded code and measuring code coverage in real-time. More details on ETM can be found on the ARM and Segger web sites.
The example code here is provided AS-IS and without warrantee.
- Z-Wave Developers Kit - WSTK and a Radio board
- Or your board assuming it has the JTrace pins
- Segger J-Trace Pro
- The Cortex-M model is sufficient for Z-Wave debug (the cheaper one)
- Cables and power source
- J-Trace 20 pin connector pinout:
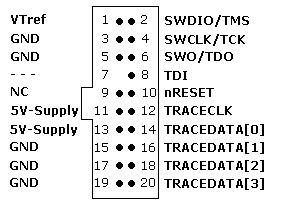
- 0.05" (1.27mm) spacing
- Connect the DUT to the J-Trace and ensure the Target Power is green
- Note that the 20 pin debug cable should be as short as possible - ideally just 2-3"
- If you get LTRACE invalid frame errors on the trace, the signal quality across the ribbon cable is probably not good.
- Try lowering the clock speed, adjusting the timing in JTrace and that all ground pins are connected.

- See the Adapter folder for the J-Trace to MiniSimplicity adapter.
- Simplicity Studio (for building the code)
- Segger Ozone (supports ETM trace)
- SVD files for the respective EFR32 - see the SVD folder
- This repo contains JLink scripts and other files needed for tracing
- Clone this repo into your Z-Wave project
- Build the project in SSv5
- Open Ozone
- Click on the New Project wizard and select the .AXF file for the project. Ozone will find the source code files via the .axf file.
- Click on File->Edit Project file (opens the .jdebug file)
- Add the following lines to the end of the OnProjectLoad section
- Project.SetOSPlugin("FreeRTOSPlugin_ARM");
- For xG13 projects:
- Project.AddSvdFile ("$(ProjectDir)/etm_zwave/svd/EFR32XG13XFULL.svd");
- For xG14 projects:
- Project.AddSvdFile ("$(ProjectDir)/etm_zwave/svd/EFR32XG14XFULL.svd");
- For xG23 projects:
- Project.AddSvdFile ("$(ProjectDir)/etm_zwave/svd/EFR32XG23A000F512GM40_SEQ_M33.svd");
- For modules (ZGM130,ZGM230), just use the base-SoC part which has the same internal registers which is what the .SVD defines
- Scroll down to the BeforeTargetConnect section
- uncomment the call and the }
- Add ONE of the following lines that matches your Z-Wave chip :
- Project.SetJLinkScript("$(ProjectDir)/etm_zwave/ZGM130S_Traceconfig.JLinkScript");
- Project.SetJLinkScript("$(ProjectDir)/etm_zwave/ZG23_Traceconfig.JLinkScript");
- Enable Tracing
- Tools->Trace Settings
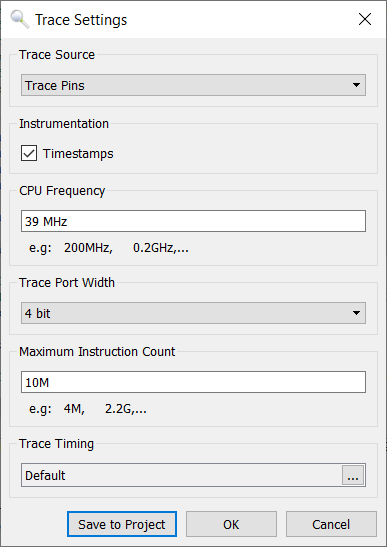
- Trace Source is Trace Pins
- CPU Frequency is 39MHz
- Trace Port Width is ideally 4 but if you have limited pinout, 2 or even 1 will work but will stall the CPU potentially altering the program flow
- Increase the Maximum Instruction Count to at least 100M
- Trace Timing should be default - the script alters the slew rate of the GPIOs which should be sufficient with a short cable
- Tools->Trace Settings
- Click on View -> Instruction Trace, Code Profile, Timeline and any other windows desired
- Click on Download and Reset Program
- Review the console window and look for any errors
- The DUT should stop at the beginning of Main() and there is data in the Timeline

- Do not use -flto optimization when debugging. Link Time Optimization (LTO) mashes the code making Ozone unable to match the PC with the C source code.
- Recommend installing Z-Wave DEBUG in the SLC - This will set the -Og optimzation option which will make the code much easier to trace and debug but requires more FLASH.
- In Simplicity Studio, click on the .slcp file for your project, then Software Components, then scroll down (or search) for Z-Wave Debug and click on it, then install it. Do NOT ship production code with Z-Wave Debug installed! Uninstall it for the final production release.
- May also want to install Z-Wave Debug Print and uncomment the #define DEBUGPRINT in app.c. This also requires IO Stream and a UART. This enables print statements to help with debugging. The print statements are sent out the uart and are visible on the SSv5 console window.
- Ozone will give all sorts of different errors that most often are caused by Signal Integrity issues
- LTRACE (Time since start: 0.139 656, Thread=ETM1): Unknown trace data packet detected
- No trace clock present, trace may not work correctly.
- LTRACE (Time since start: 0.074 546, Thread=ETM1): Trace overflow detected. Trace packets may have been lost.
- General flakeyness where restarting Ozone yields different errors or works sometimes but not all the time
- Signal Integrity of TRACECLK and TRACEDATA
- Use short cables (less than 6")
- Connect EVERY ground pin on the 20-pin header to the DUT if possible or add additional GND wires
- View the TRACECLK and TRACEDATA pins on a good scope with good grounds
- Adjust the slew rate of the EFR GPIO port to try to make the signals cleaner or sharper (See the .JLinkScript file for an example)
- Adjust the timing in the J-Trace - Ozone - Trace Settings - Trace Timing
- If the cable is short, the trace timing timing should not need to be adjusted as the EFR provides good setup/hold
- File an Issue to report a problem or make a suggestion.