Wrapper for hack into CMHC data
To discover table parameters, open CMHC data portal and set breakpoint on line 74 of asset TableMapChart.js. Then "export" table, type and inspect variable "model" in the console to read off the parameters.
##Usage
devtools::install_github("mountainmath/cmhc")
library(cmhc)
get_cmhc(...)
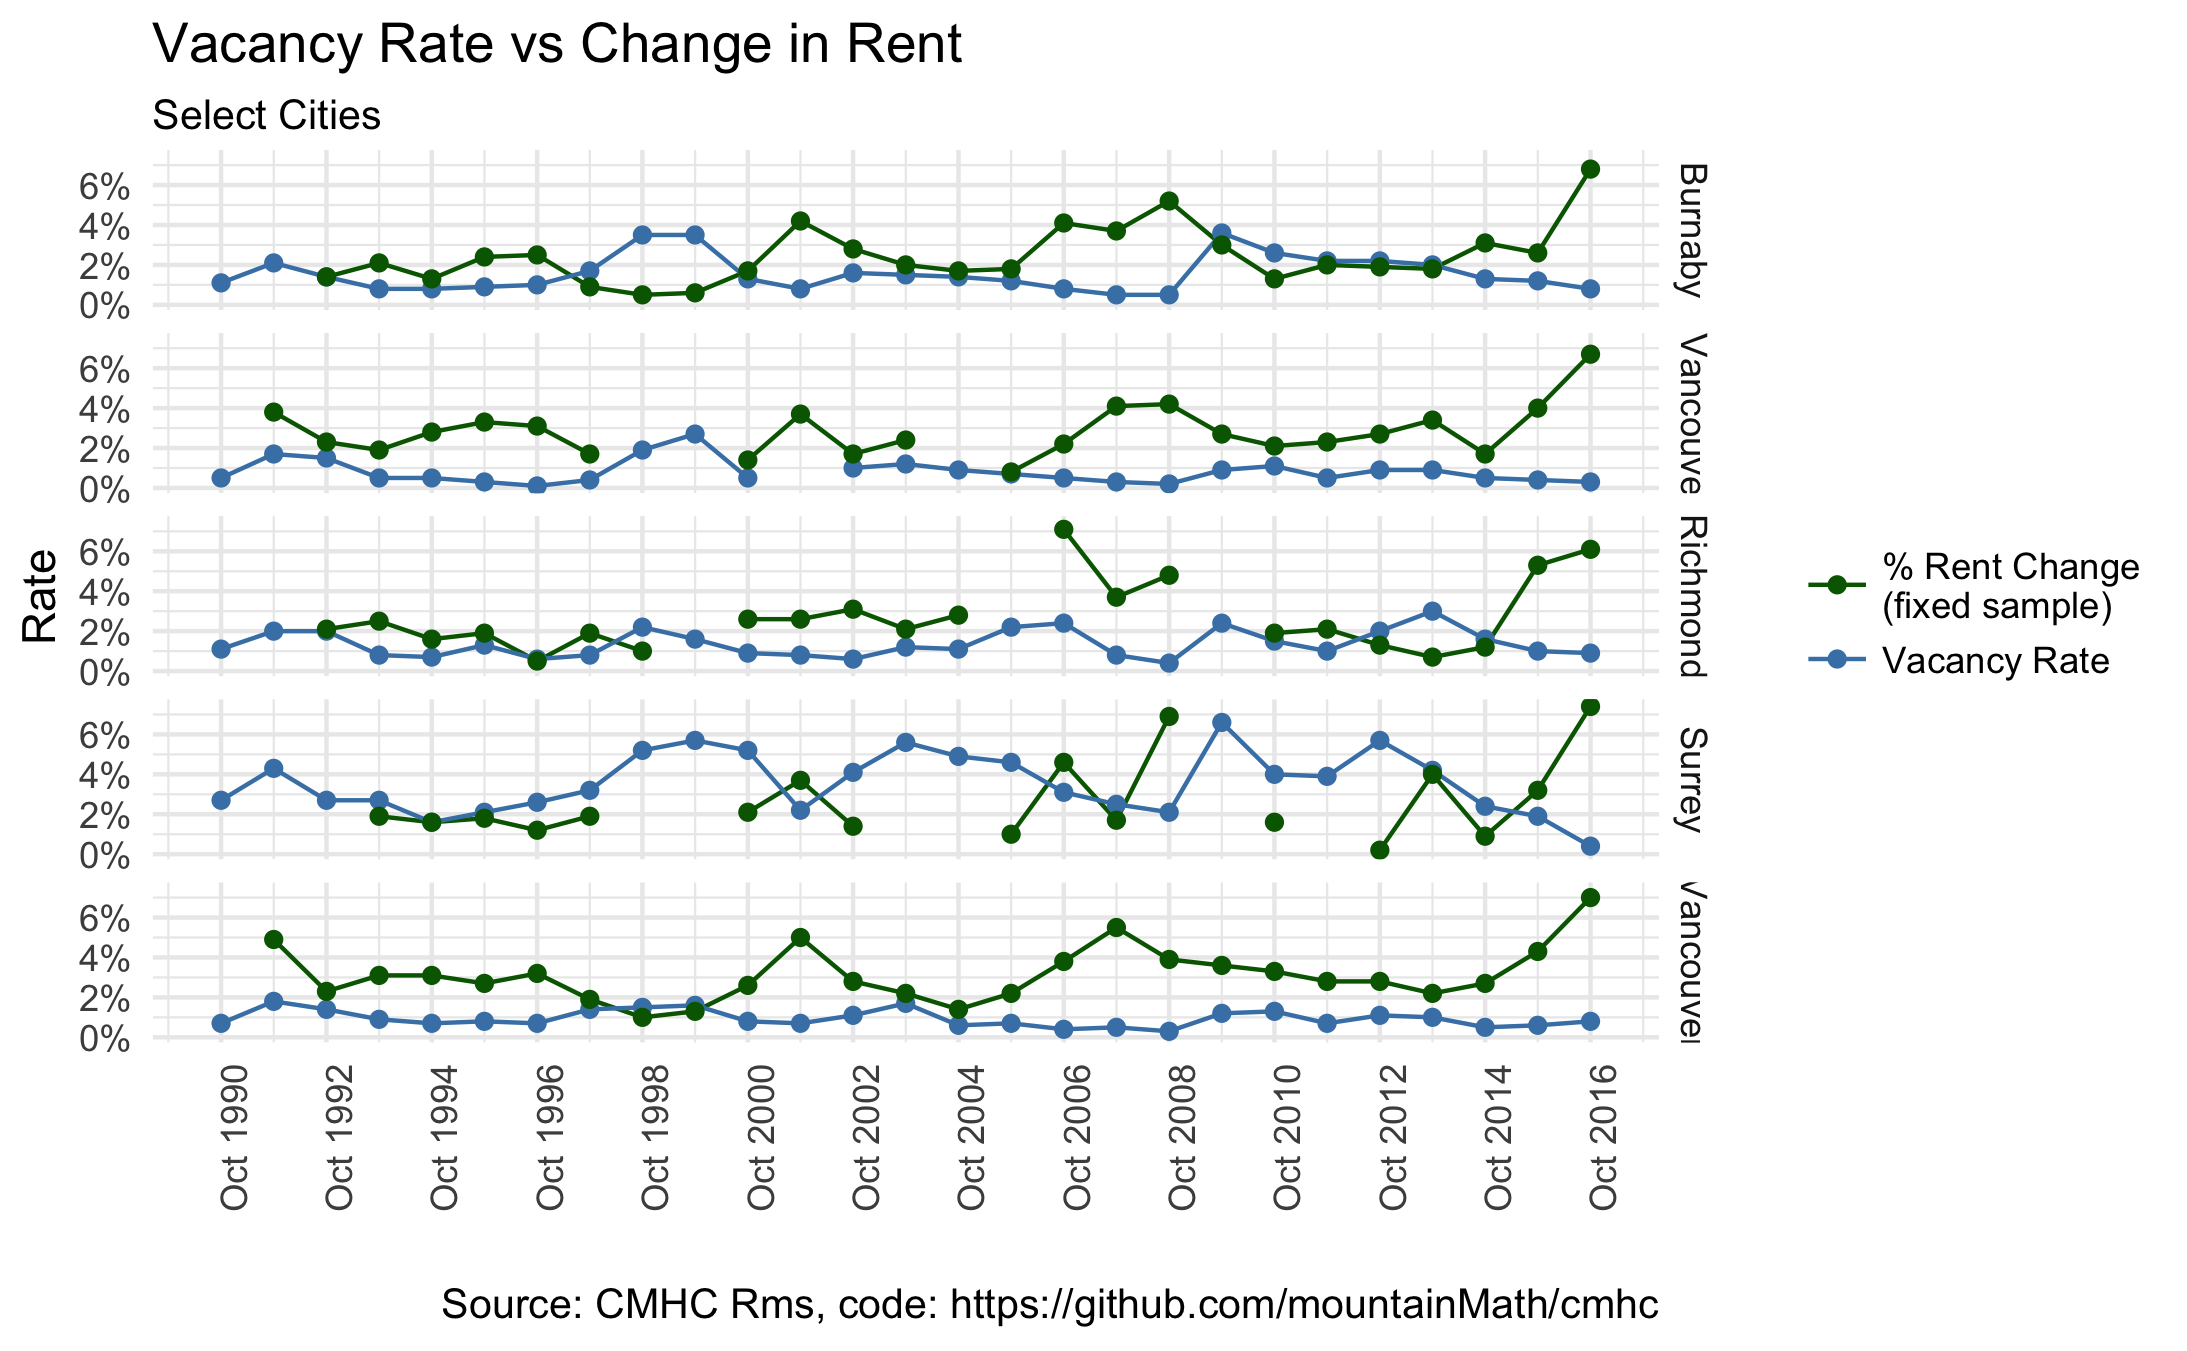
Check out the vignette plotting vacancy rate against fixed sample rent increases to see how this can be used.
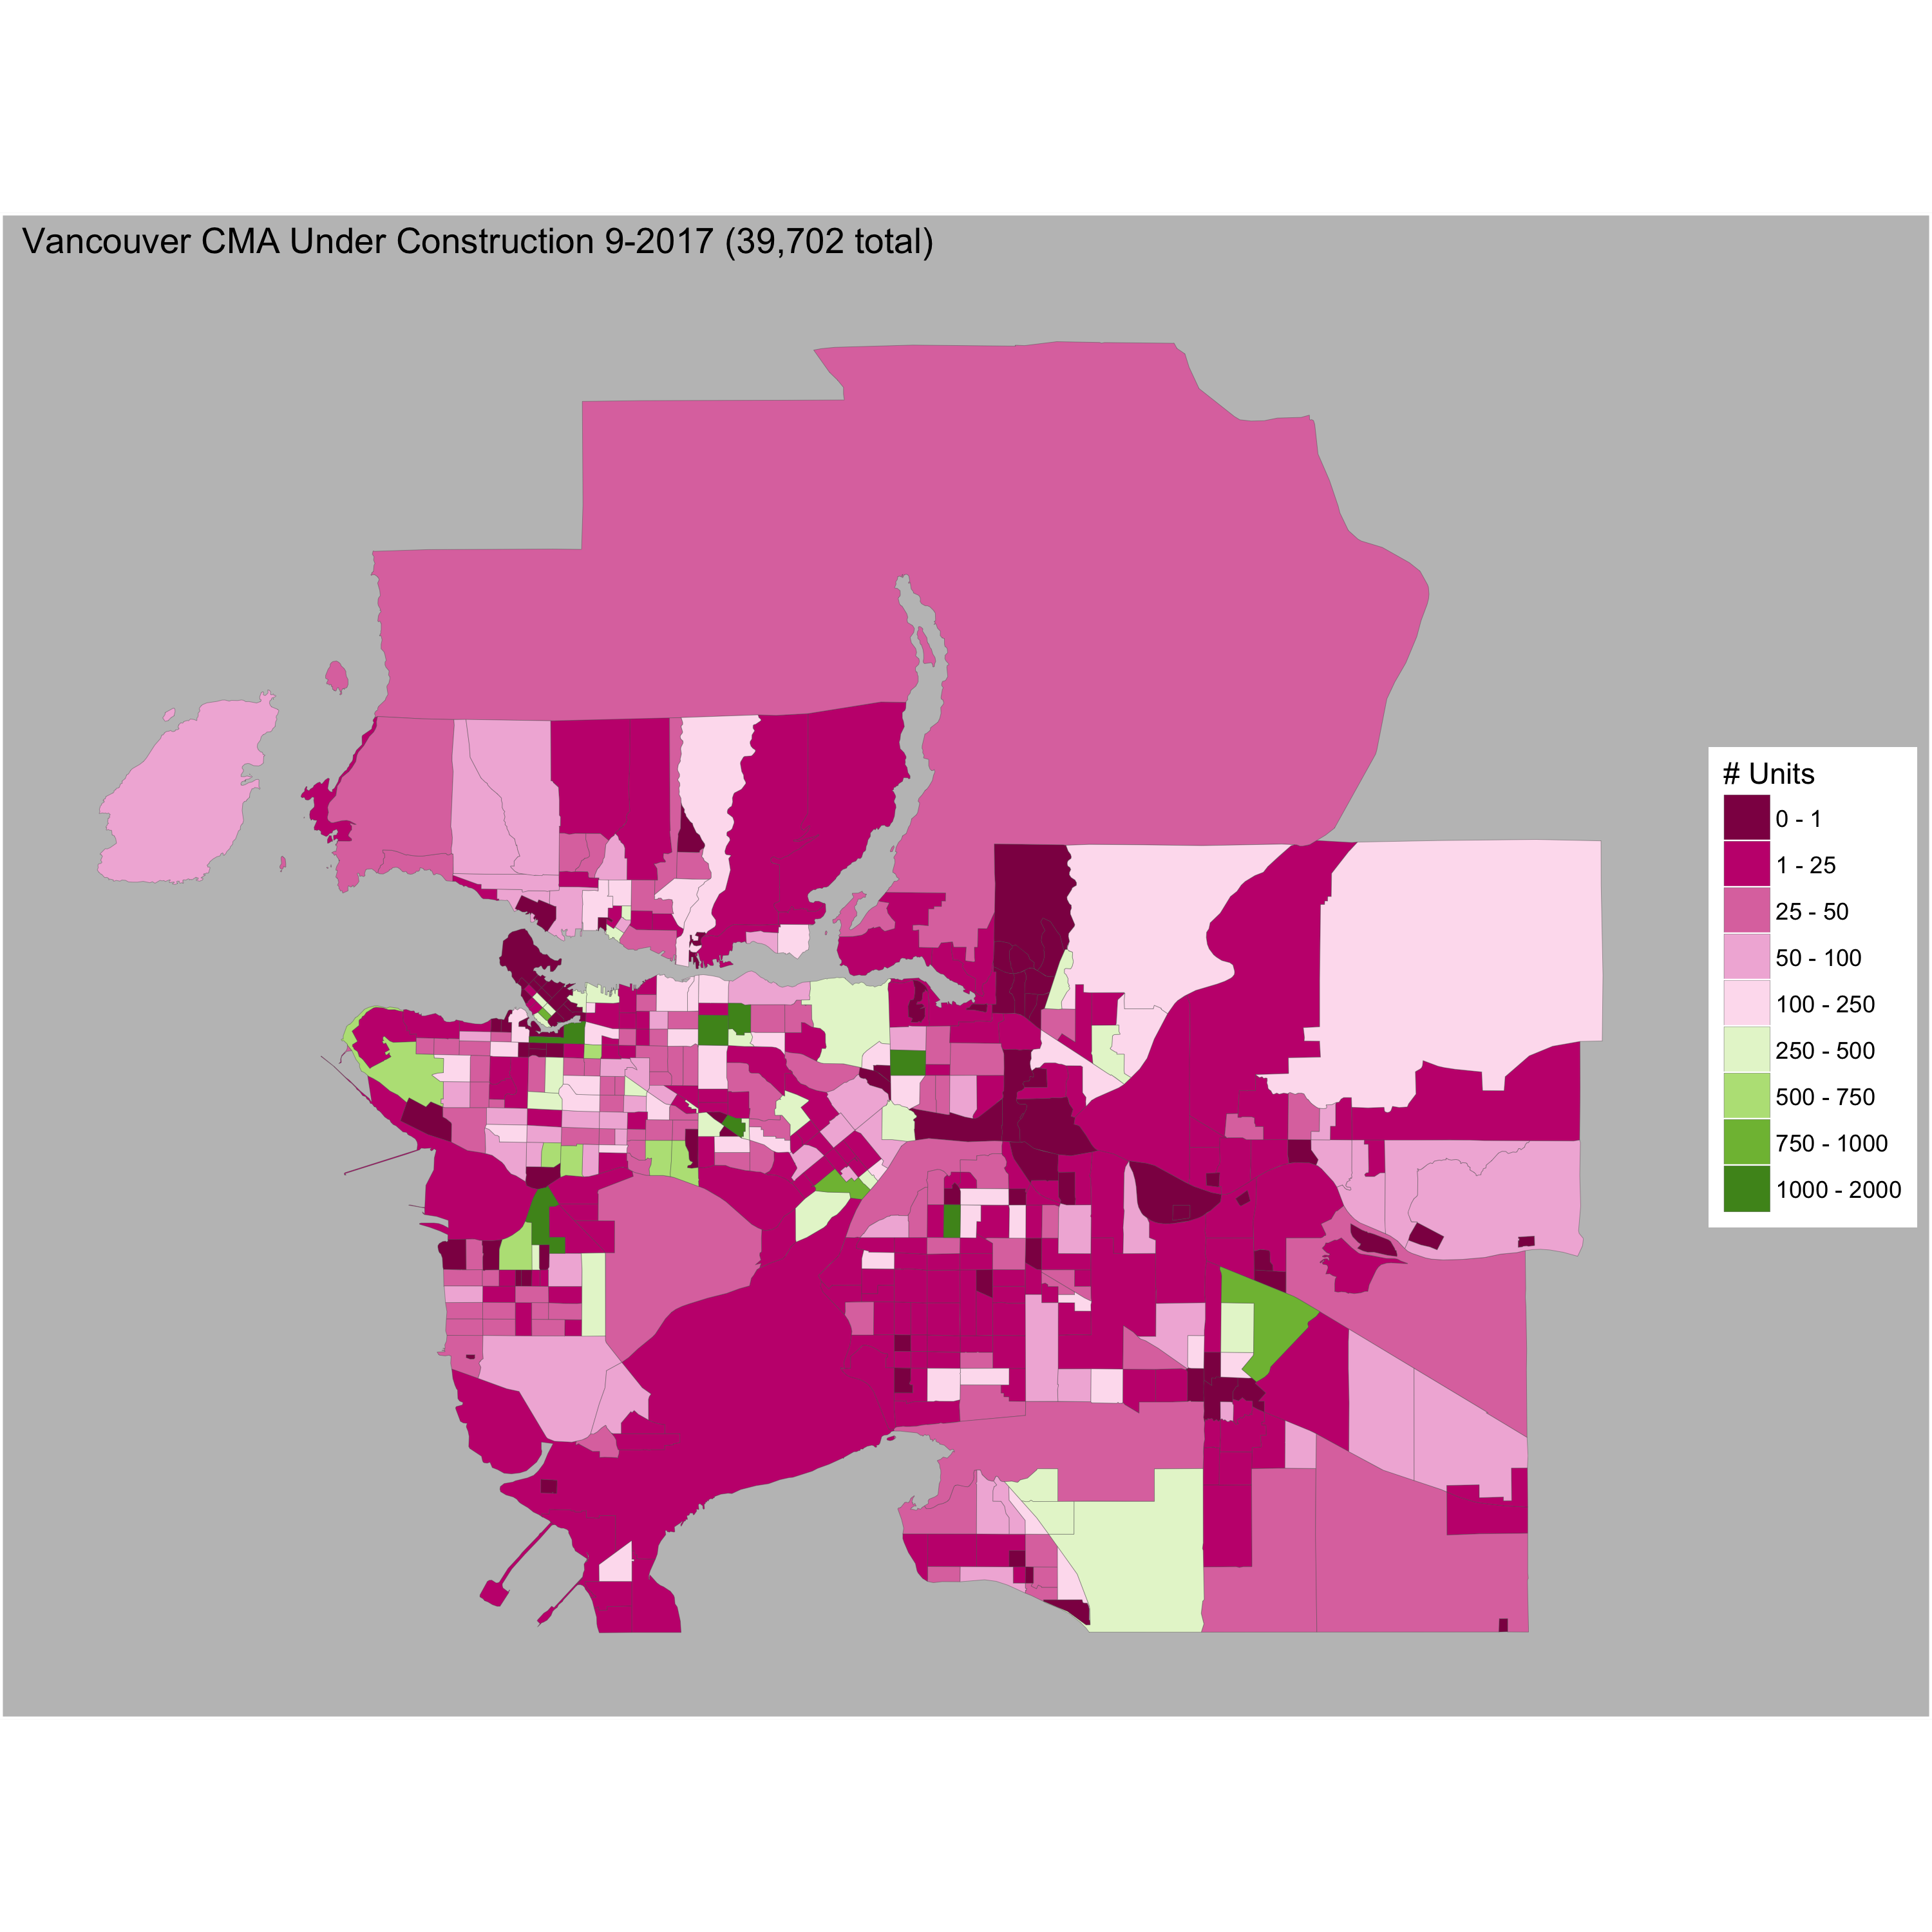
Or we can fold in census geographies (and census data) to map the current units under construction.
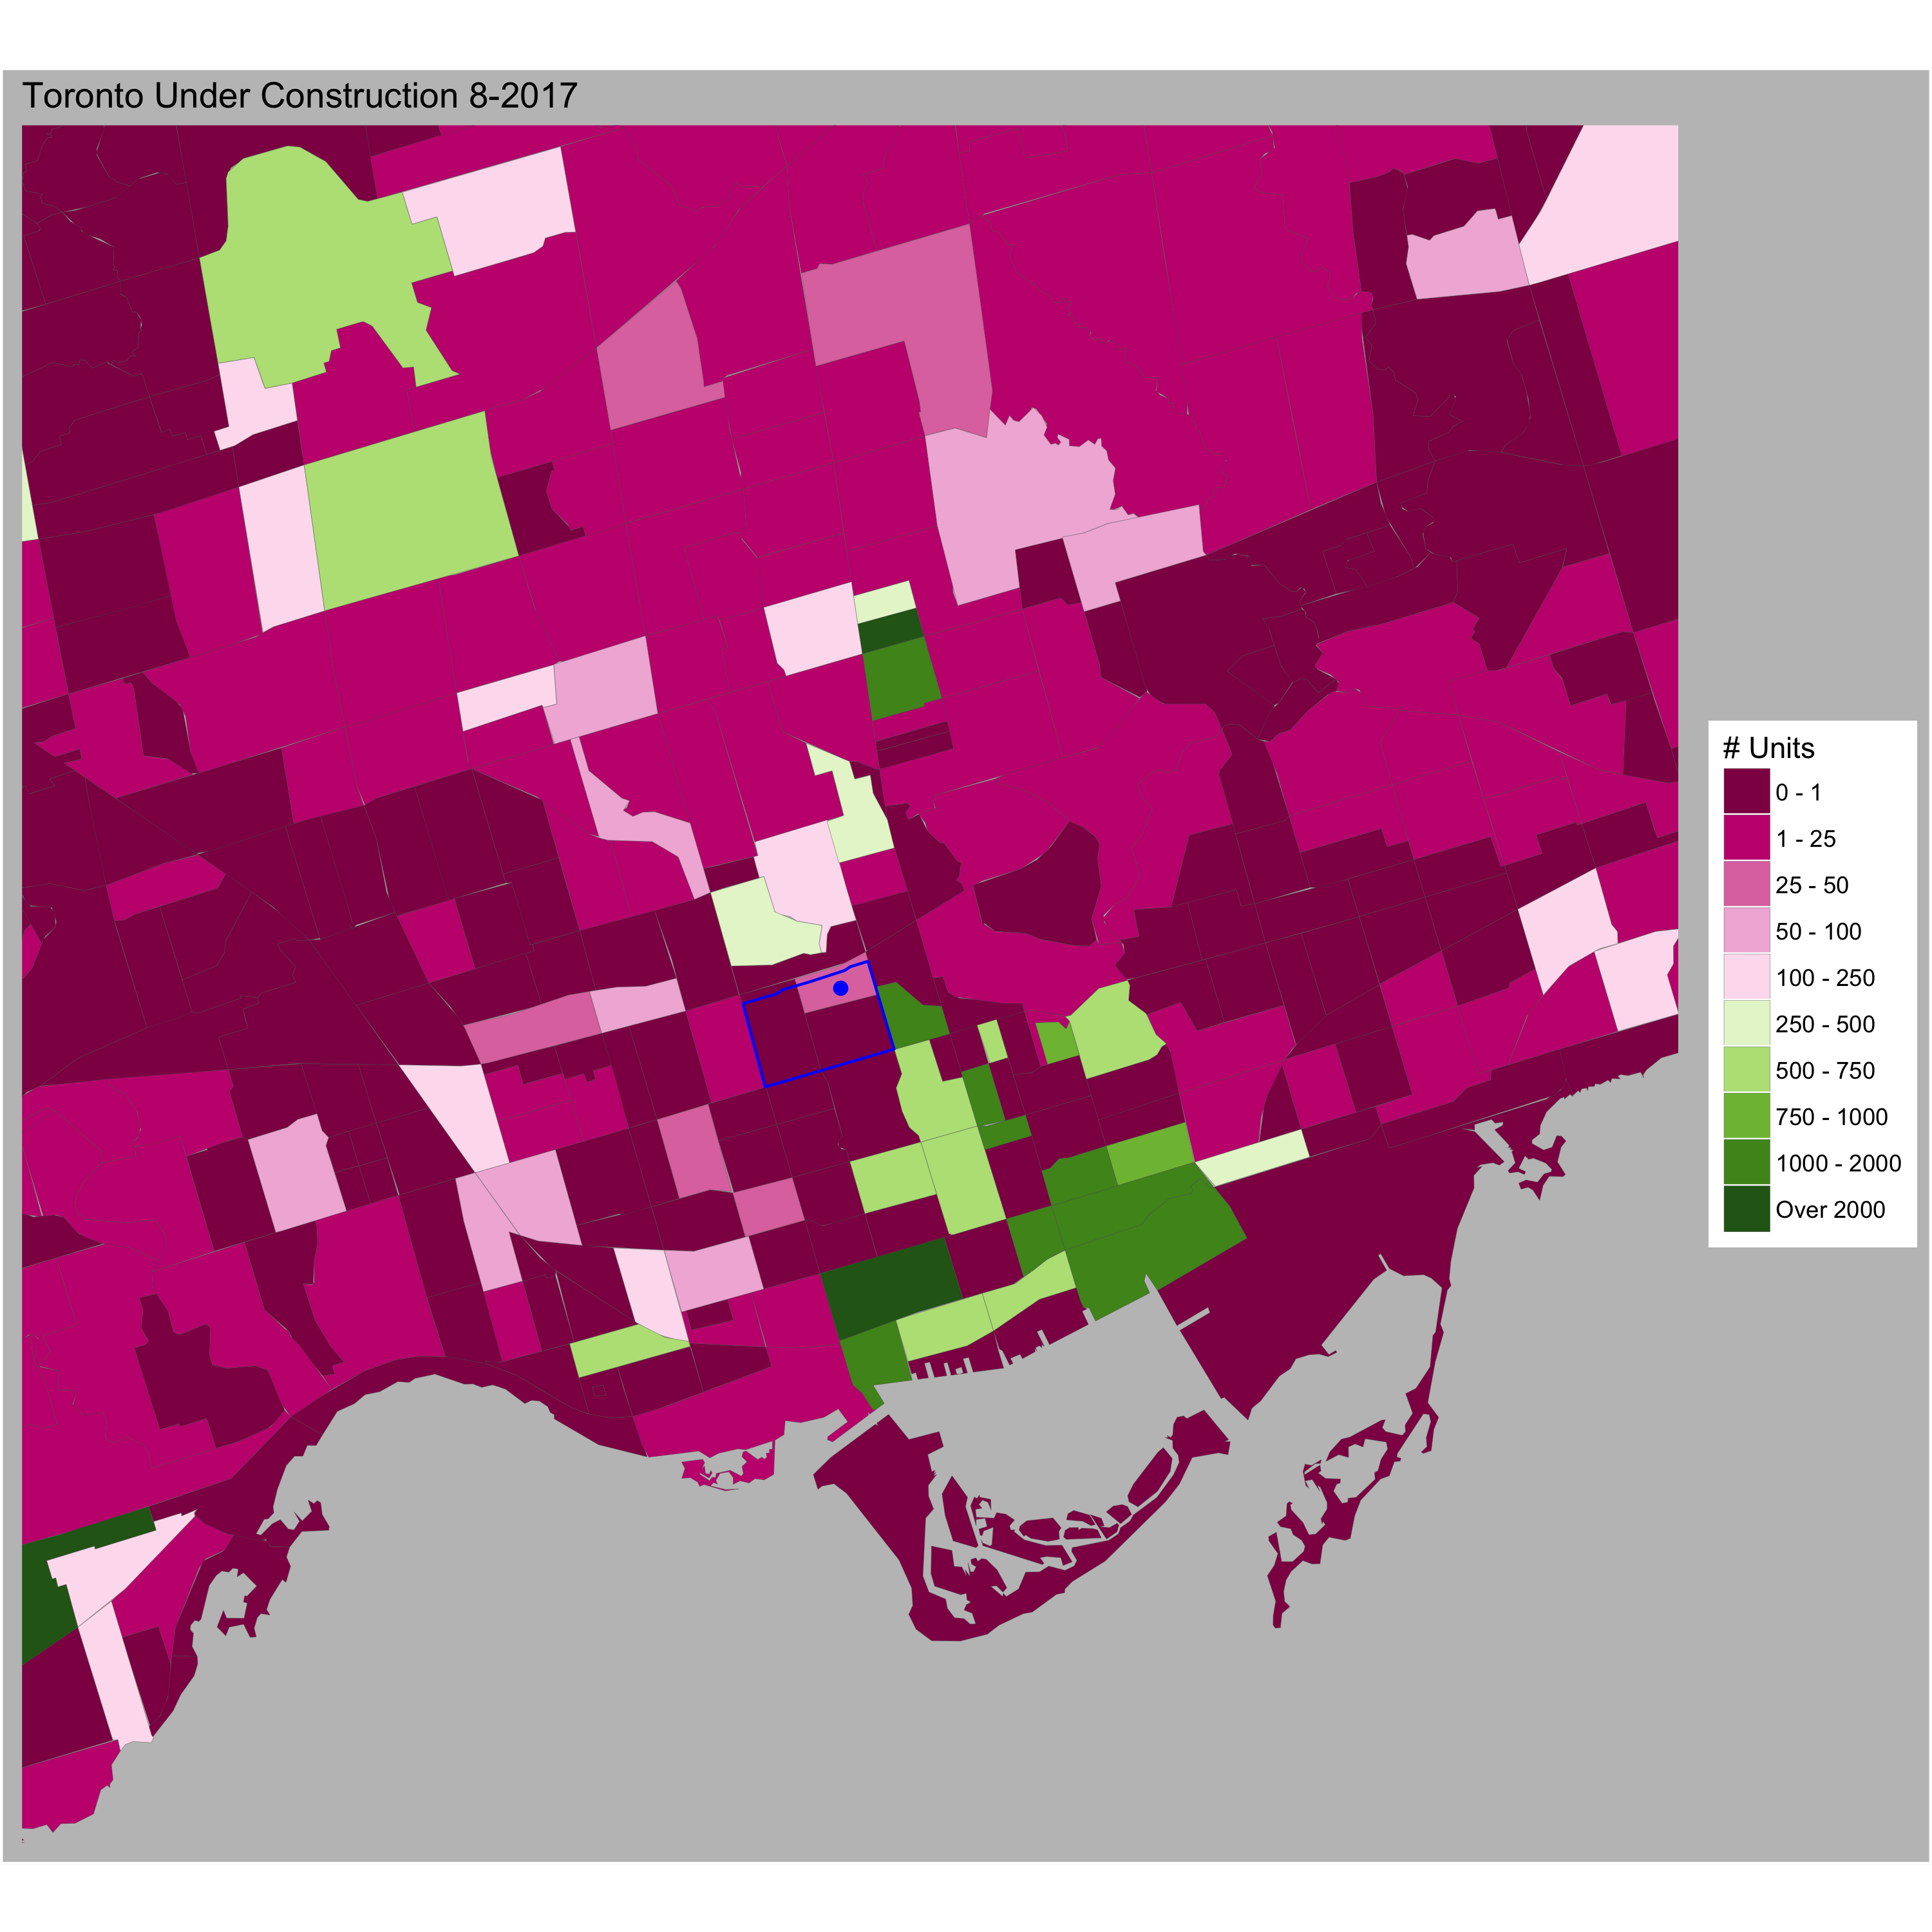
And since there is a lot of interest in development around the Annex neighbourhood, we can zoom in real quick and overlay the neighbourhood boundary.


