The focus of this project will be on Sentiment Analysi on music data(spotify).
Ensure you have R and RStudio installed on your computer. RStudio provides an integrated development environment (IDE) that makes coding in R easier. Or Posit Cloud
Data was extracted using a Token API using spotify access. For further replication on the use of an Spotify API.
For Posit Cloud :
Install R and RStudio. Use RStudio's IDE for ease of development.
Install required libraries with the command:
install.packages(c("tidyverse", "tidytext", "ggwordcloud", "ggtext", "showtext", "gt"))
Load the necessary libraries in R:
library(tidyverse)
library(tidytext)
library(ggwordcloud)
library(ggtext)
library(showtext)
library(gt)
- Choose your data source, focusing on the musical artist and songs for analysis.
- Load your data with
read_csv("path/to/your/data.csv"). - Clean your data to prepare it for analysis.
Tokenize the lyrics into individual words using tidytext::unnest_tokens() and filter out common stop words.
Choose a sentiment lexicon and match words to sentiments. Example:
bing_sentiments <- tidy_df %>%
  inner_join(get_sentiments("bing")) %>%
  count(word, sentiment, sort = TRUE)
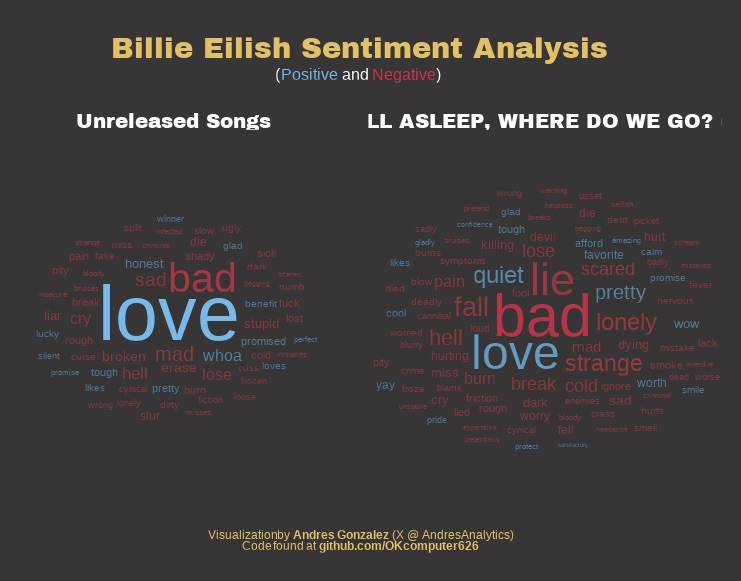
- Visualize common words with word clouds.
- Plot frequency of sentiments with ggplot2.
- Analyze results for trends in sentiment.
Compile your analysis into a report using Quattro or R markdown. Share on Github. Use as a project for resume.
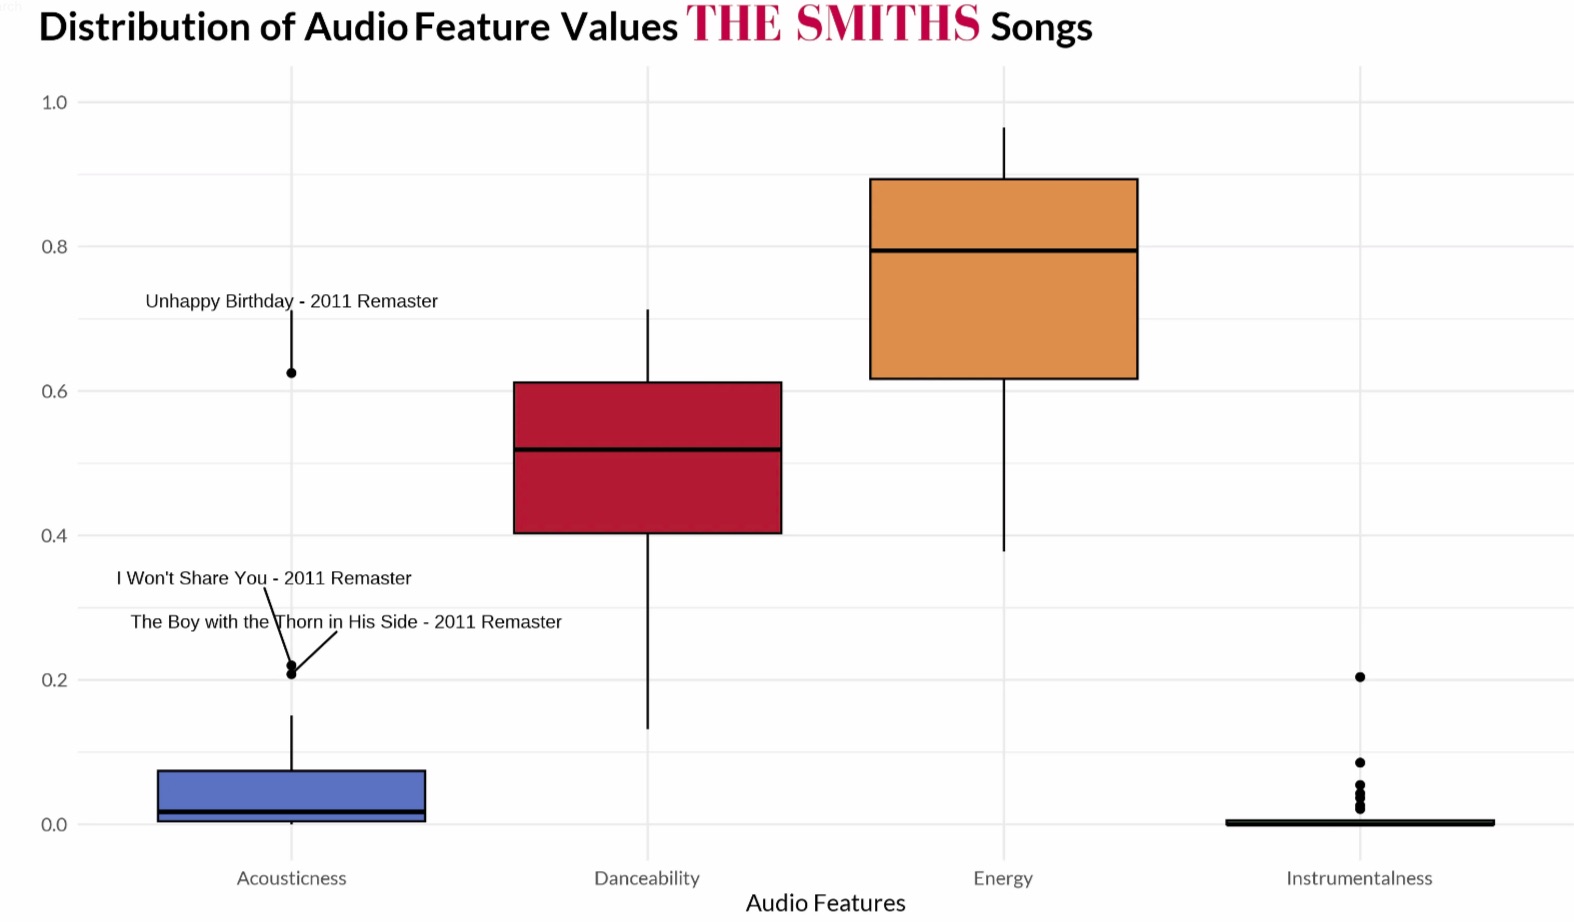
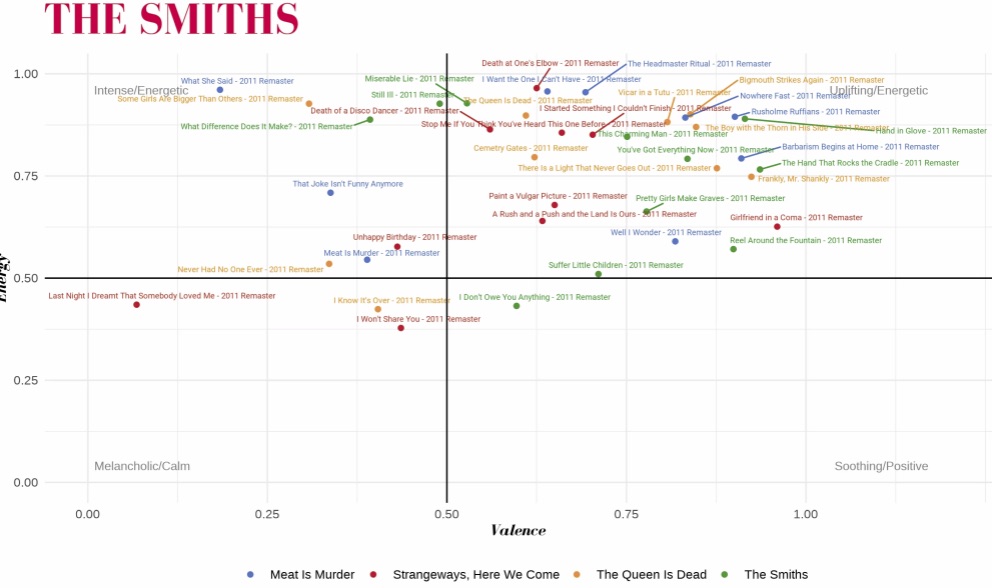
This project aims to inspire both students and data science enthusiasts to undertake their own projects, with the aspiration that through continued practice, they'll gain a deeper appreciation for the boundless creativity and narrative potential inherent in data and visualizations. For more insights and inspiration, consider exploring Andres's Medium post on the sentiment analysis of The Smiths, a quintessential English band that dominated the 80s: https://medium.com/@gonzalez_afc/sentiment-analysis-of-the-the-smiths-a-quintessential-english-band-that-ruled-the-80s-173266b1d697
THANK YOU!
