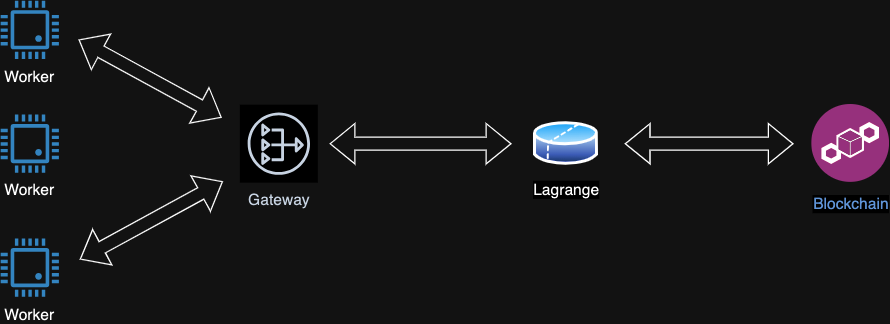
An AVS operator is expected to serve proving requests from Lagrange network by running a Worker binary. The Lagrange sequence sends through the Gateway tasks to workers containing all the necessary inputs to generate zkproofs. The worker continuously listens for such tasks and generate proofs accordingly.
This is a step by step guide to deploy your own worker.
If you prefer video content you can watch this video tutorial
There are 3 different types of workers. Every type can generate a specific type of proof. You can choose your infrastrcture depending on the type of proof you would like to be able to generate.
| Worker Type | Cores (Dedicated) | vCPU (Cloud) | Memory | Disk | Internet | Proposed Hetzner instance |
|---|---|---|---|---|---|---|
small |
8 | 20 | 40 GB | 60GB | ✅ | AX-52 |
medium |
8 | 40 | 80 GB | 60GB | ✅ | AX-52 |
large |
16 | 90 | 180 GB | 60GB | ✅ | AX-102 |
- Install
Dockerby following this guide - Clone this repo
git clone https://github.com/Lagrange-Labs/worker.git
cd workerIf you want to build from source check Build_from_source.md file in this repo, then come back to this step once done with that
- Generate a Lagrange key
#Generate the key
docker compose run --rm worker avs new-key
You should see something like this
Input password for Lagrange key:
new Lagrange keystore stored under config/lagr_keystore.json
public_key = "66779122cb188d1e70889278ffb3ee8ee024d4a23742a59afbdaaa096fc5135c3a14d897de87d1c56adbe029619c231416e7dfb3f1de0a542dd8ac7f4748ce07"- Add the Ethereum keystore under
config/priv_key.json. * This is the operator keystore generated by EigenLayer cli - Register the Lagrange key on-chain by signing it with the AVS operator key
docker compose run --rm worker avs register- You are now registered, you can go ahead and remove the keystore from
config/priv_key.json - Add the Lagrange password to the
.envfile so that the service can be restarted without any manual intervention.
# set the AVS__LAGR_PWD key with the password you have set
vim .env- Run the worker
docker compose up -dThe worker exposes the prometheus metrics by default on port 9090
Starting from worker version v0.2.1, you can import this grafana dashboard
