The vehicle routeing problem deals with determining the least cost plan for a fleet of vehicles to visit a number of locations. Due to the number of routeing plans possible this problem is comibinatorial in nature and a classic example of an operations research problem where heuristics are neccesary.
This repository contains an implemenation of and visualisation tools for solving the vehicle routeing problem using a simulated annealing heuristic. The data in this repository is in the context of a fleet of trucks delivering goods to a range of supermarkets around the wider Auckland area.
This solver and plotter require csv files containing: the coordinates of each delivery location, the travel time from each location to each other location, and the amount each location needs delivered. Example files included are 'FoodstuffLocations.csv', 'FoodstuffTravelTimes.csv', and 'OurDemand.csv', respectively.
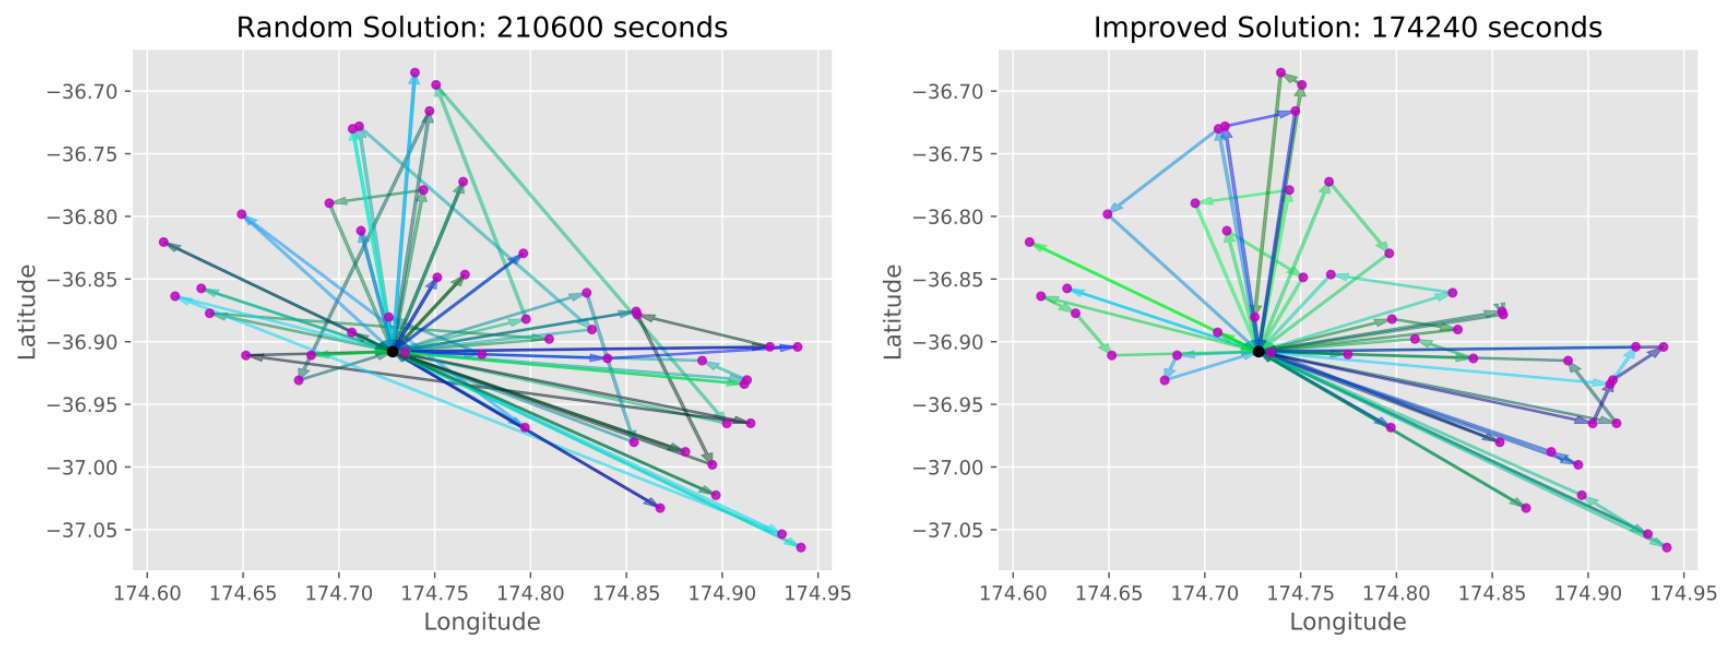
Here is an example of its application to the csv files included in this repository, obtained by running the VRPSimulatedAnnealing file:
Each contiguous arc of colored arrows reprsents a route taken by a vehcicle, and each node represents a location to visit. Note that the improved solution shows a distinct petalling pattern around the origin of each vehicle, indicative of a good solution with little crossover. In this example the objective for minimisation is the delivery time since drivers are paid hourly---seven delivery hours are saved after optimisation!)
Created by Dominic Keehan in 2019.
Geographical data exported from the OpenStreetMap API.
Bachelor of Engineering Science (Honours) course project at the University of Auckland.
