A resource cloud scanner that analyzes and reports about wasteful and unused resources to cut unwanted expenses. The tool is based on yaml definitions (no code), by default configuration OR given yaml file and the report output will be saved in a given storage. Currently we're not taking into account reservations, private pricing, etc. (WIP)
AWS:
- RDS
- EC2 (ELB, ALB, EBS)
- DynamoDB
- ElasticCache
- DocumentDB
- IAM user last activity
- Lambda
- Neptune
- Kinesis
- RedShift
More to come...
These instructions will get you a copy of the project up and running on your local machine for development and testing purposes. See deployment for notes on how to deploy the project on a live system.
Finala is built from 3 components:
-
API - RESTful API server that receives events from the collector and serves the UI. See example API configuration file.
-
UI - The User Interface, display the data in a way that it'll look nice :).
-
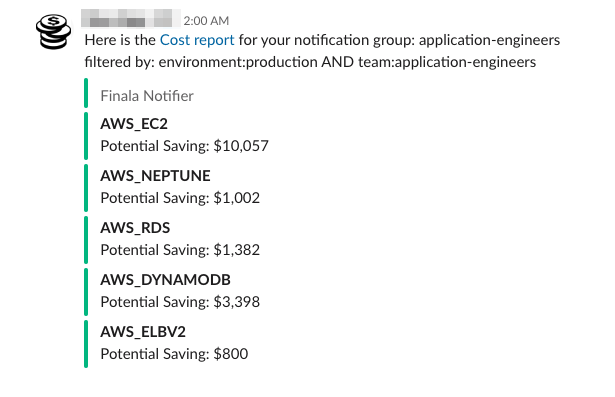
Notifier - Notifies notification groups with the support of multiple notifiers defined in notifier.yaml. All resources that marked as "under utilized" are reported to the notification groups. Currently we only support Slack notifier type notifier.yaml. If you wish to contribute and add a new Notifier please read How To add a new Notifier?
-
Collector - Collects and analyzes resources against their thresholds defined in collector.yaml. All resources that marked as "under utilized" are reported back to the API component. You can define multiple accounts and regions in the collector.yaml file.
providers:
  aws:
  - name: <ACCOUNT_NAME>
    # Environment variables will be used in case if these variables are absent
    access_key: <ACCESS_KEY>
    secret_key: <SECRET_KEY>
    session_token: "" # Optional variable, on default this variable not set
    regions:
      - <REGION>
We've already provided list of built-in cost-optimization metrics, you may modify the file to suit your needs.
rds:
    - description: Database connection count
        metrics:
        - name: DatabaseConnections
            statistic: Sum
        period: 24h
        start_time: 168h # 24(h) * 7(d) = 168h
        constraint:
        operator: "=="
        value: 0
This example will mark RDS as under utilized` if that RDS had zero connections in the last week.
You may use either approach in order to deploy Finala.
- Deploy with Kubernetes, see Helm chart for more information.
- Run it locally with
docker-compose up.
Running the different components:
go run main.go collector -c ./configuration/collector.yamlgo run main.go notifier -c ./configuration/notifier.yamlgo run main.go api -c ./configuration/api.yamlcd ui
npm run devOR
make build-ui
go run main.go ui -c ./configuration/ui.yamlRunning all components using docker-compose:
docker-compose up
UI is exposed on port 8080 (quick link).
The full working example can be found in collector.yaml.
- Find EC2 instances has less that 5% CPU usage in the last week.
ec2:
    - description: EC2 CPU utilization
        metrics:
        - name: CPUUtilization
            statistic: Maximum
        period: 24h
        start_time: 168h # 24h * 7d
        constraint:
        operator: "<"
value: 5- Find RDS DB's that had zero connections in the last week.
rds:
    - description: Database connection count
        metrics:
        ### Start: Cloudwatch metrics ###
        - name: DatabaseConnections
            statistic: Sum
        period: 24h
        start_time: 168h # 24h * 7d
        ### End: Cloudwatch metrics ###
        constraint:
        operator: "=="
value: 0- Find ELB's that had zero traffic (requests) in the last week.
elb:
    - description: Loadbalancer requests count
        ### Start: Cloudwatch metrics ###
        metrics:
        - name: RequestCount
            statistic: Sum
        period: 24h
        start_time: 168h # 24h * 7d
        ### End: Cloudwatch metrics ###
        constraint:
        operator: "=="
value: 0 - Find Application ELB's that had zero traffic (requests) in the last week.
      elbv2:
        - description: Application Loadbalancer RequestCount
          metrics:
            - name: RequestCount
              statistic: Sum
          period: 24h
          start_time: 168h # 24h * 7d
          constraint:
            operator: "=="
value: 0 - Find a difference of more than 10% between DynamoDB Provisioned RCUs to Consumed RCUs.
dynamodb:
    - description: Provisioned read capacity units
        ### Start: Cloudwatch metrics ###
        metrics:
        - name: ConsumedReadCapacityUnits
            statistic: Sum
        - name: ProvisionedReadCapacityUnits
            statistic: Sum
        period: 24h
        start_time: 168h # 24h * 7d
        ### End: Cloudwatch metrics ###
        constraint:
        formula: ConsumedReadCapacityUnits / ProvisionedReadCapacityUnits * 100 # specify any formula
        operator: "<"
value: 10$ make test
$ make test-html
To release a new version run the command:
$ make releaseAll pull requests and issues are more then welcome! Please see Contribution guidelines.


