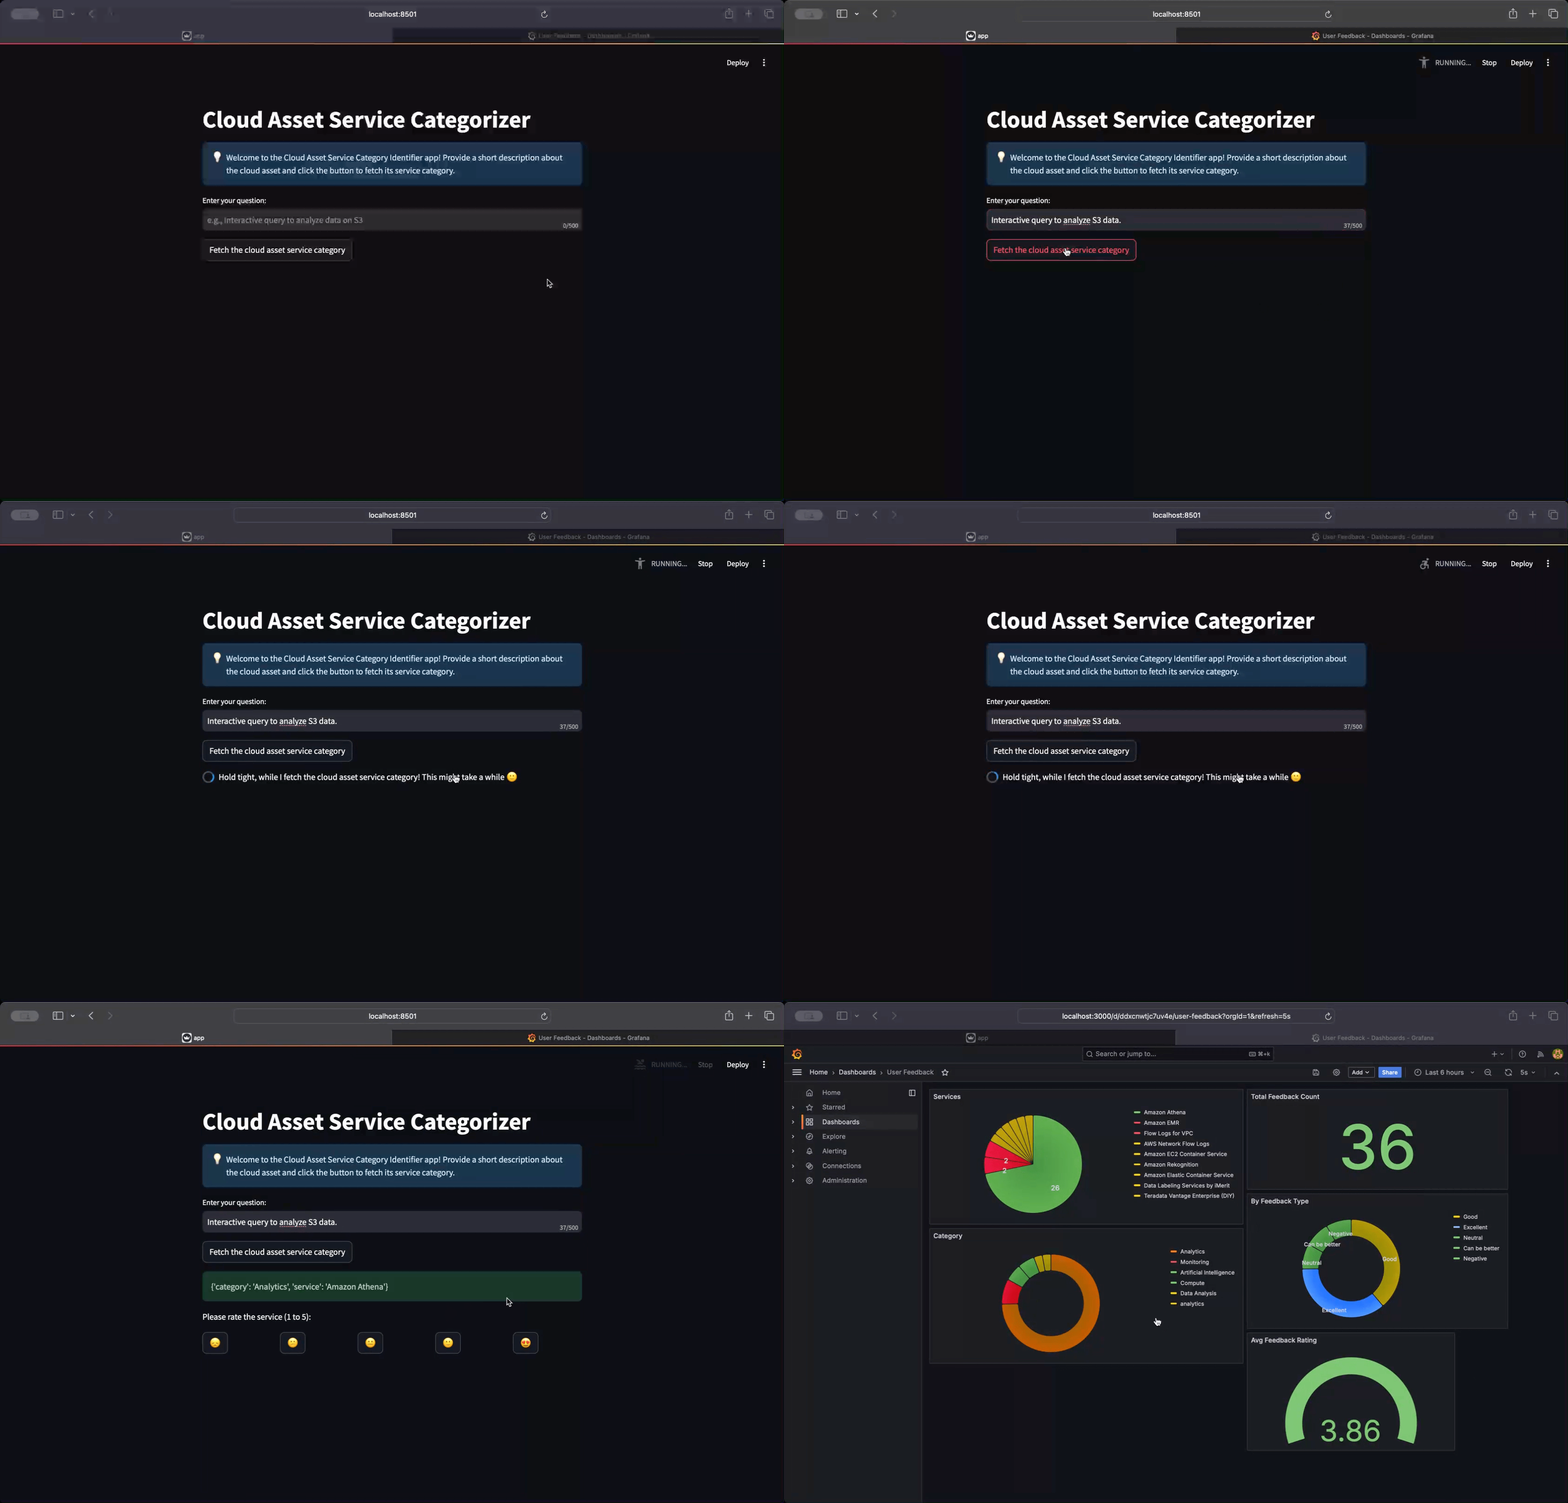
A Retrieval-Augmented Generation (RAG) application designed to predict the category of cloud assets. This project integrates AI-based techniques to assist in finding relevant cloud asset service categories based on user queries.
You can access the deployed version of the app here.
Note: Providing User feedback & Monitoring dashboard is available only for the locally deployed version of app.
-
Predicts cloud asset service categories.
-
Utilizes RAG architecture with LanceDB (for Vector Search) and ElasticSearch.
-
Added support to use Open Source models locally using Ollama.
-
Monitoring support to view dashboards.
Cloud Asset Service Categorization is the process of systematically classifying cloud resources and services into predefined categories. These categories can include:
-
Compute resources (e.g., virtual machines, containers)
-
Storage services (e.g., object storage, block storage)
-
Networking components (e.g., load balancers, VPNs)
-
Database services
-
Security and identity management tools
-
Analytics and big data services
-
Developer tools and services
-
AI and machine learning platforms
This categorization plays a crucial role in managing, optimizing, and securing cloud environments, particularly as businesses continue to migrate more of their operations to the cloud.
Created a fictional businees usecase to explain the need of Cloud Asset Service Categorization.
Refer this document to check the business proposition.
The project is developed on a machine with these specs
-
Docker
-
Docker Compose
-
Python 3.9+
To set up this project locally, follow these steps:
- Clone the repository:
git clone https://github.com/dusisarathchandra/llm-RAG-cloud-asset-service-categorization.git

cd llm-RAG-cloud-asset-service-categorization
- Set up a virtual environment (recommended):
python -m venv env

source env/bin/activate
- On windows
source env\Scripts\activate
- Install the required dependencies:
pip install -r requirements.txt
- Follow this link to install
docker-compose
-
Make sure that you've access to run
docker-compose -
Open a terminal and run the following
docker-compose up --build
Ensure Docker Desktop is installed. Open a terminal and run:
docker-compose up --build
- Don't close the terminal
If you're using Docker Desktop, open it and make sure all the below containers are up and running.
-
grafana
-
postgres
-
elastic-search
-
Ollama
- Command line (lists all the docker containers)
Open another terminal and execute the below command.
docker ps -a | grep ollama
- Copy the Ollama docker container id
Note: Data is already ingested beforehand, if you want to manually ingest the data again, run the following command in a terminal with your virtual environment activated.
- Below command will start creating the embeddings and pushing the vectors to LanceDB.
python ingestion.py
- Exec into Ollama docker container to pull the required model.
Note: As part of this project, I have used
gemma2:2b. We try to pull the same using Ollama.
- More about gemma2:2b
docker exec -it <Ollama-Container-ID> bash
ollama pull gemma2:2b
- Confirm successfull pull of the model by running command
ollama list(must listgemma2:2bmodel)
Once you're sure the setup is done. Visit the project base folder:
cd <path-to-cloned-project-folder>
Run
streamlit run app.py
-
On your favorite browser visit http://localhost:8501.
-
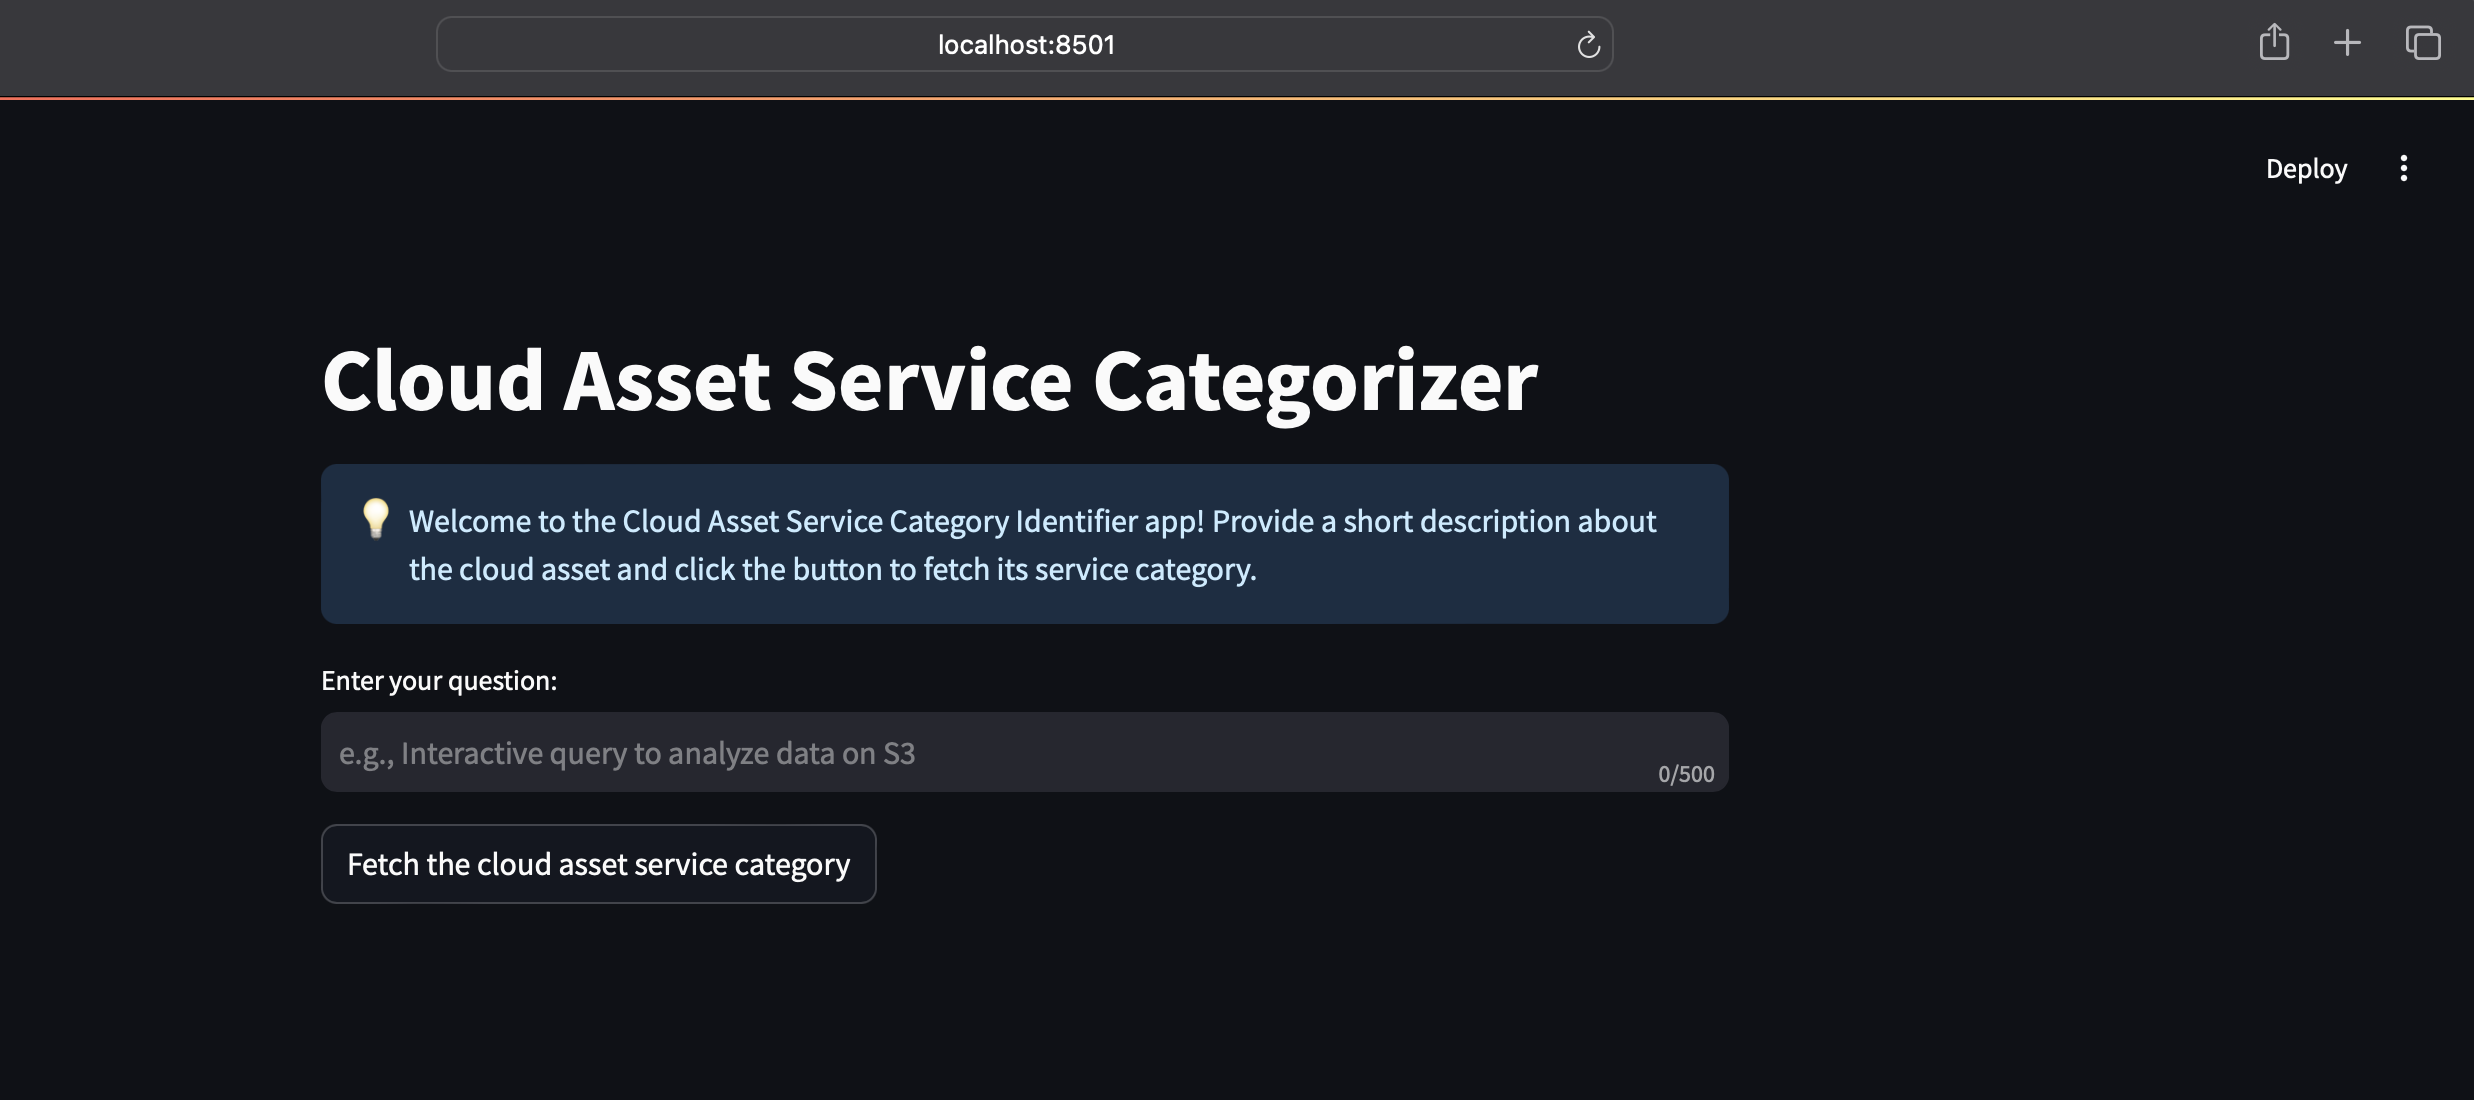
Upon visiting the page, you should see below screen.
Note: If more than one model is running in Ollama container, the UI might through an error, either make sure you have more memory to hold all the docker containers or test with one model.
Note: Seen issue while accessing Grafana dashboard on Chrome. Please try different browsers if you get
Unauthorziederror.
-
On your favorite browser visit http://localhost:3000
-
Upon visiting the page, if you're asked to enter credentials, it's defaulted to below ones:
username: admin

password: admin
Give a new password also as admin
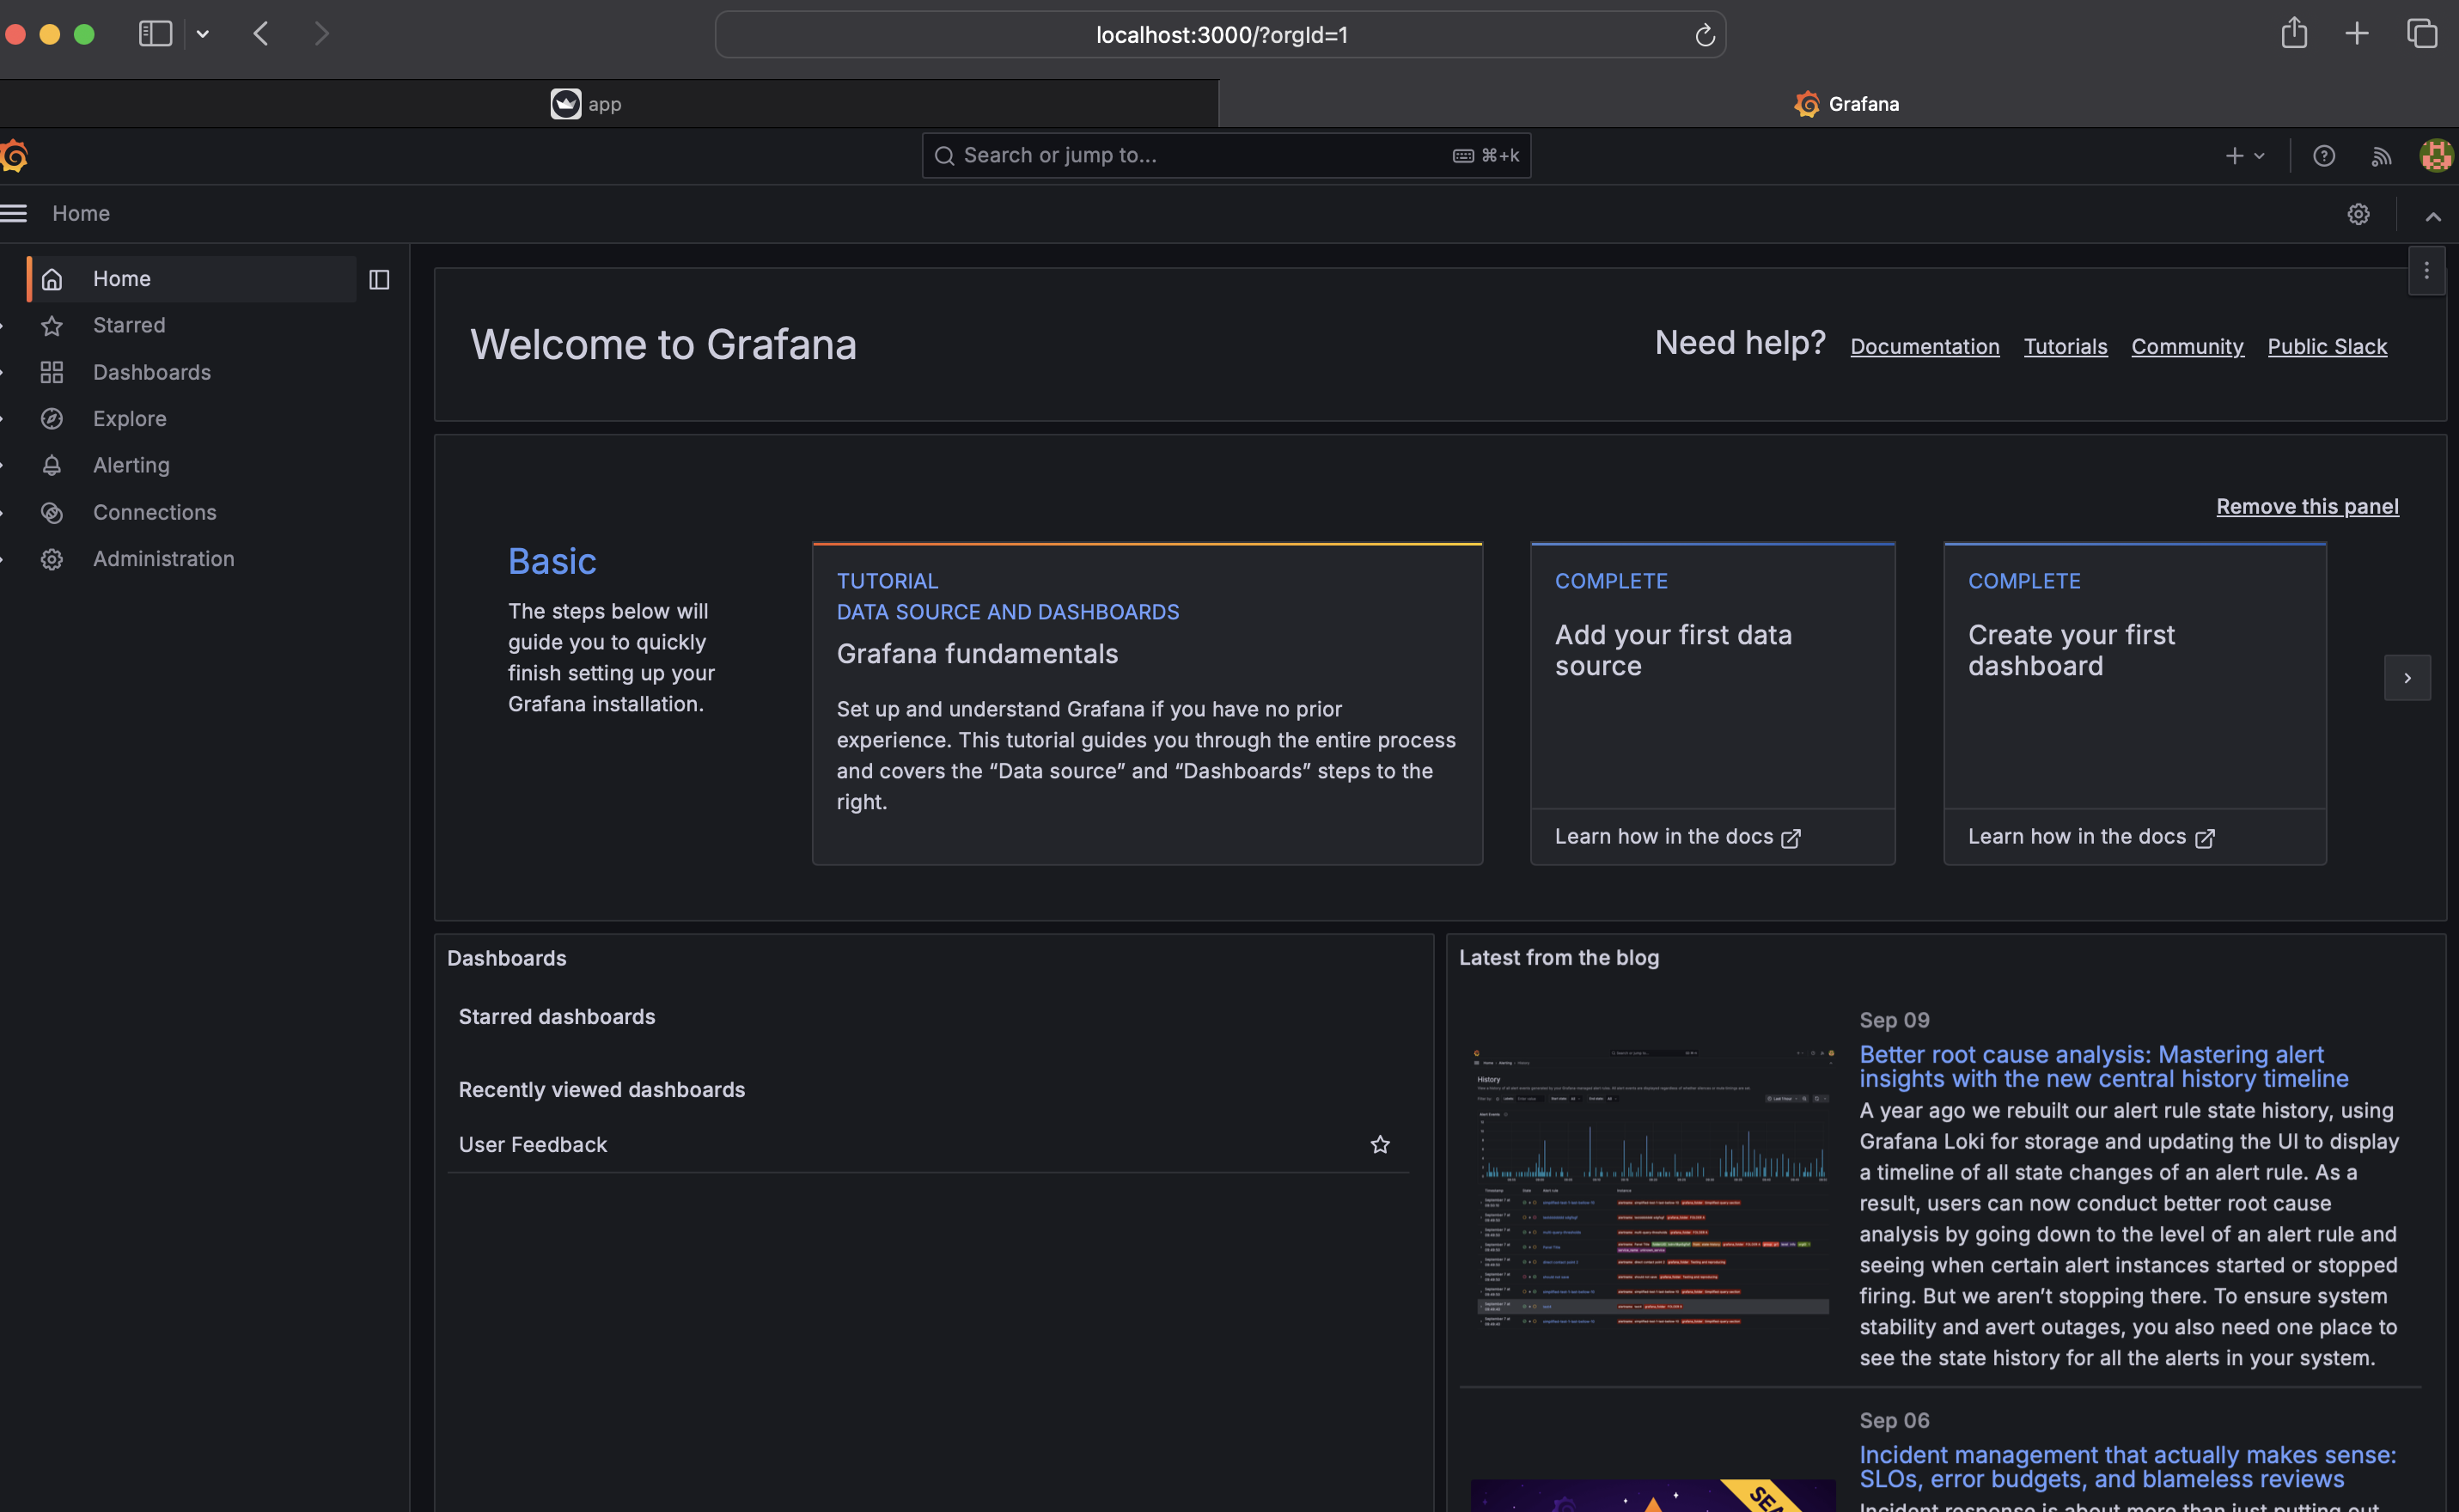
- Once you successfully authenticate, you'll be taken to homescreen like this:
-
On the left panel, click on
Dashboards->User Feedback -
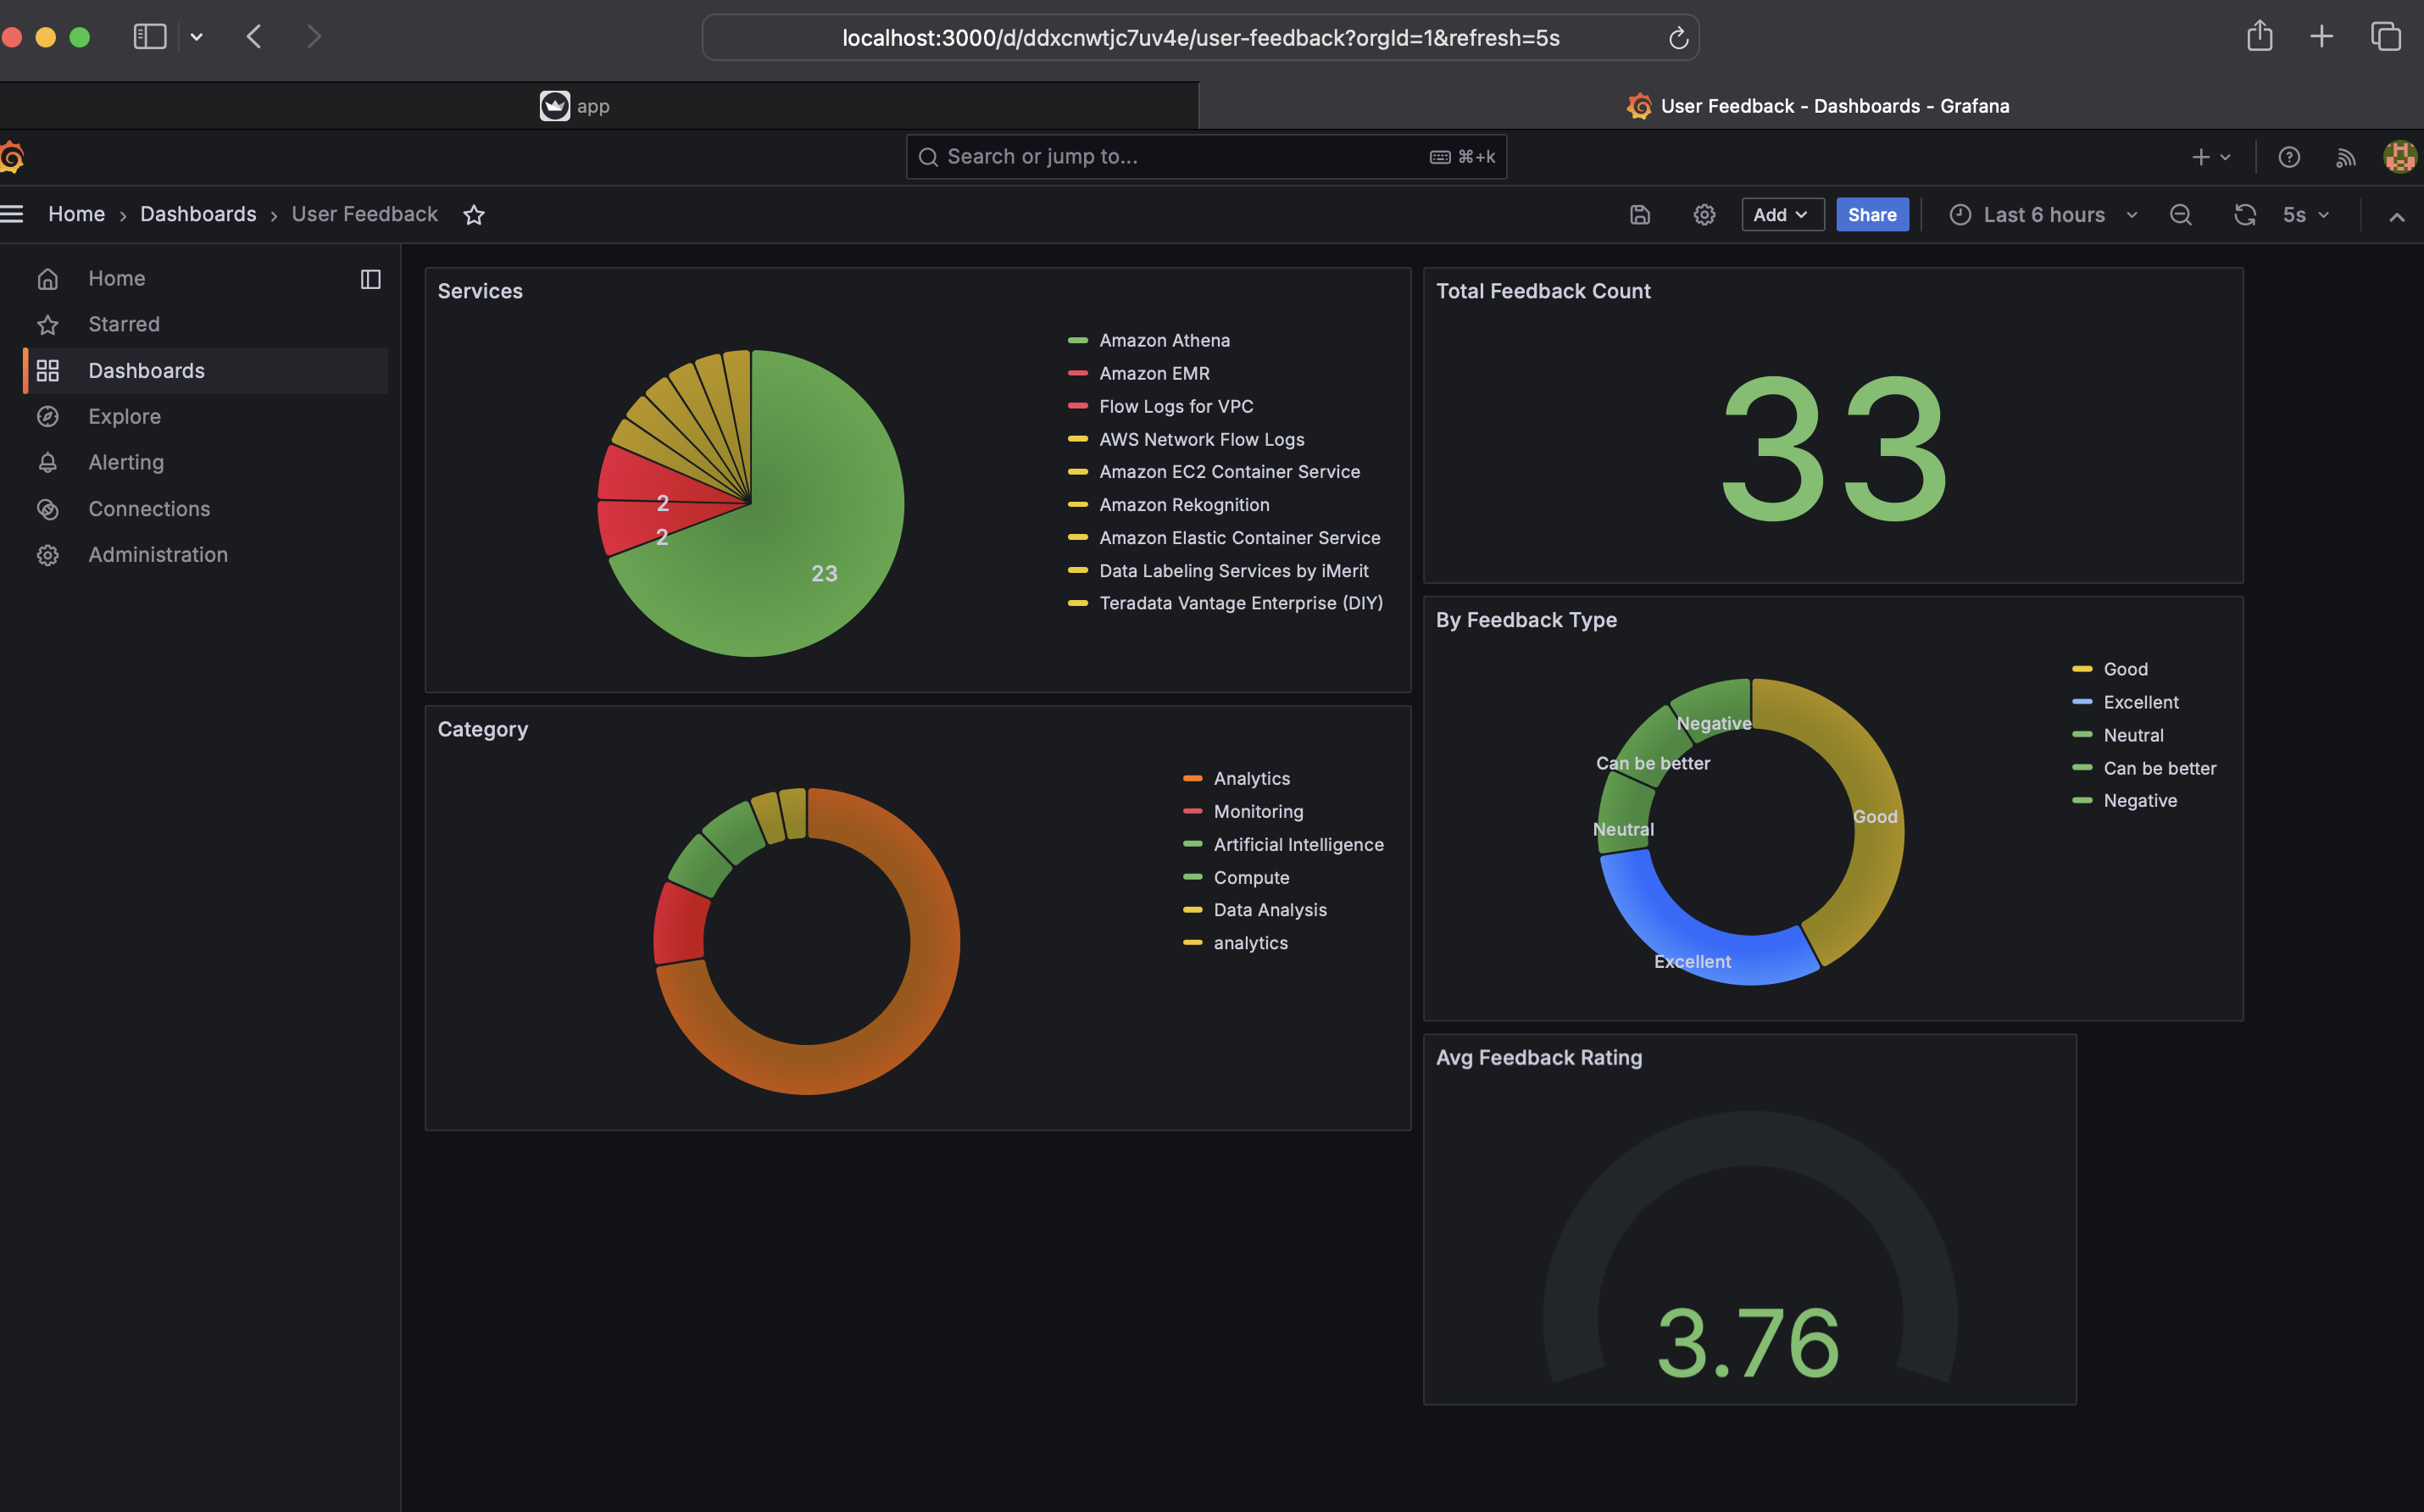
Your monitoring dashboard should look like this
Note: At first, there will be no data. As you begin using the app, all the monitoring dashboards will start to update.
Contributions to this project are welcome! Please follow these steps:
-
Fork the repository
-
Create a new branch:
git checkout -b feature-branch-name -
Make your changes and commit them:
git commit -m 'Add some feature' -
Push to the branch:
git push origin feature-branch-name -
Submit a pull request


