/clickhouse-monitoring

Simple ClickHouse UI that relies on system tables to help monitor and provide overview of your cluster

Primary LanguageTypeScriptGNU General Public License v3.0GPL-3.0

ClickHouse Monitoring Dashboard

Build and Test

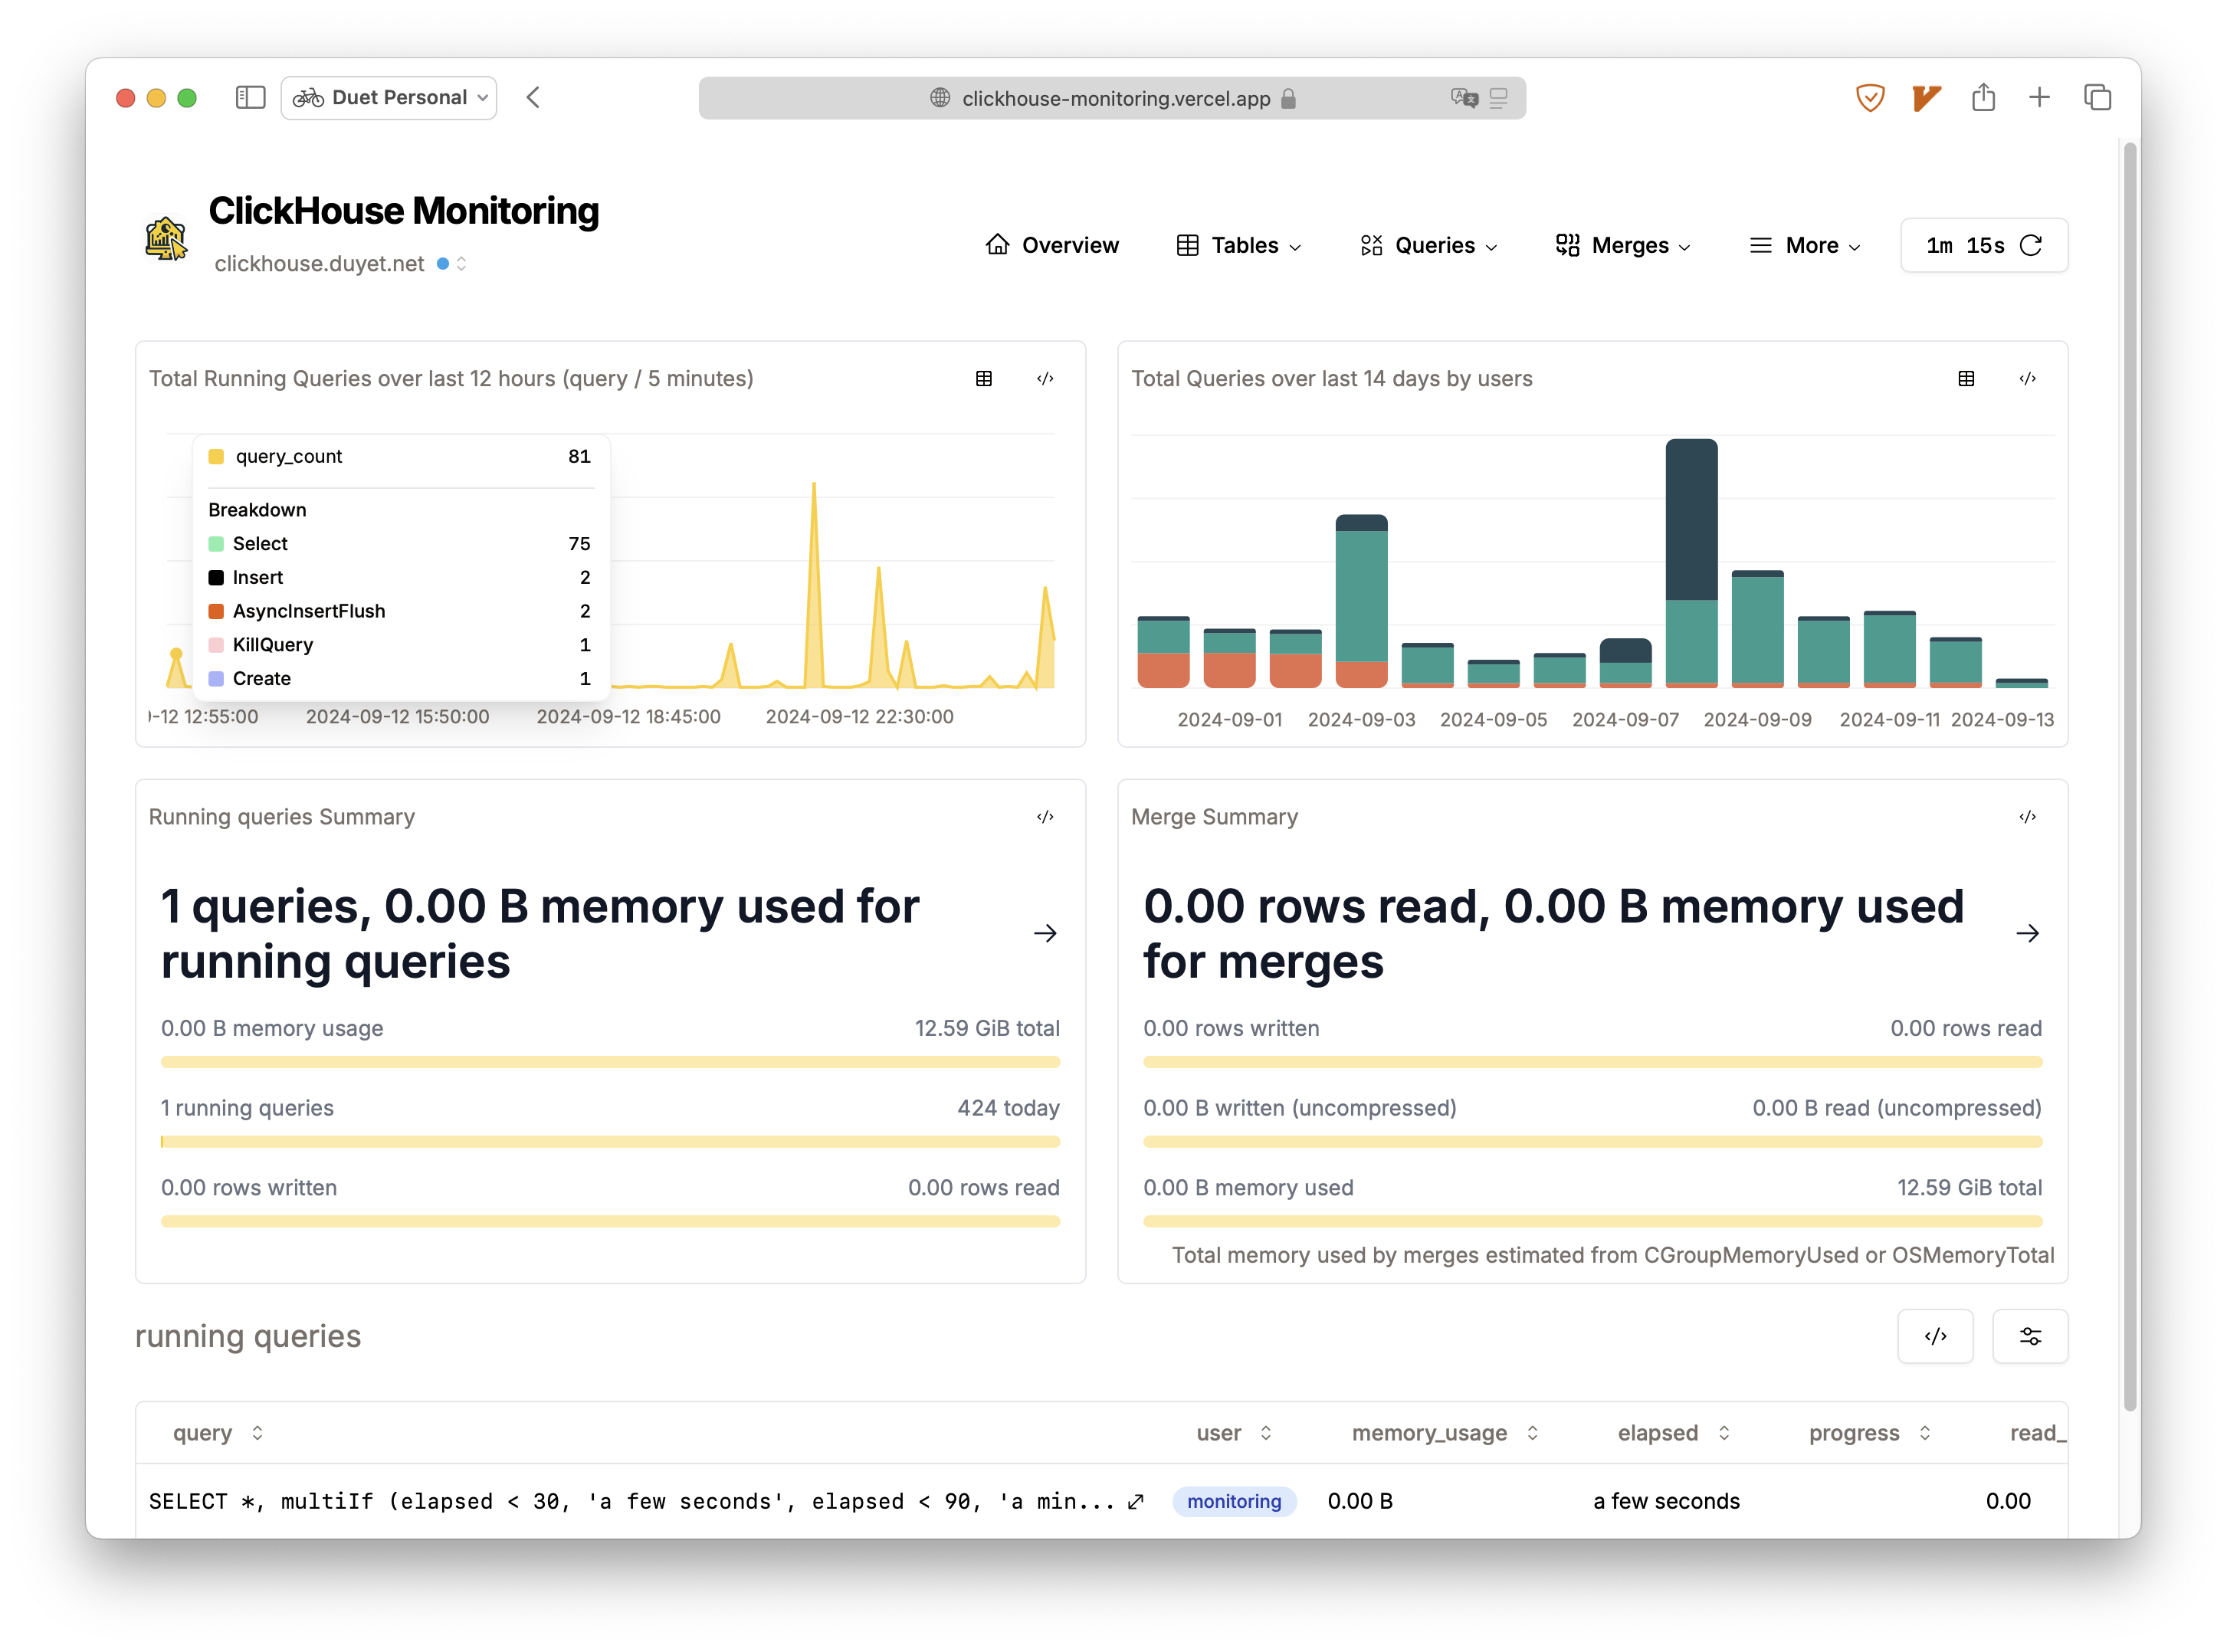
The simple Next.js dashboard that relies on system.* tables to help monitor and provide an overview of your ClickHouse cluster.

Features:

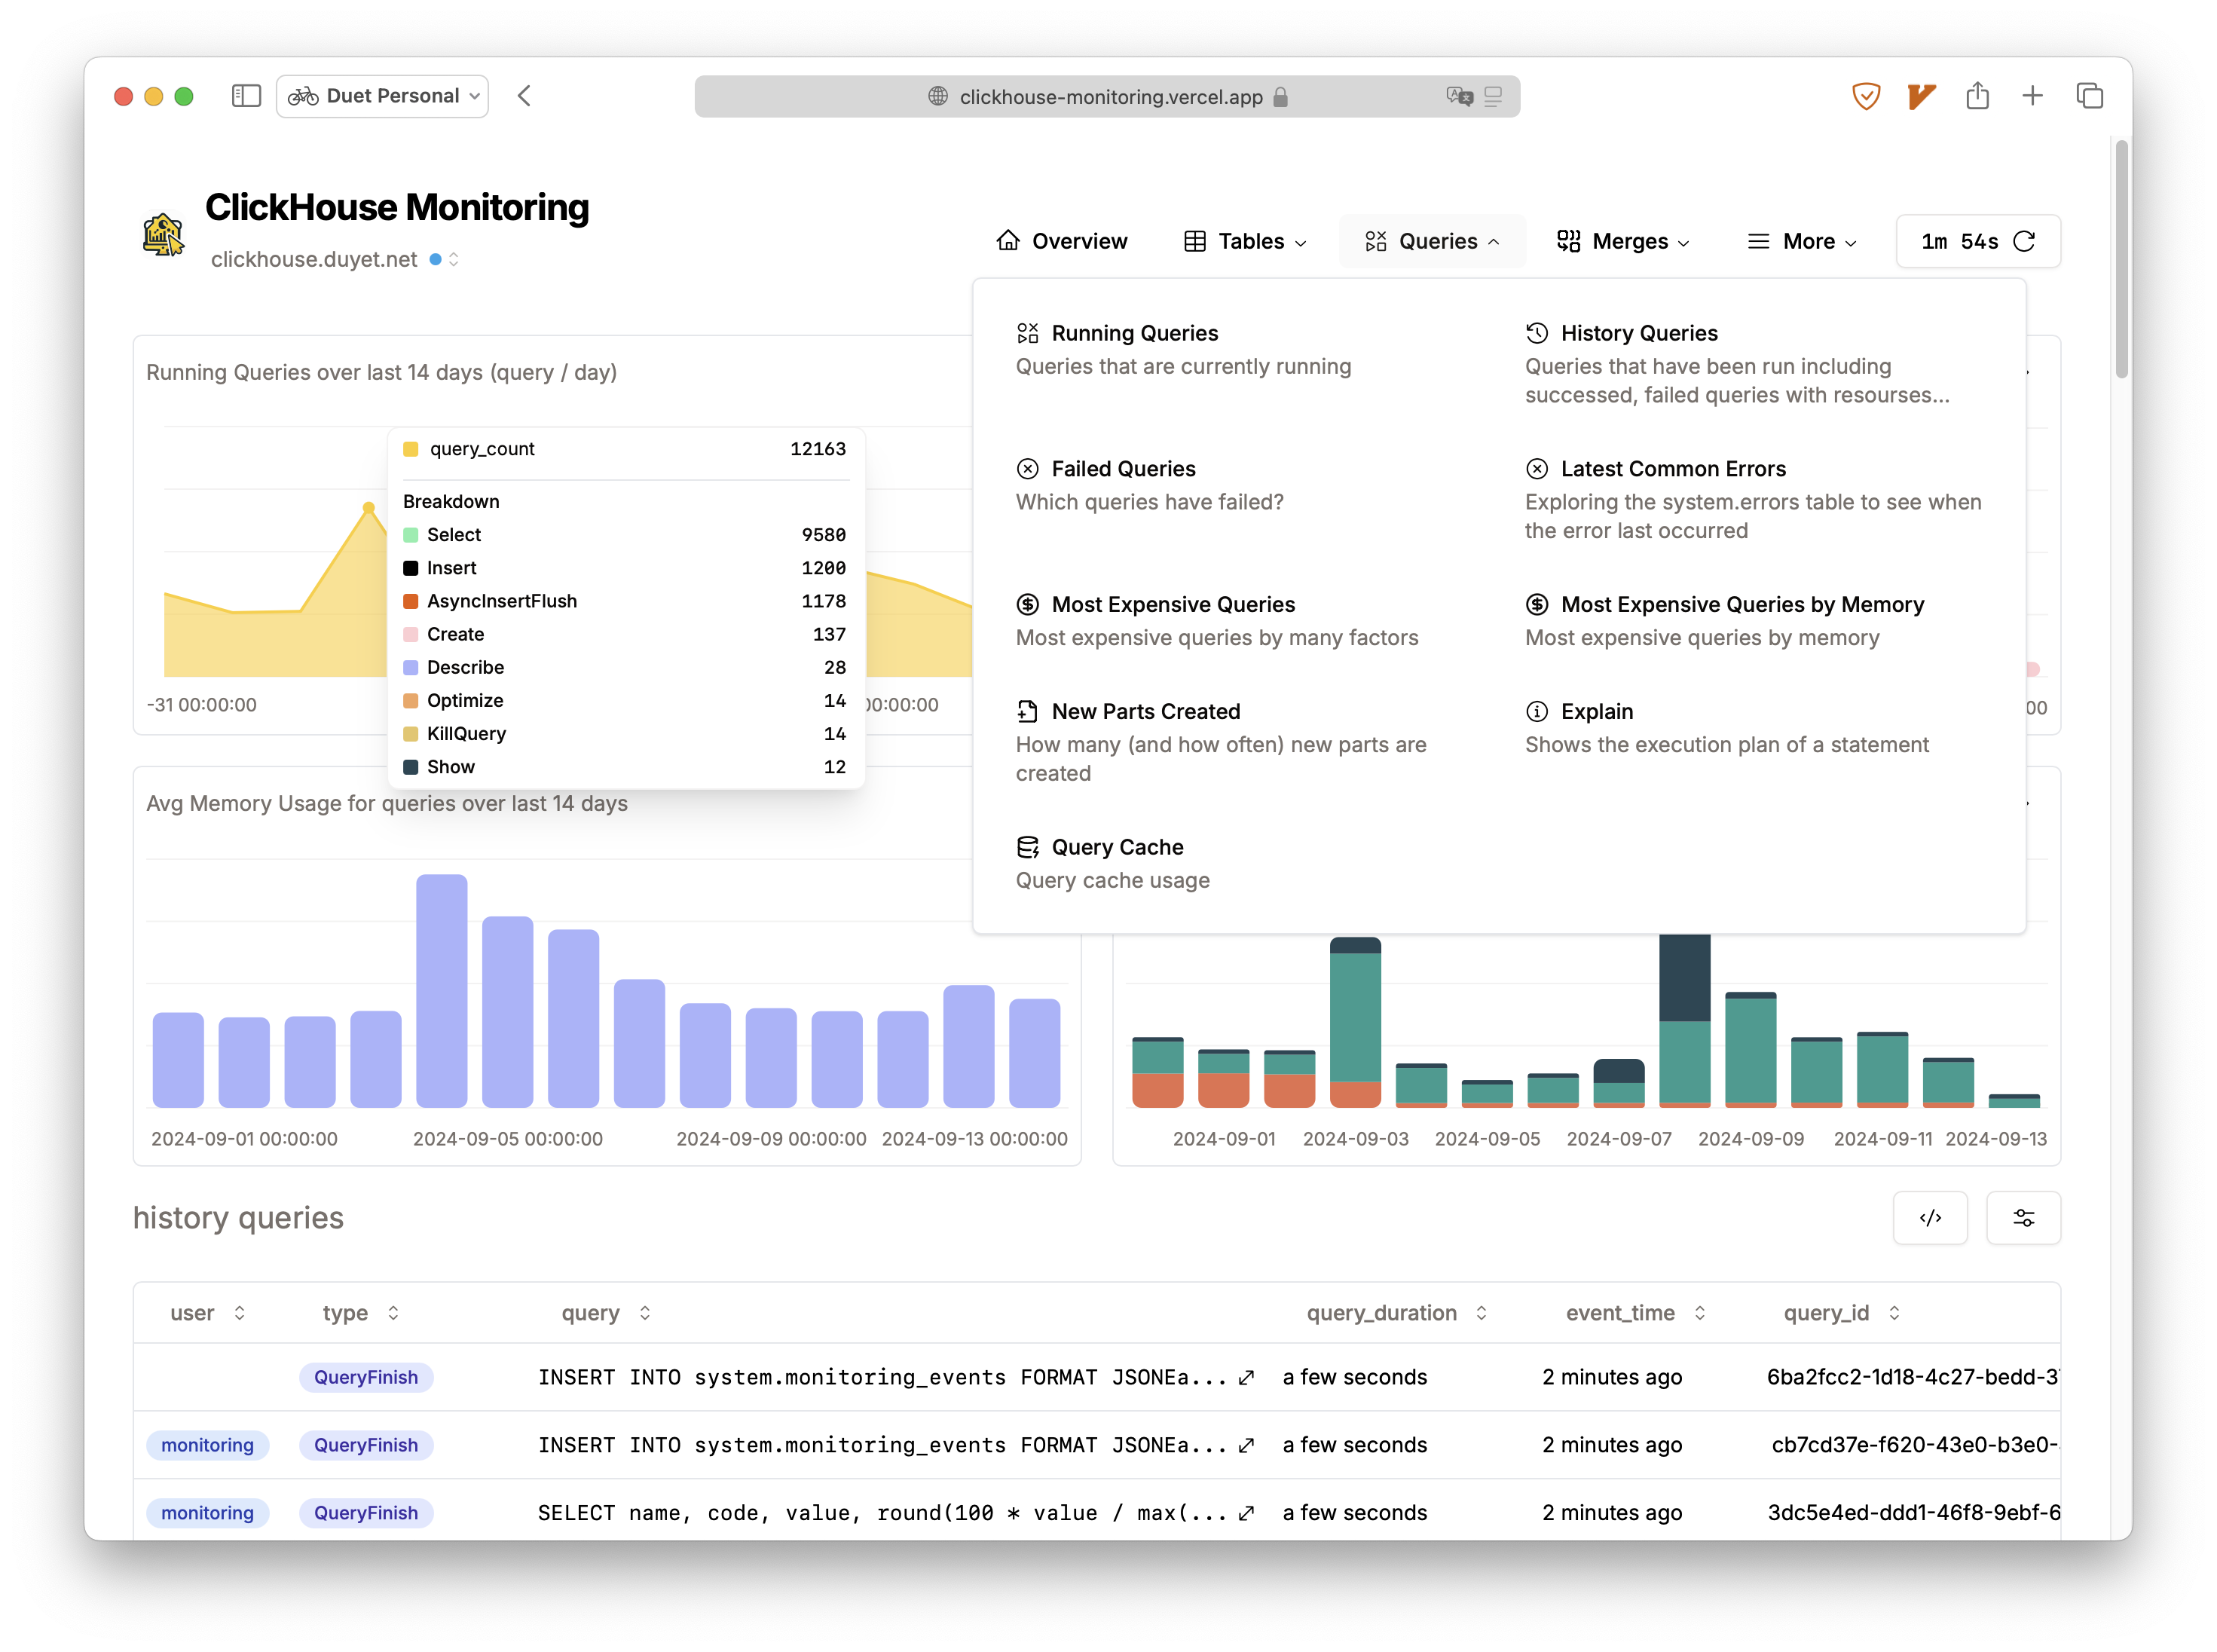
  • Query monitor: current queries, query history, query resources (memory, parts read, file_open, ...), most expensive queries, most used tables or columns, etc.
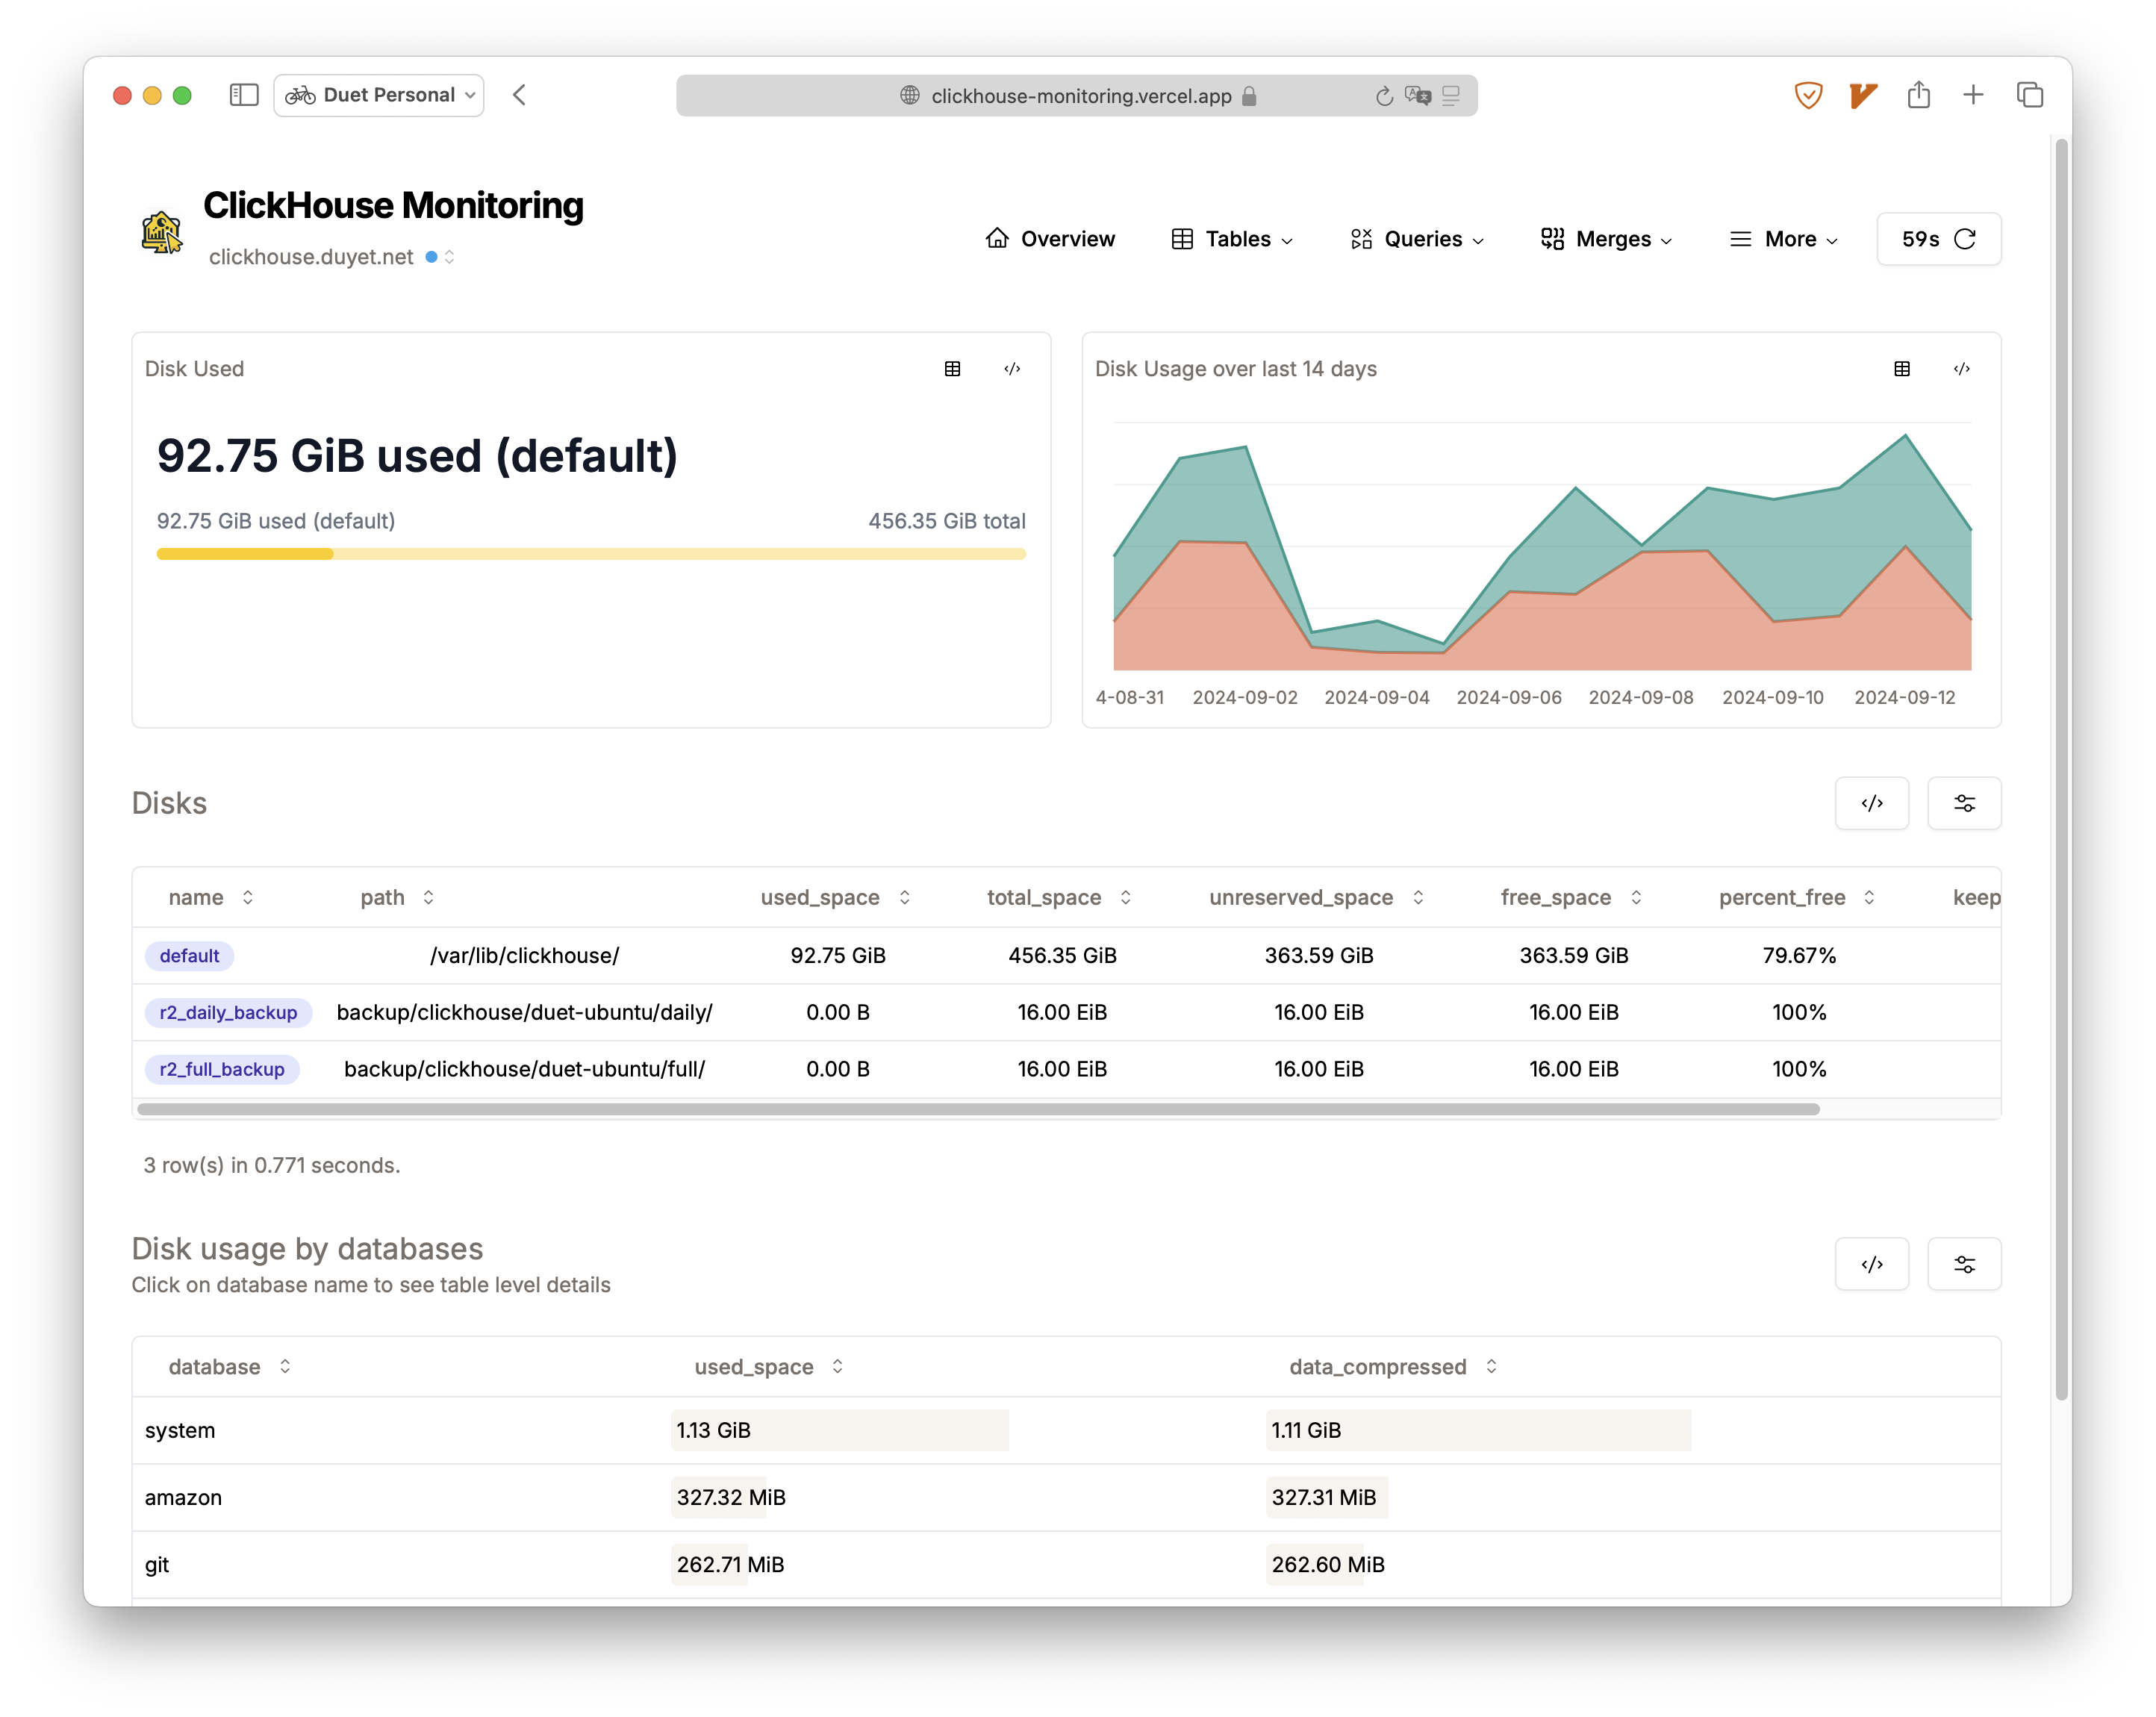
  • Cluster monitor: total memory/CPU usage, distributed queue, global settings, mergetree settings, metrics, etc.
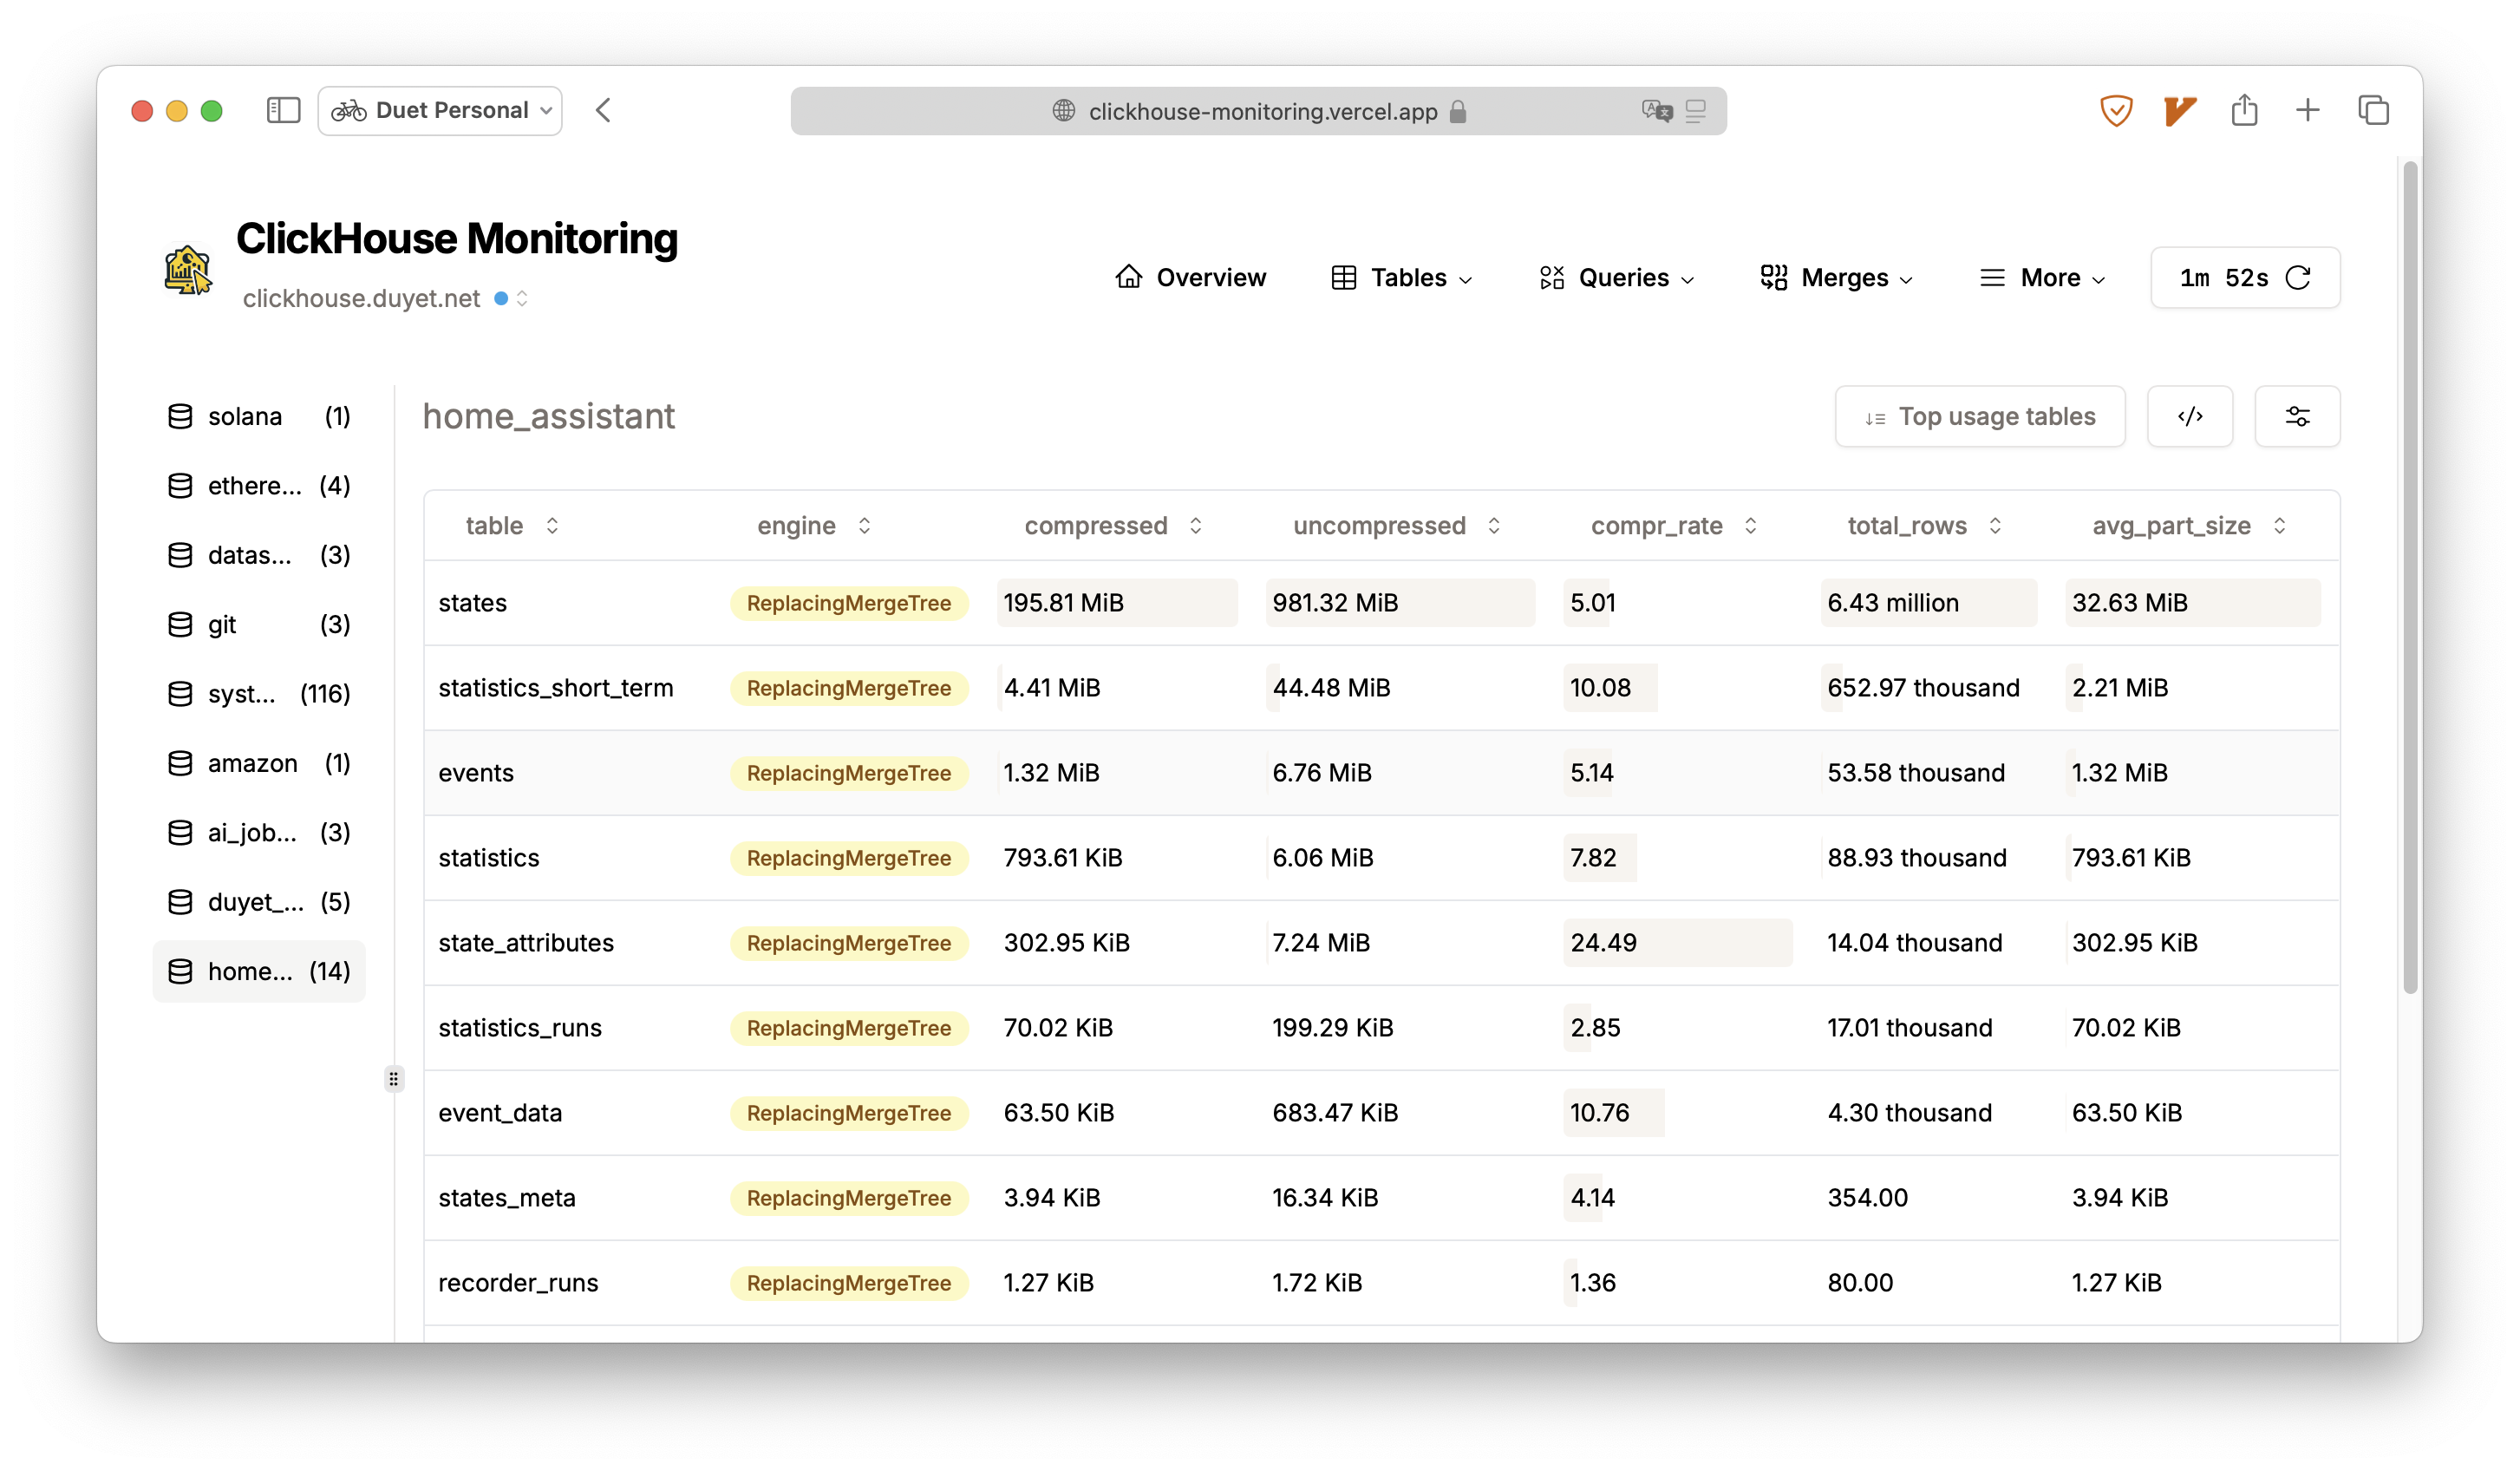
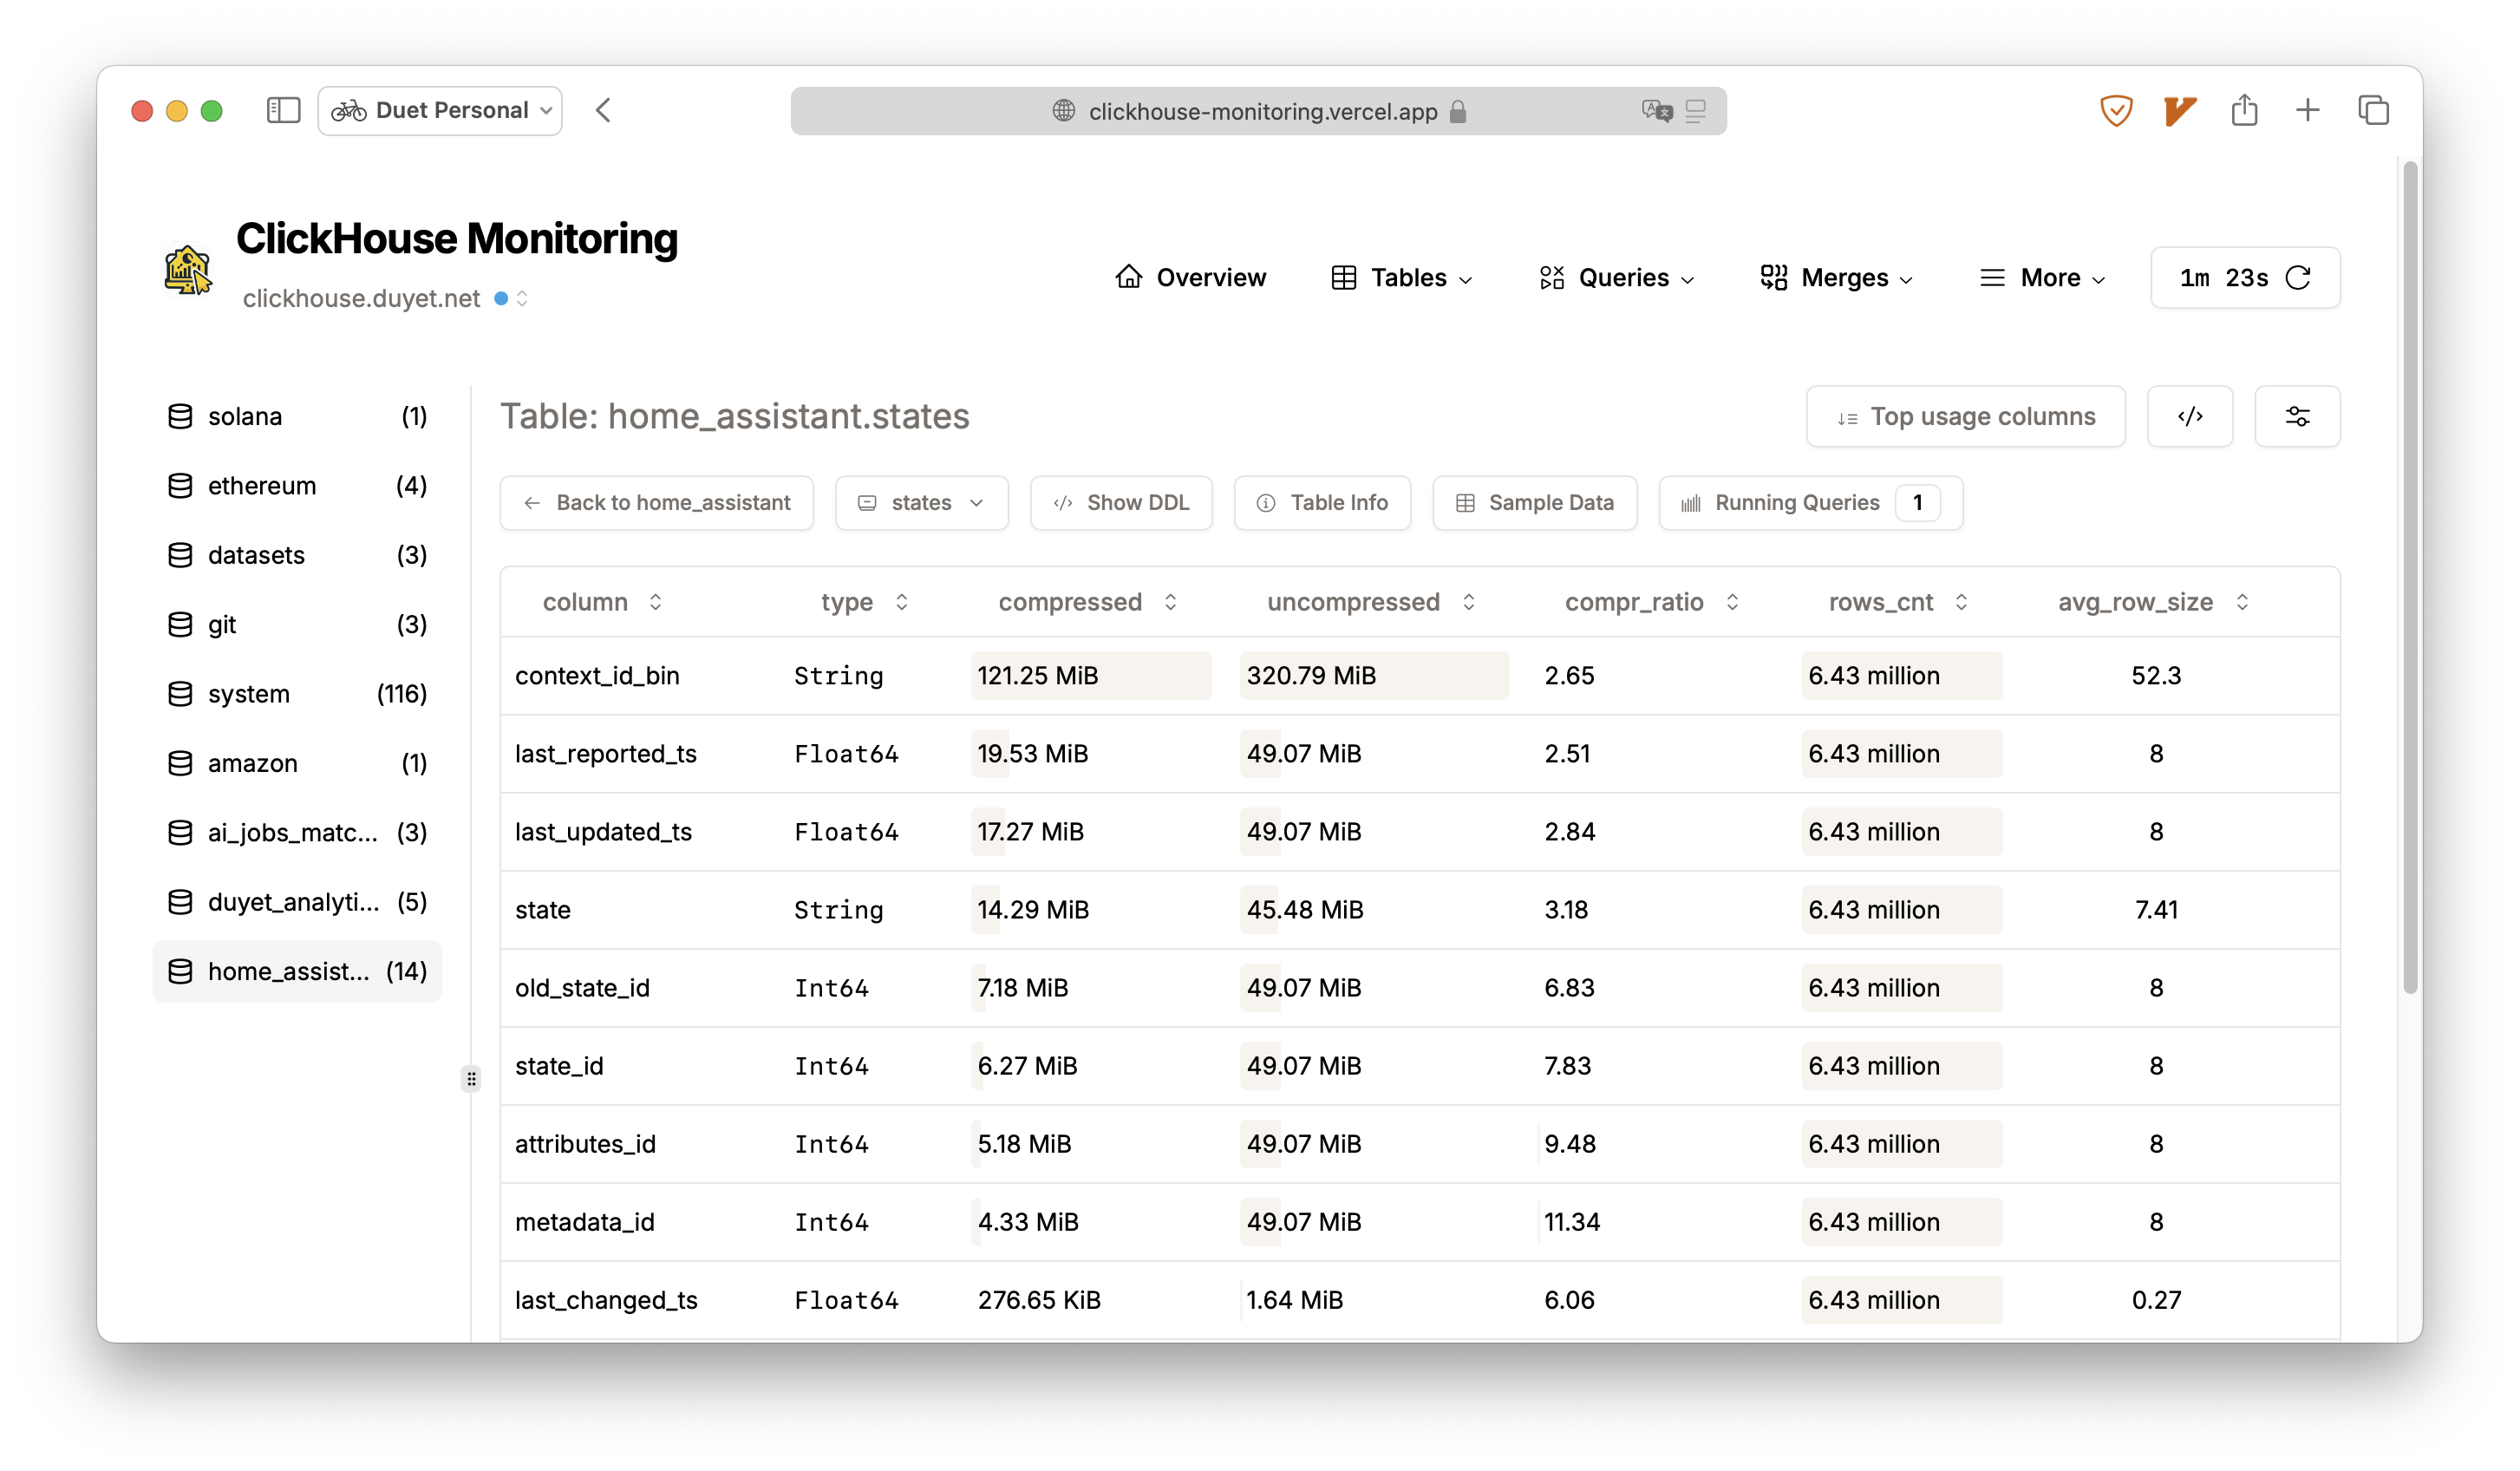
  • Tables and parts information: size, row count, compression, part size, etc., at the column level detail.
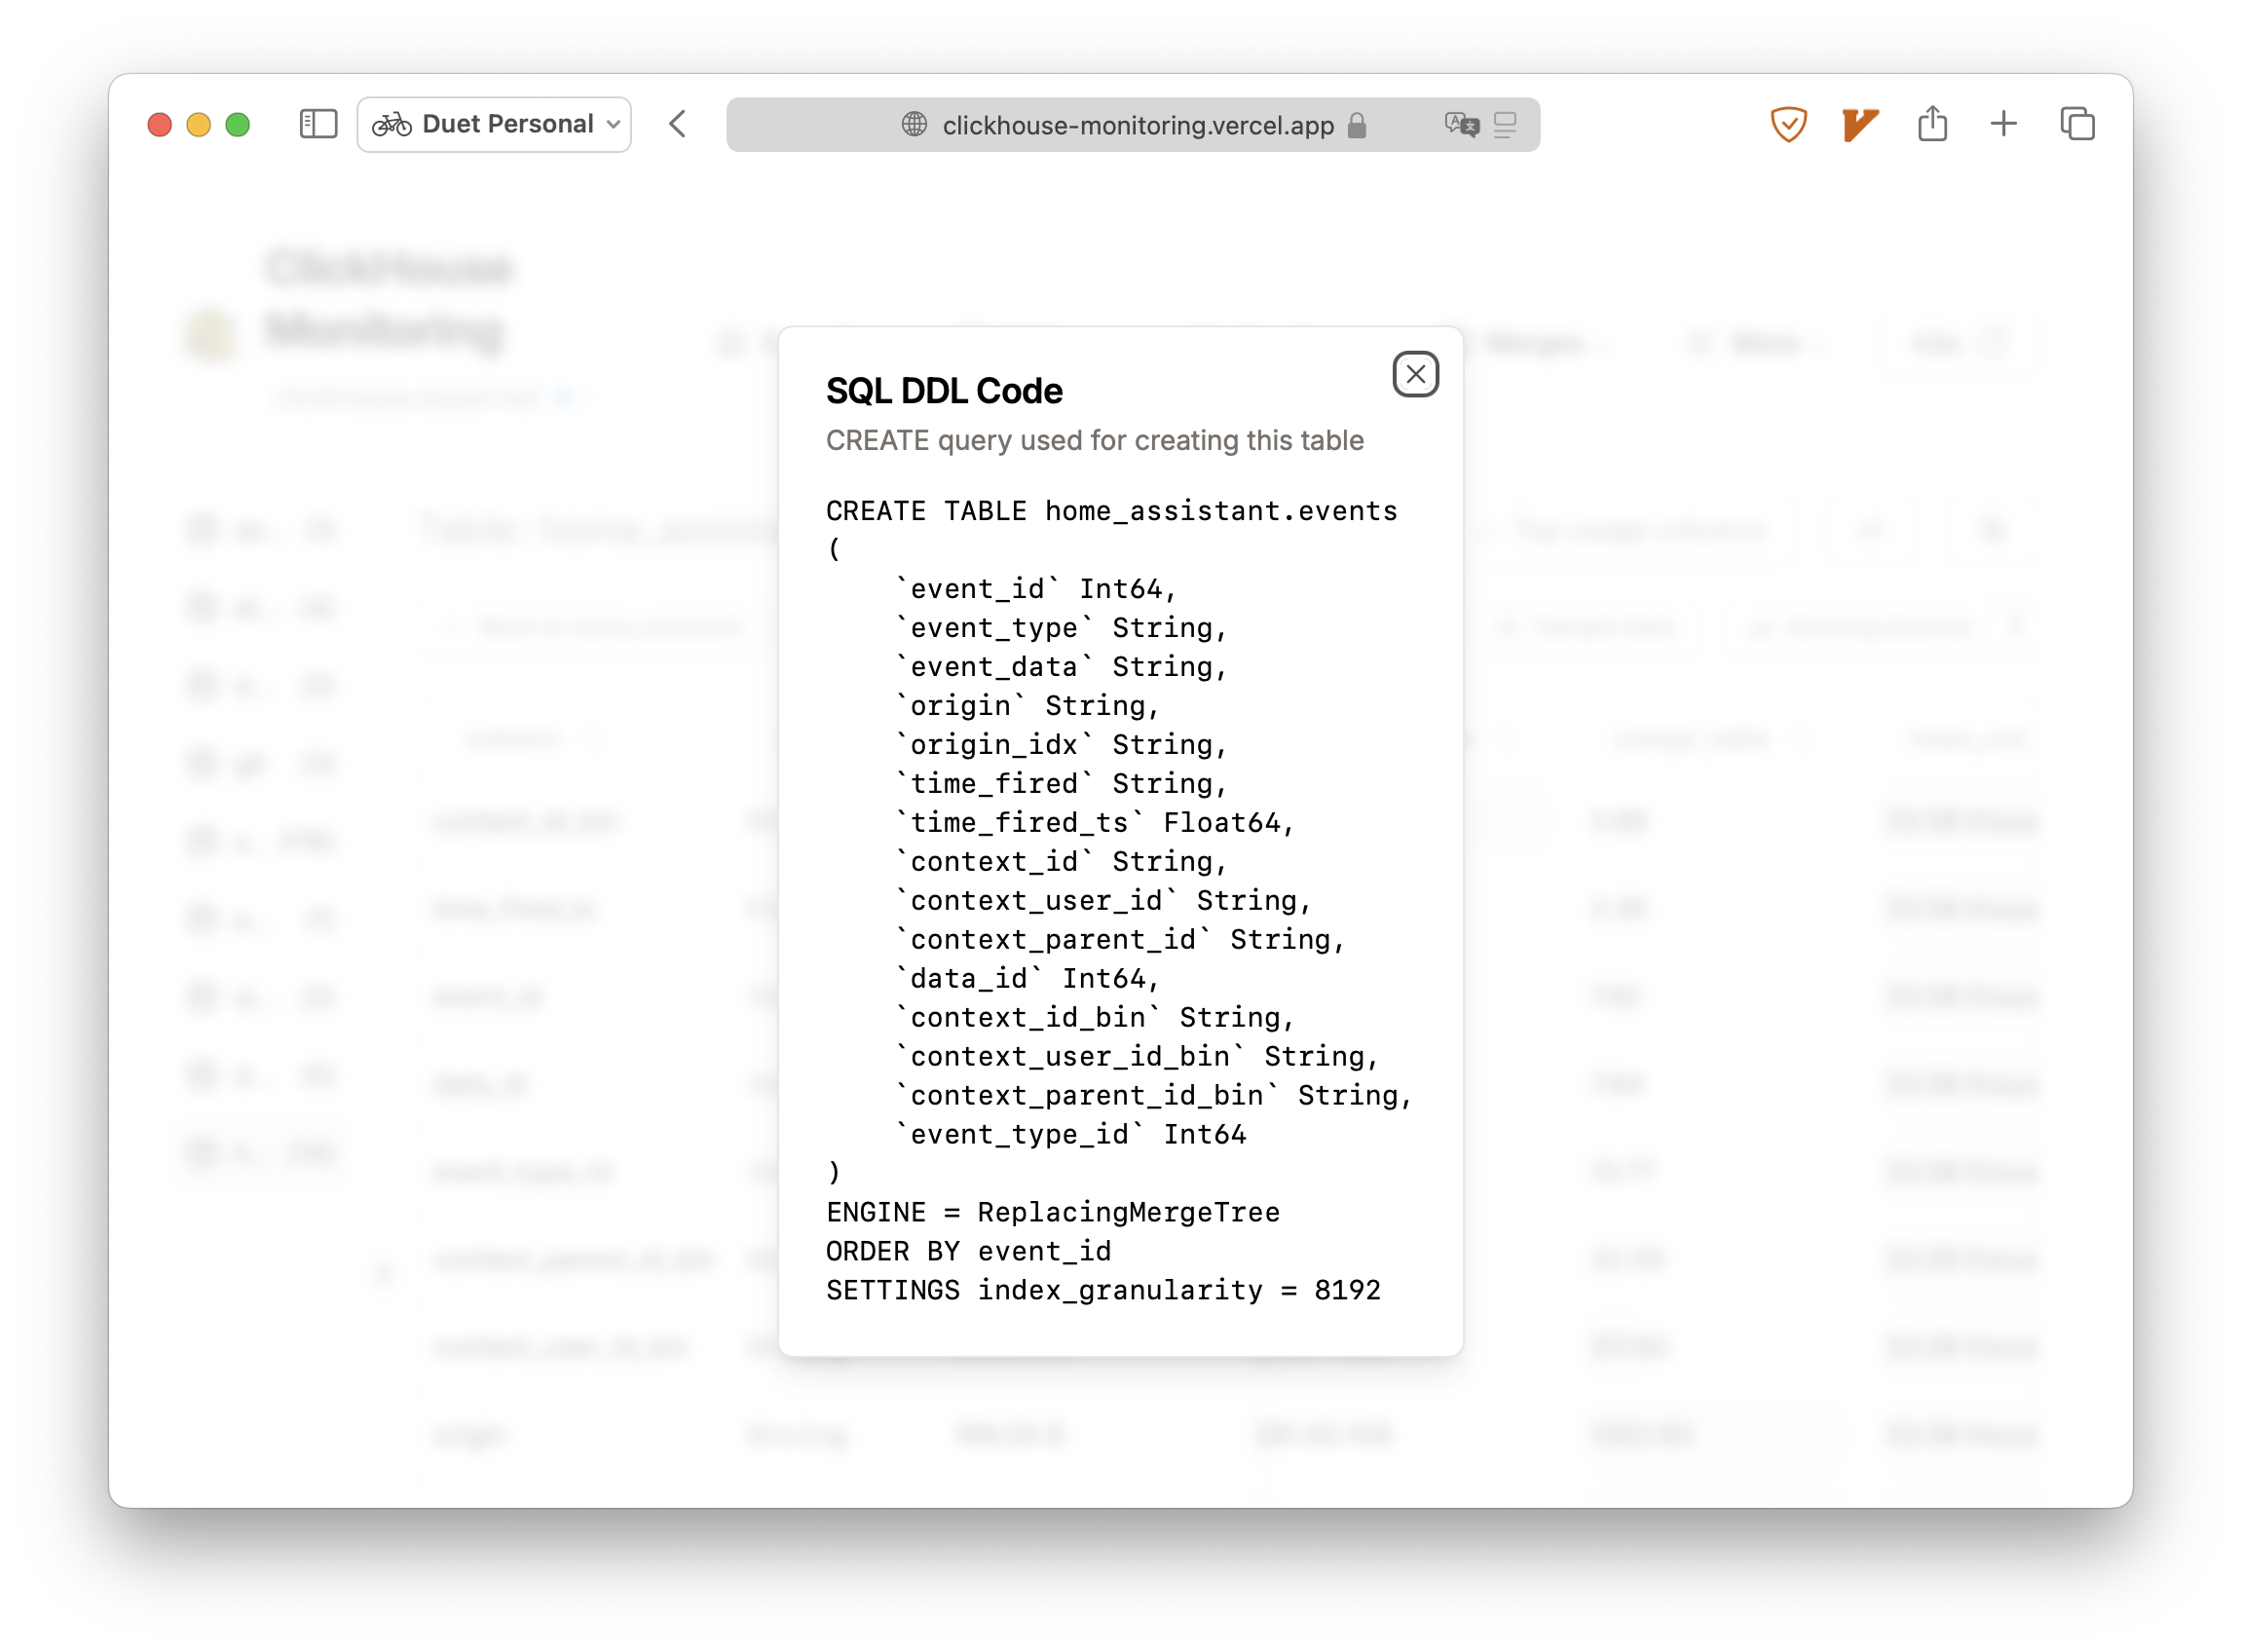
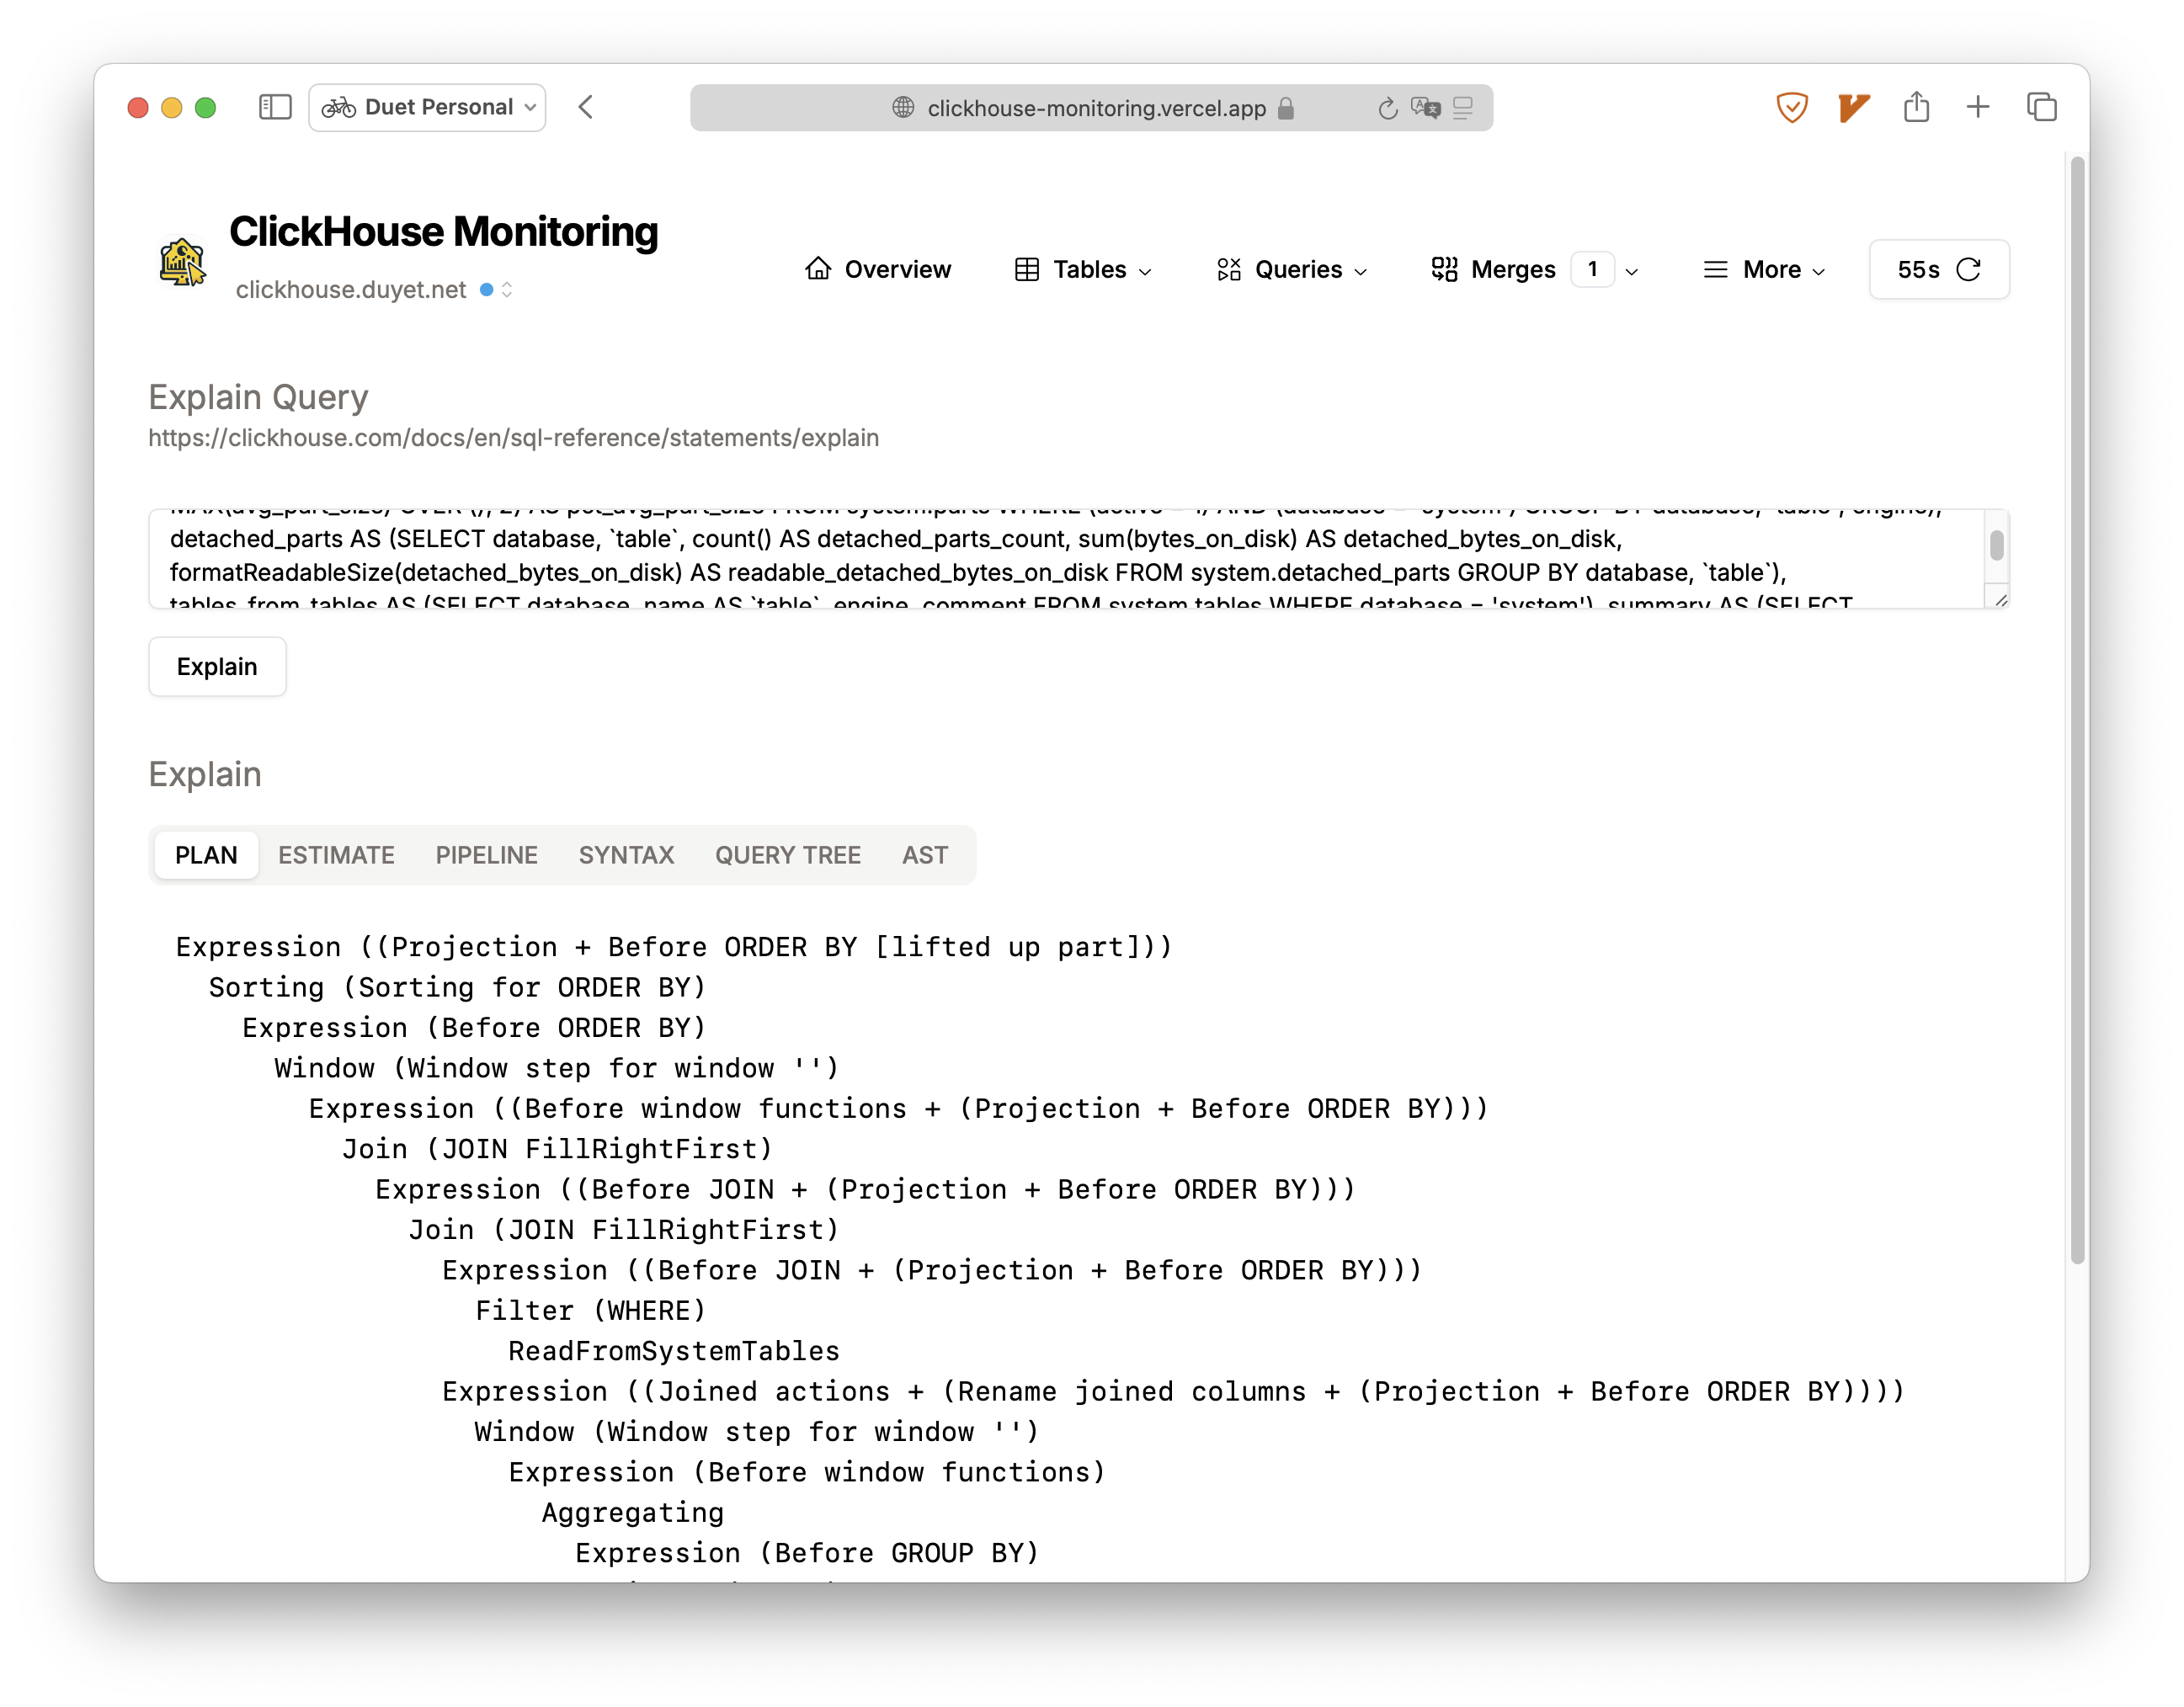
  • Useful tools: Zookeeper data exploration, query EXPLAIN, kill queries, etc.
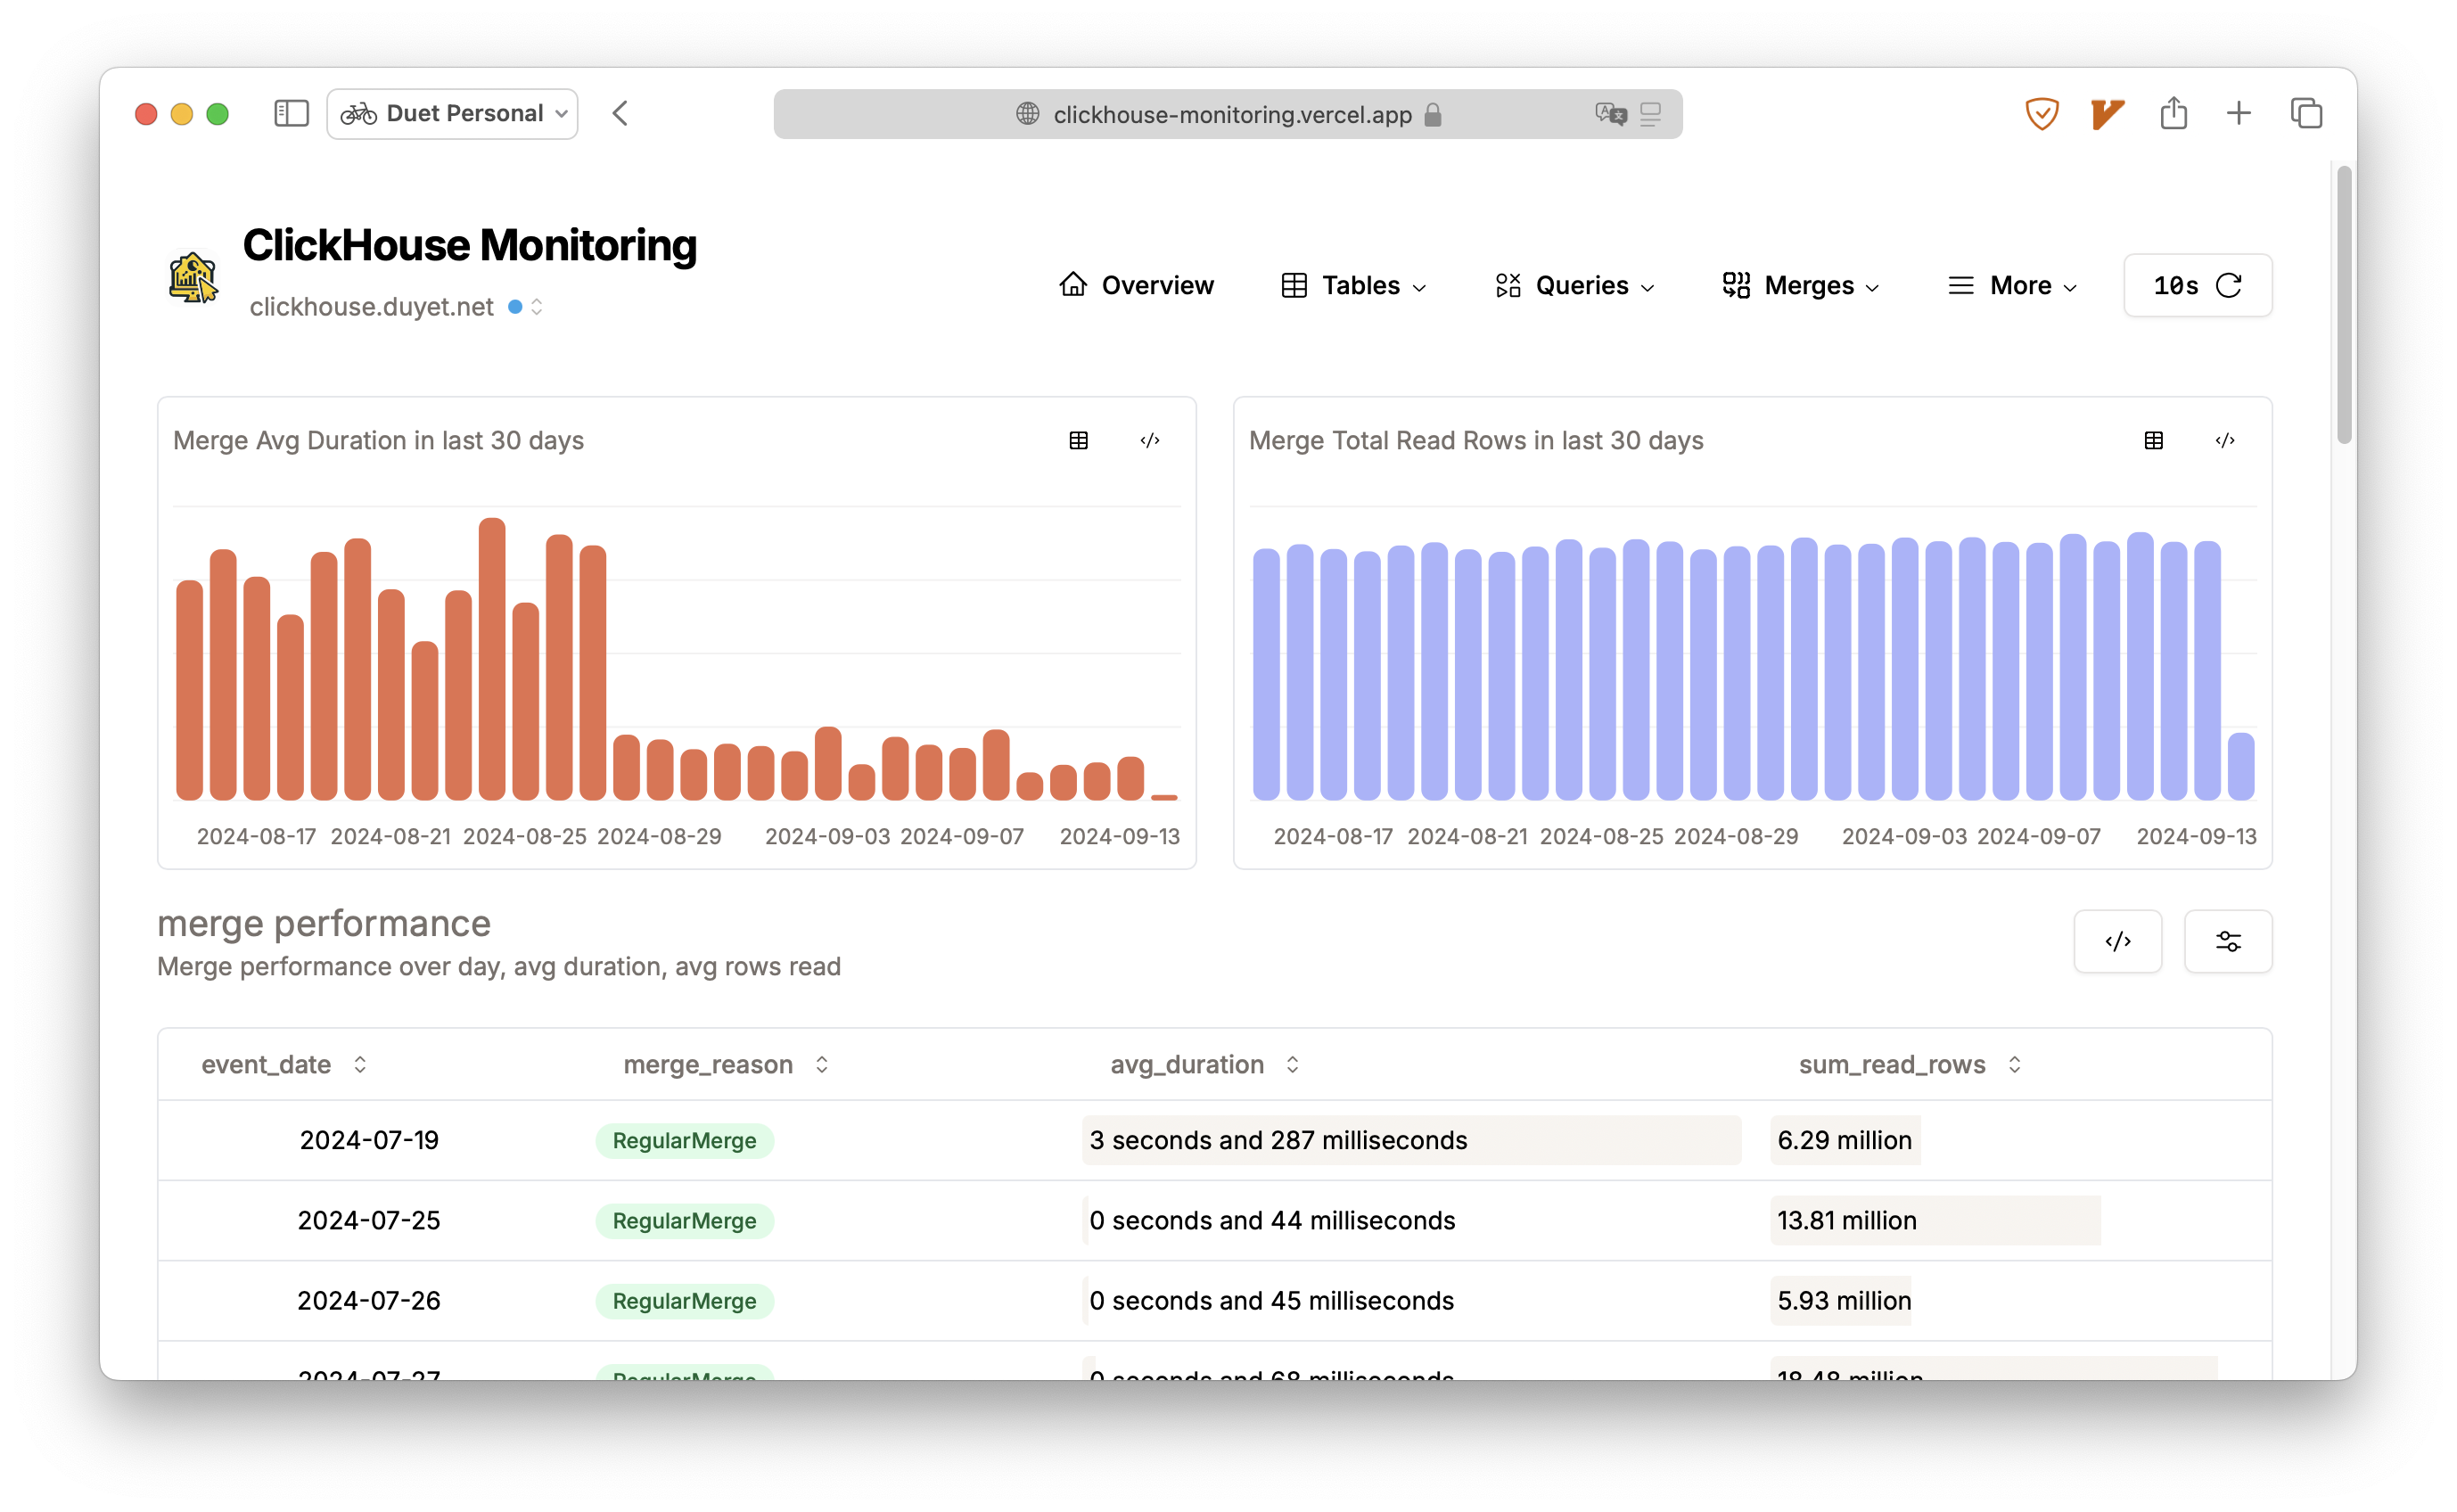
  • Visualization metric charts: queries and resource usage, number of merges/mutation, merge performance, query performance, etc.

Getting Started

To get the project up and running on your local machine, follow these steps:

  1. Clone the repository

  2. Install dependencies with npm install or yarn install

  3. Create a .env.local file by copying the .env.example file and filling in the required environment variables:

    • CLICKHOUSE_HOST: ClickHouse host, for example http://localhost:8123
    • CLICKHOUSE_USER: ClickHouse user with permission to query the system database.
    • CLICKHOUSE_PASSWORD: ClickHouse password for the specified user.
    • CLICKHOUSE_MAX_EXECUTION_TIME: max_execution_time timeout in seconds. Default is 10.
    • CLICKHOUSE_TZ: ClickHouse server timezone. Default: ''.
    • NEXT_QUERY_CACHE_TTL: TTL of unstable_cache - cache the results of most charts to speed up and reuse them across multiple requests. Default: 86400.
  4. Run the development server with npm run dev or yarn dev

  5. Open http://localhost:3000 in your browser to see the dashboard.

Deployment

1. Vercel

For easy deployment, use the Vercel Platform, created by the makers of Next.js. Refer to the Next.js deployment documentation for more details.

2. Docker

Using the latest image here: https://github.com/duyet/clickhouse-monitoring/pkgs/container/clickhouse-monitoring

docker run -it \
    -e CLICKHOUSE_HOST='http://localhost' \
    -e CLICKHOUSE_USER='default' \
    -e CLICKHOUSE_PASSWORD='' \
    -e CLICKHOUSE_TZ='Asia/Ho_Chi_Minh' \
    -e CLICKHOUSE_MAX_EXECUTION_TIME='15' \
    -e NEXT_QUERY_CACHE_TTL='86400' \
    --name clickhouse-monitoring \
    ghcr.io/duyet/clickhouse-monitoring:main

3. Kubernetes Helm Chart

Using the latest helm chart here: https://github.com/duyet/charts/tree/master/clickhouse-monitoring

helm repo add duyet https://duyet.github.io/charts

cat <<EOF >> values.yaml
env:
  - name: CLICKHOUSE_HOST
    value: http://localhost:8123
  - name: CLICKHOUSE_USER
    value: default
  - name: CLICKHOUSE_PASSWORD
    value: ''
  - name: CLICKHOUSE_TZ
    value: 'Asia/Ho_Chi_Minh'
  - name: CLICKHOUSE_MAX_EXECUTION_TIME
    value: '15'
  - name: NEXT_QUERY_CACHE_TTL
    value: '86400'
EOF

helm install -f values.yaml clickhouse-monitoring-release duyet/clickhouse-monitoring

Suggested role for "monitoring" user

# File: users.d/monitoring_role.xml
<clickhouse>
  <users>
    <monitoring>
      <!-- define password here -->
      <profile>default</profile>
      <networks><ip>::/0</ip></networks>
      <grants>
        <query>GRANT monitoring_role</query>
      </grants>
    </monitoring>
  </users>

  <roles>
    <monitoring_role>
      <grants>
        <query>REVOKE ALL ON *.*</query>
        <query>GRANT SELECT,SHOW,dictGet,REMOTE ON *.*</query>
        <query>GRANT SELECT,INSERT,ALTER,CREATE,DROP,TRUNCATE,OPTIMIZE,SHOW,dictGet ON system.*</query>
      </grants>
    </monitoring_role>
  </roles>
</clickhouse>

Feedback and Contributions

Feedback and contributions are welcome! Feel free to open issues or submit pull requests.

License

MIT. See LICENSE for more details.


Alt