Flamegraph visualizations (and related tools) implemented in Javascript.
This vanilla Javascript library is designed to dynamically create Flamegraph and Flamegraph related visualizations in the browser from the raw collapsed stack file.
Because the FGrav visualizations are done dynamically within the browser, it offers a lot more customization options and allows the user to create many interactive features unavailable with a conventional SVG file (See filters, color-schemes, overlays).
As shown in this project, FGrav also provides a basis to compare related data visually by easily extending or embedding the JS flamegraph implementation - See FlameGraph diff and FlameGraph comparison views.
Created By: Amir Langer
License: Apache 2.0
Thanks:
- Inspiration:
- Brendan Gregg's Flamegraph reference implementation
- Mark Price's grav profiling results visualizations
- Dependencies:
- JQuery
- (Test code only) Jasmine
- (Test code only) Jasmine-Ajax
- (Presentation only under docs/presentation) reveal.js
Visualizations:
Usage:
The ability to create the Flamegraph dynamically rather than using a static SVG file allows a lot more flexbility in visualizing and analysing the data such as:
- dynamic color scheme
- dynamic overlays
- specific frame filters
- grouping of code paths (TODO)
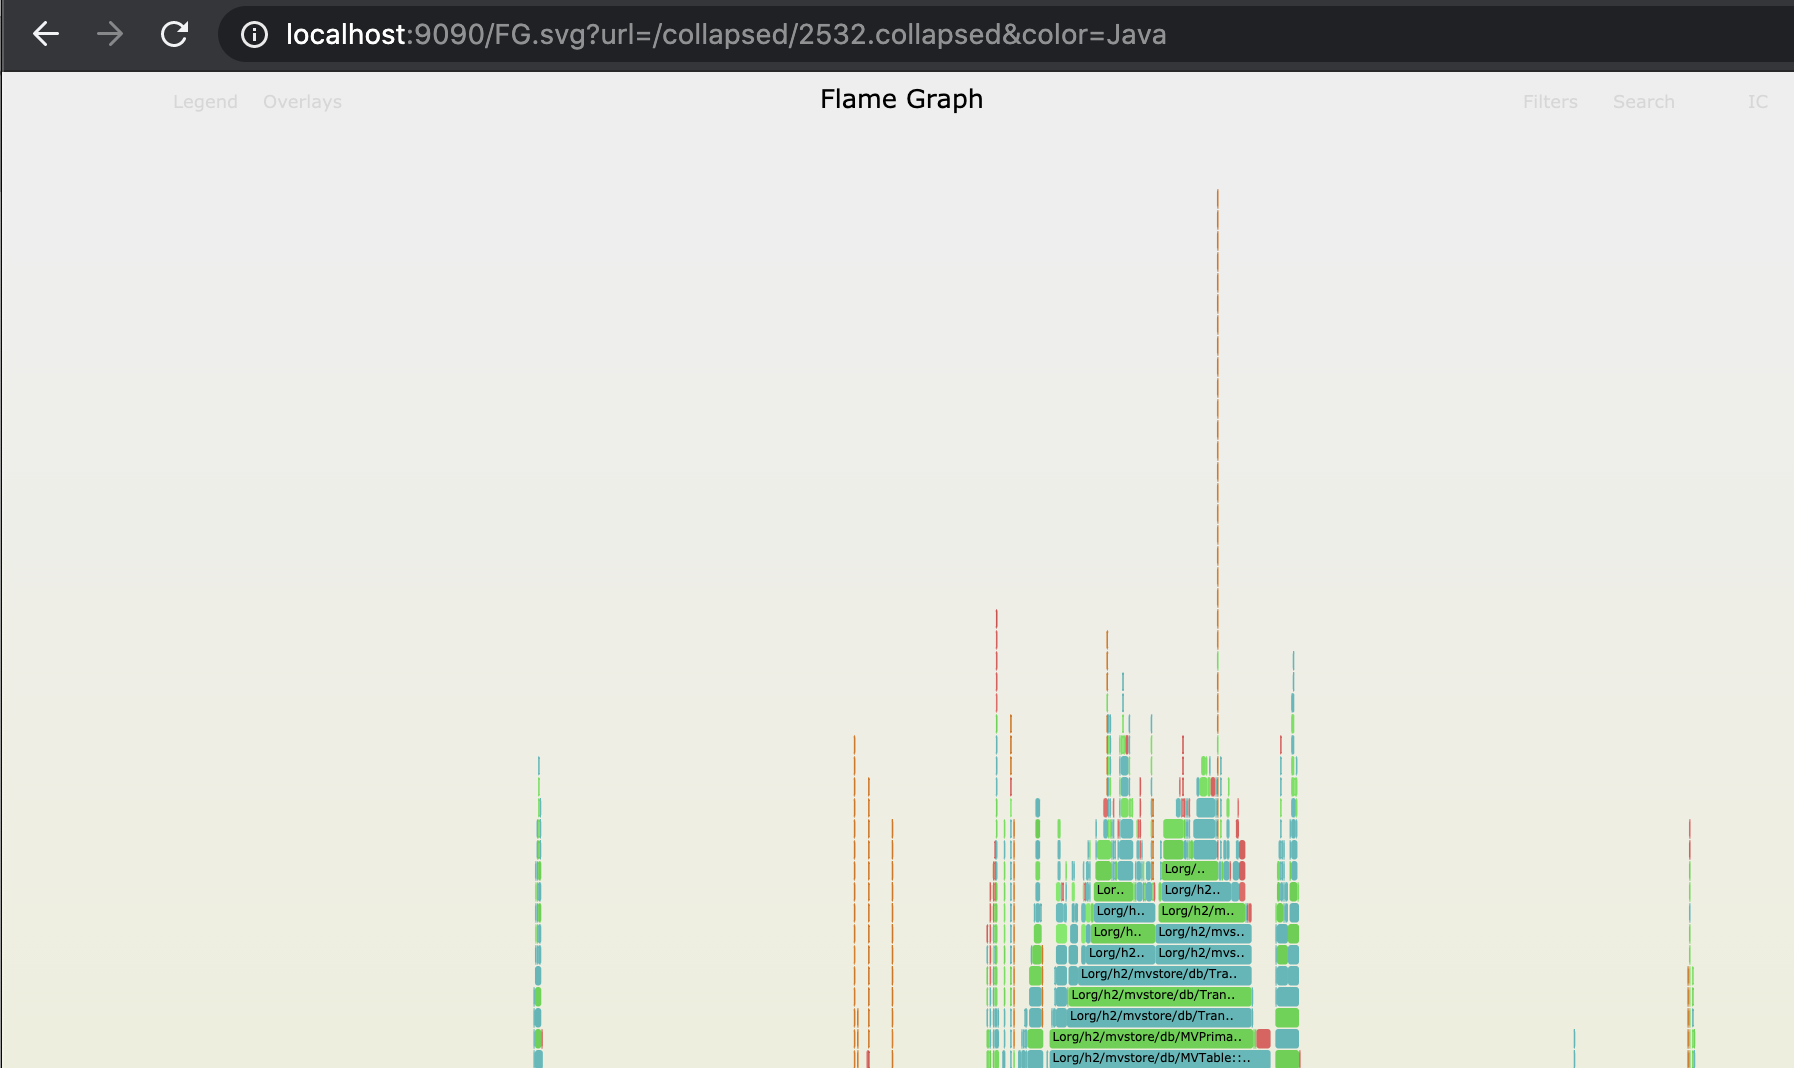
Showing FlameGraph is done by requesting FG.svg.
| Parameter | Description | Required |
|---|---|---|
| url | url of the collapsed stack file to visualize | yes |
| config | path to configuration file (default = fgrav.json) | no |
| color | set specific color scheme to use | no |
| frameFilter | set specific frame filter to use | no |
| width | set width for this visualization in pixels | no |
| height | set height for this visualization in pixels | no |
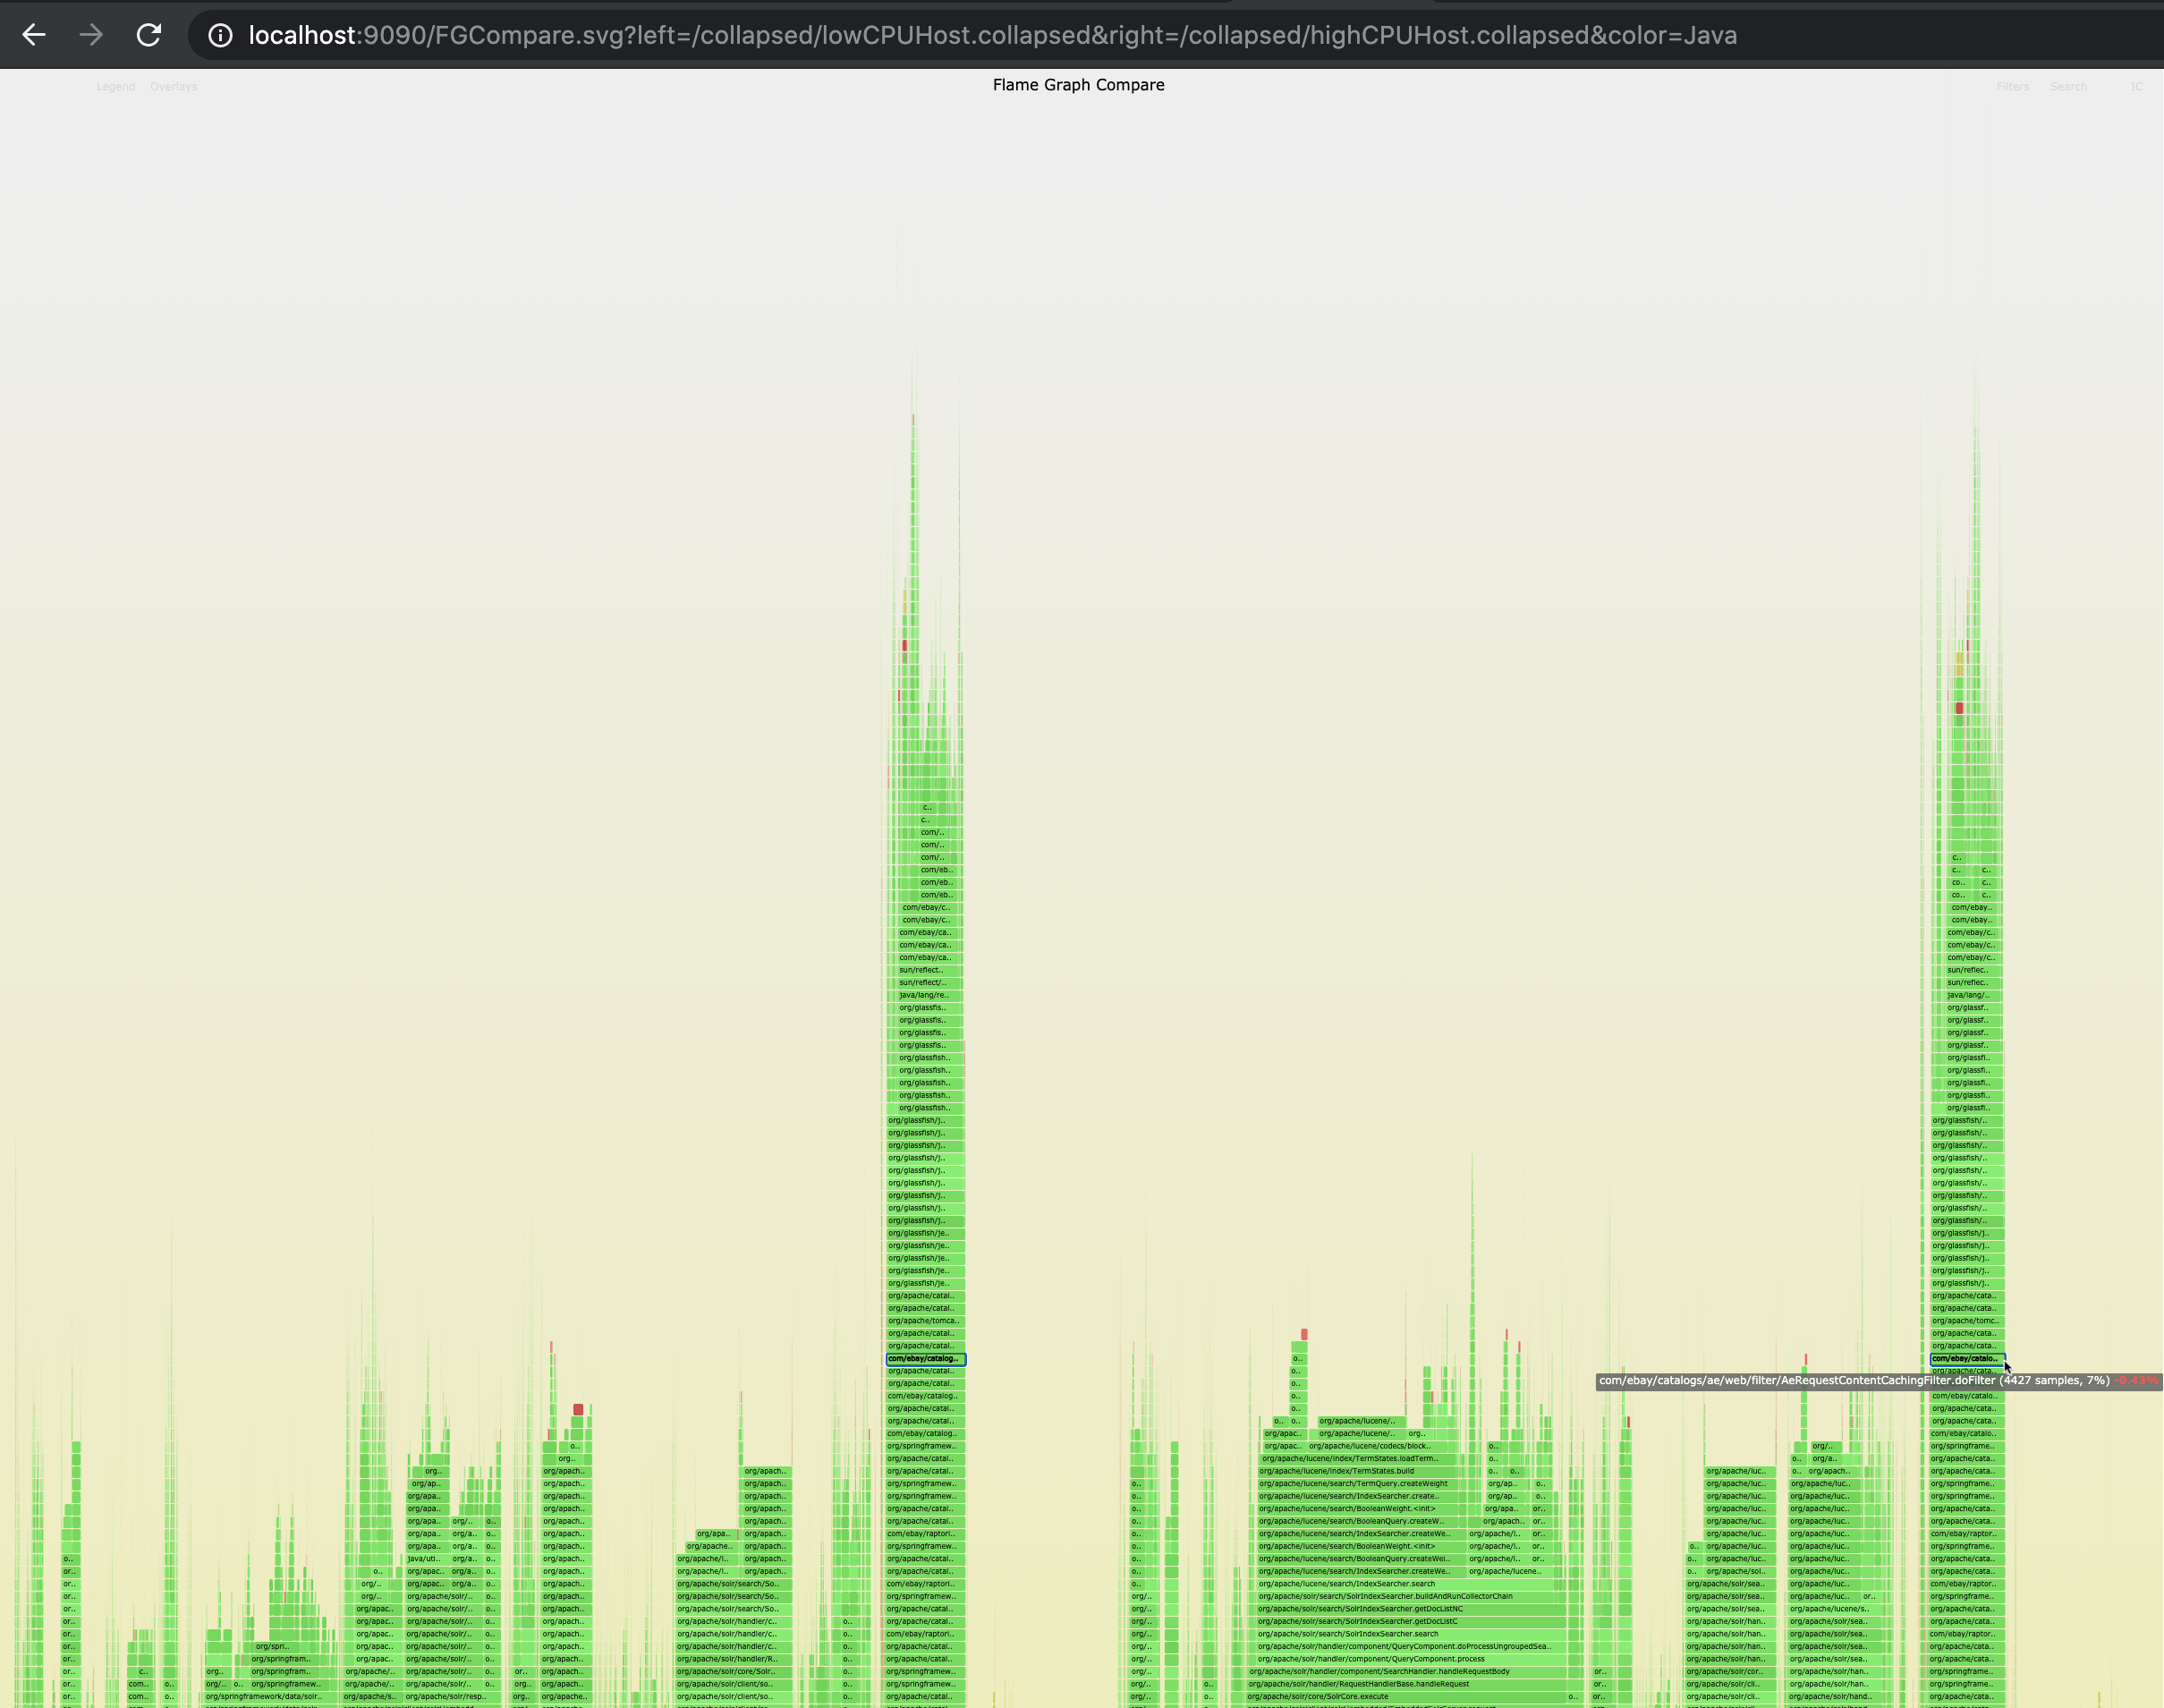
A view of Two FlameGraphs, left and right where the hovering, search and zoom capabilities are linked to both and allow the viewer to compare the two side by side.
Showing FlameGraph Comparison is done by requesting FGCompare.svg.
| Parameter | Description | Required |
|---|---|---|
| left | url of the left side collapsed stack file to visualize | yes |
| right | url of the right side collapsed stack file to visualize | yes |
| config | path to configuration file (default = fgrav.json) | no |
| color | set specific color scheme to use | no |
| frameFilter | set specific frame filter to use | no |
| width | set width for this visualization in pixels | no |
| height | set height for this visualization in pixels | no |
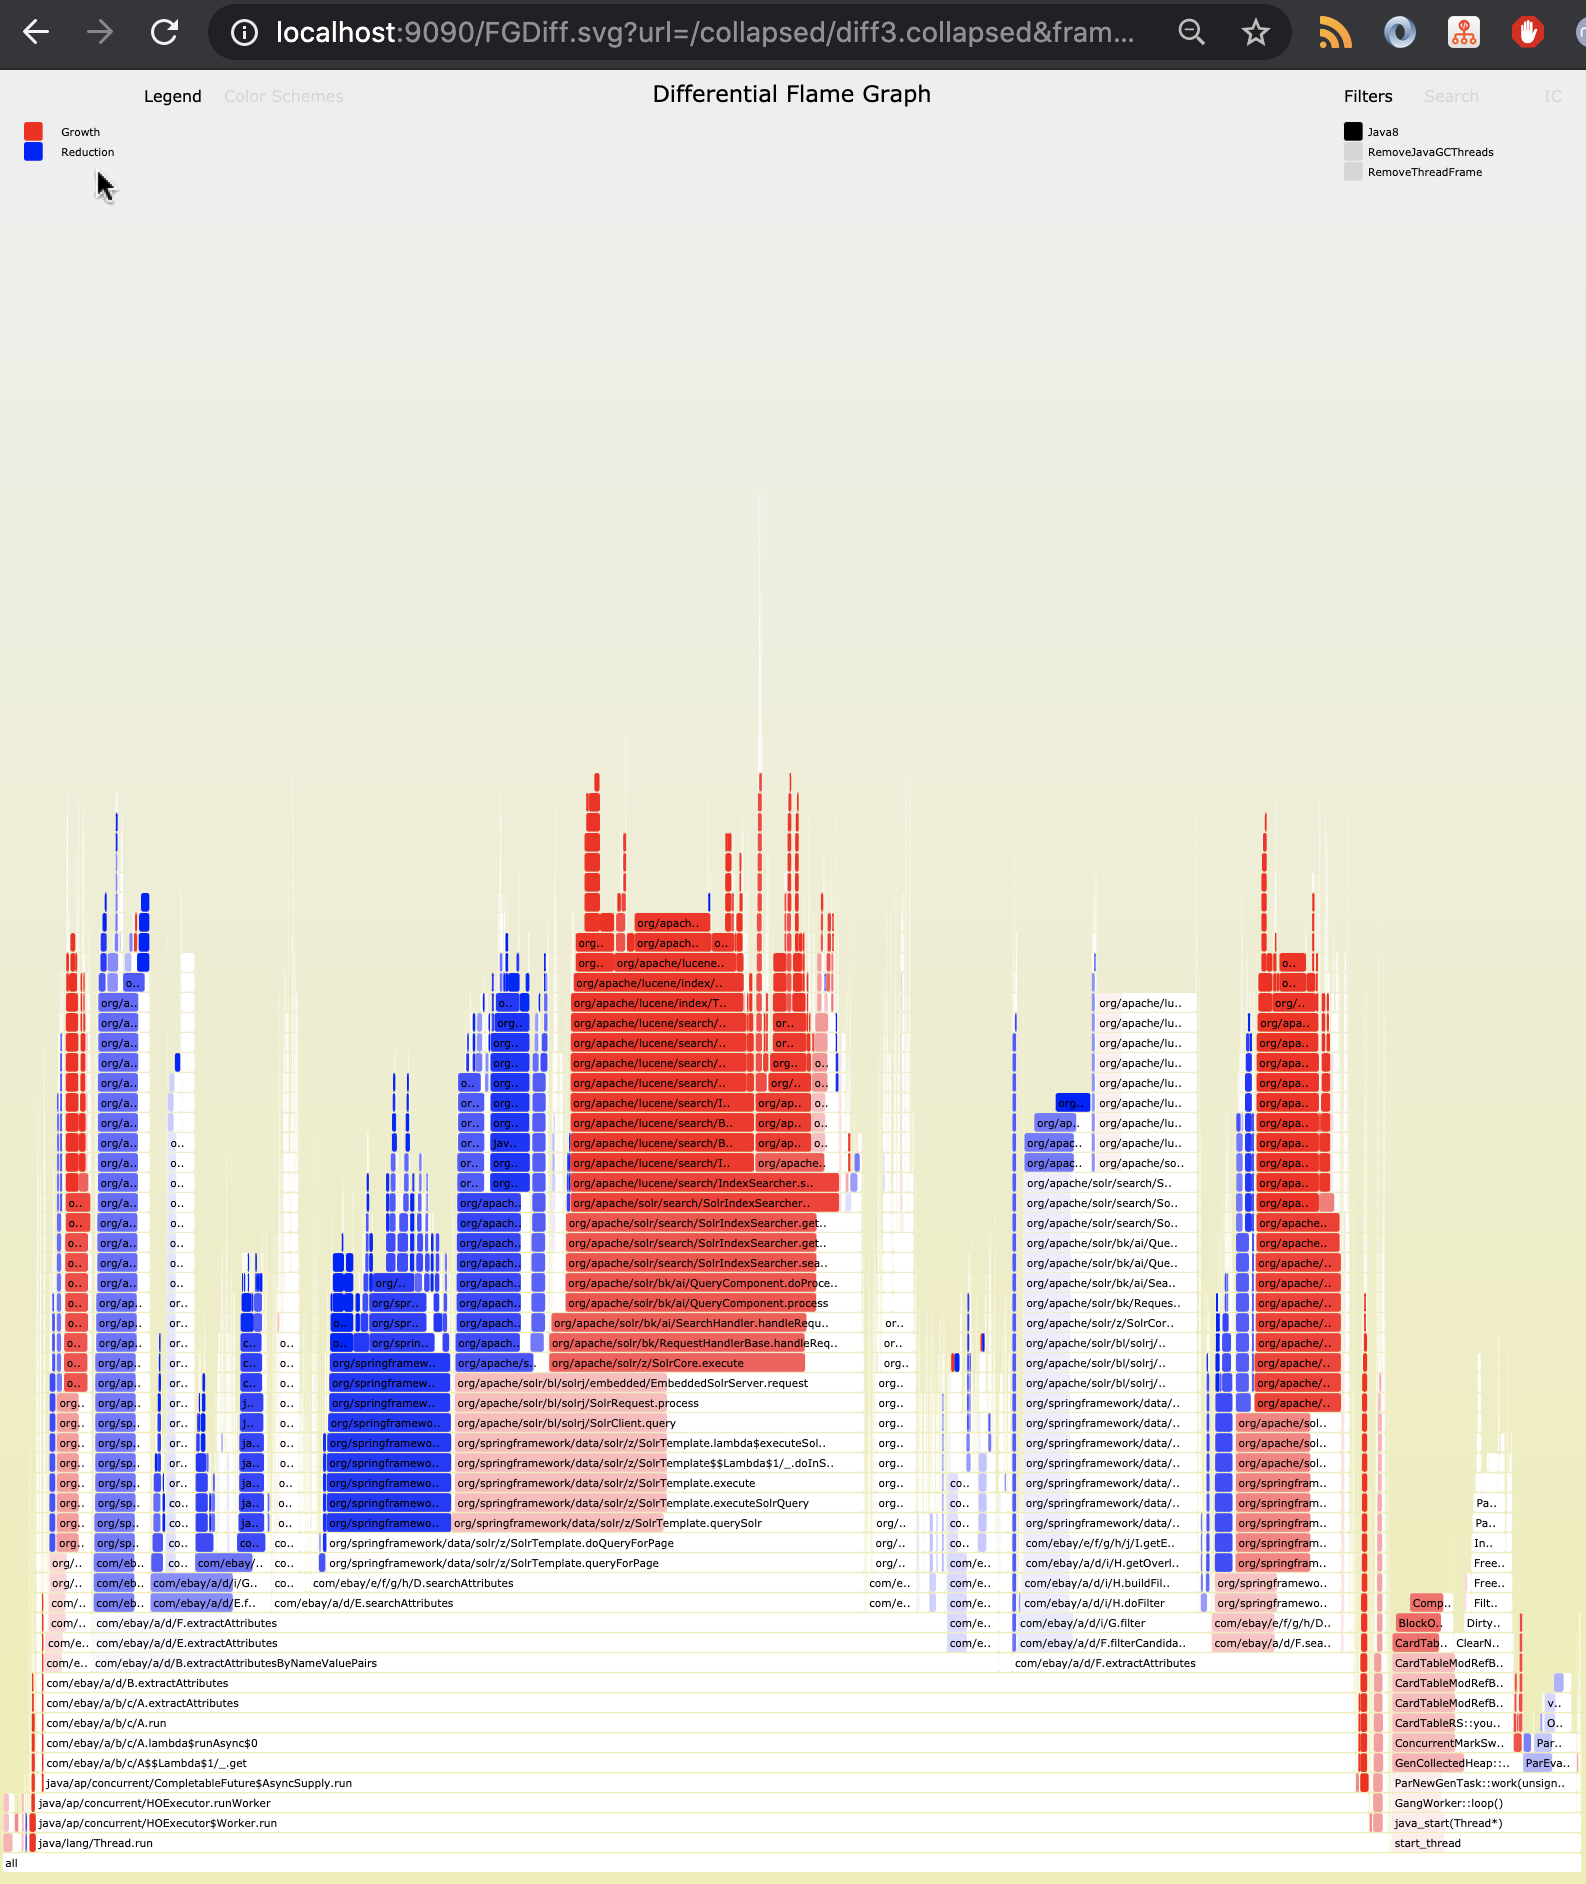
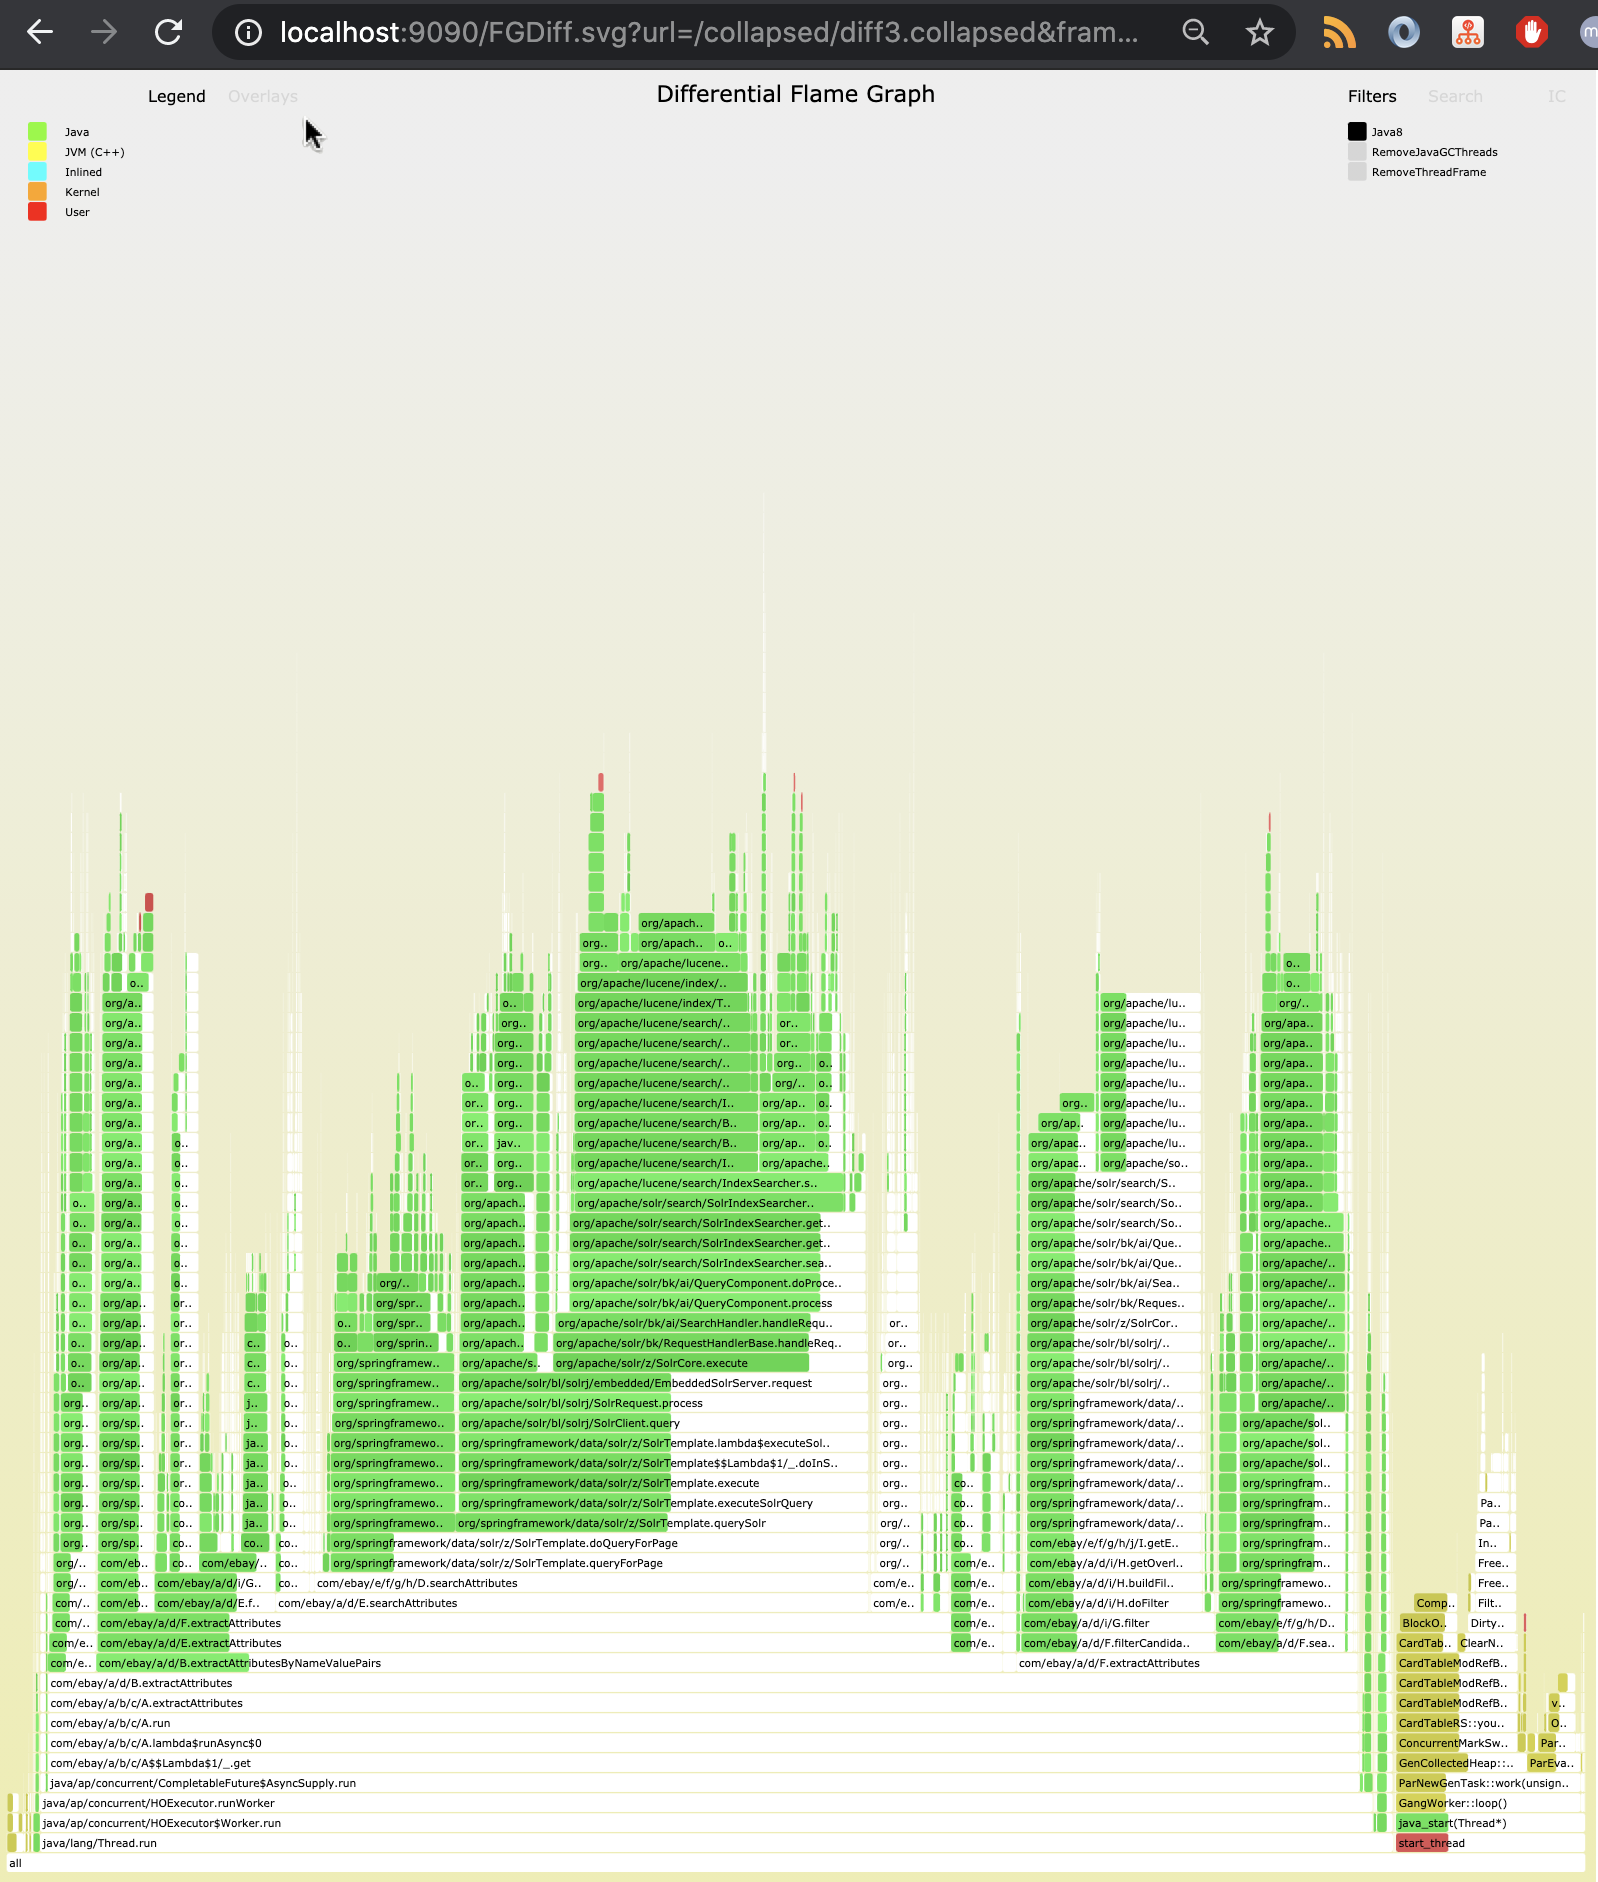
A Differential FlameGraph similar but with a lot more options to the one suggested by Brendan Gregg.
Like the original differential FlameGraph, this FlameGraph can also be generated from a collapsed stack file that contains two sample count values for every code path. See simplediff.collapsed for a simple example of such file.
However, our FlameGraph can also be generated from two separate regular collapsed files. It simply merges the code paths dynamically. This gives us much more flexibility and allows us to decides what to "diff" from the browser.
The original suggestion used the difference in measurements to color the frames (blue/red) but the FlameGraph that was drawn was according the second measurement.
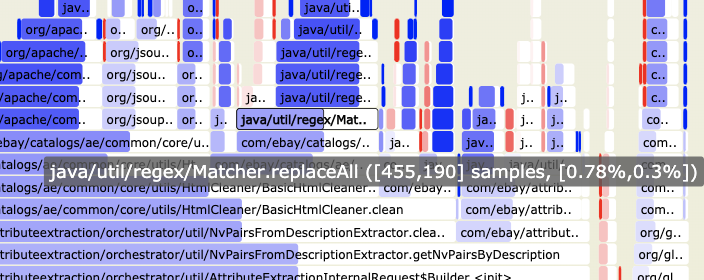
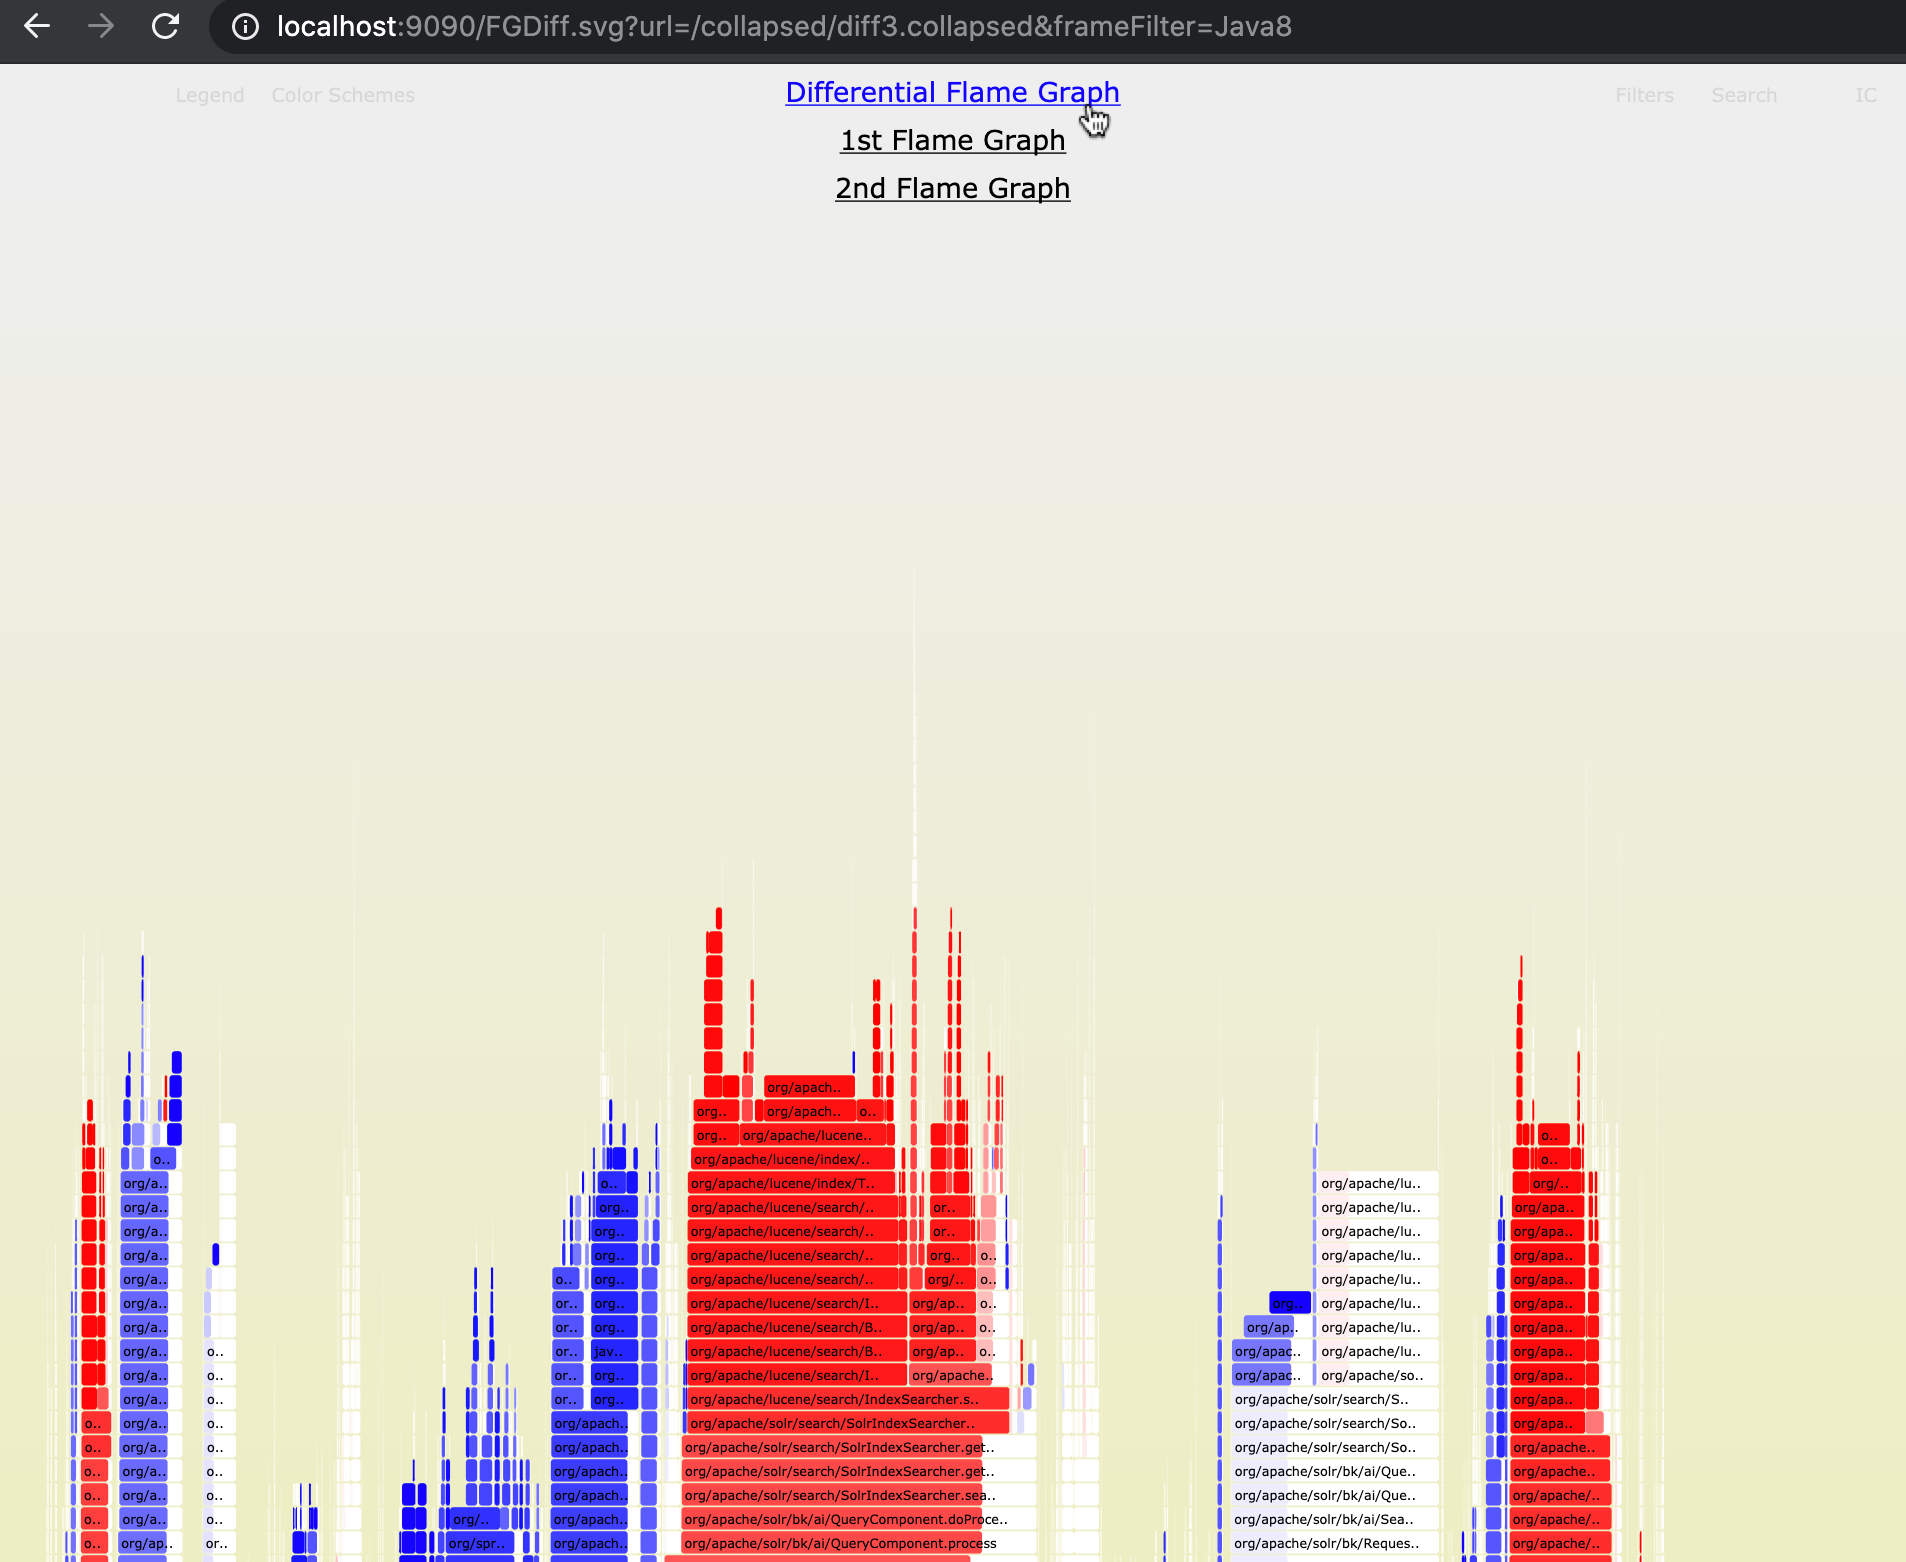
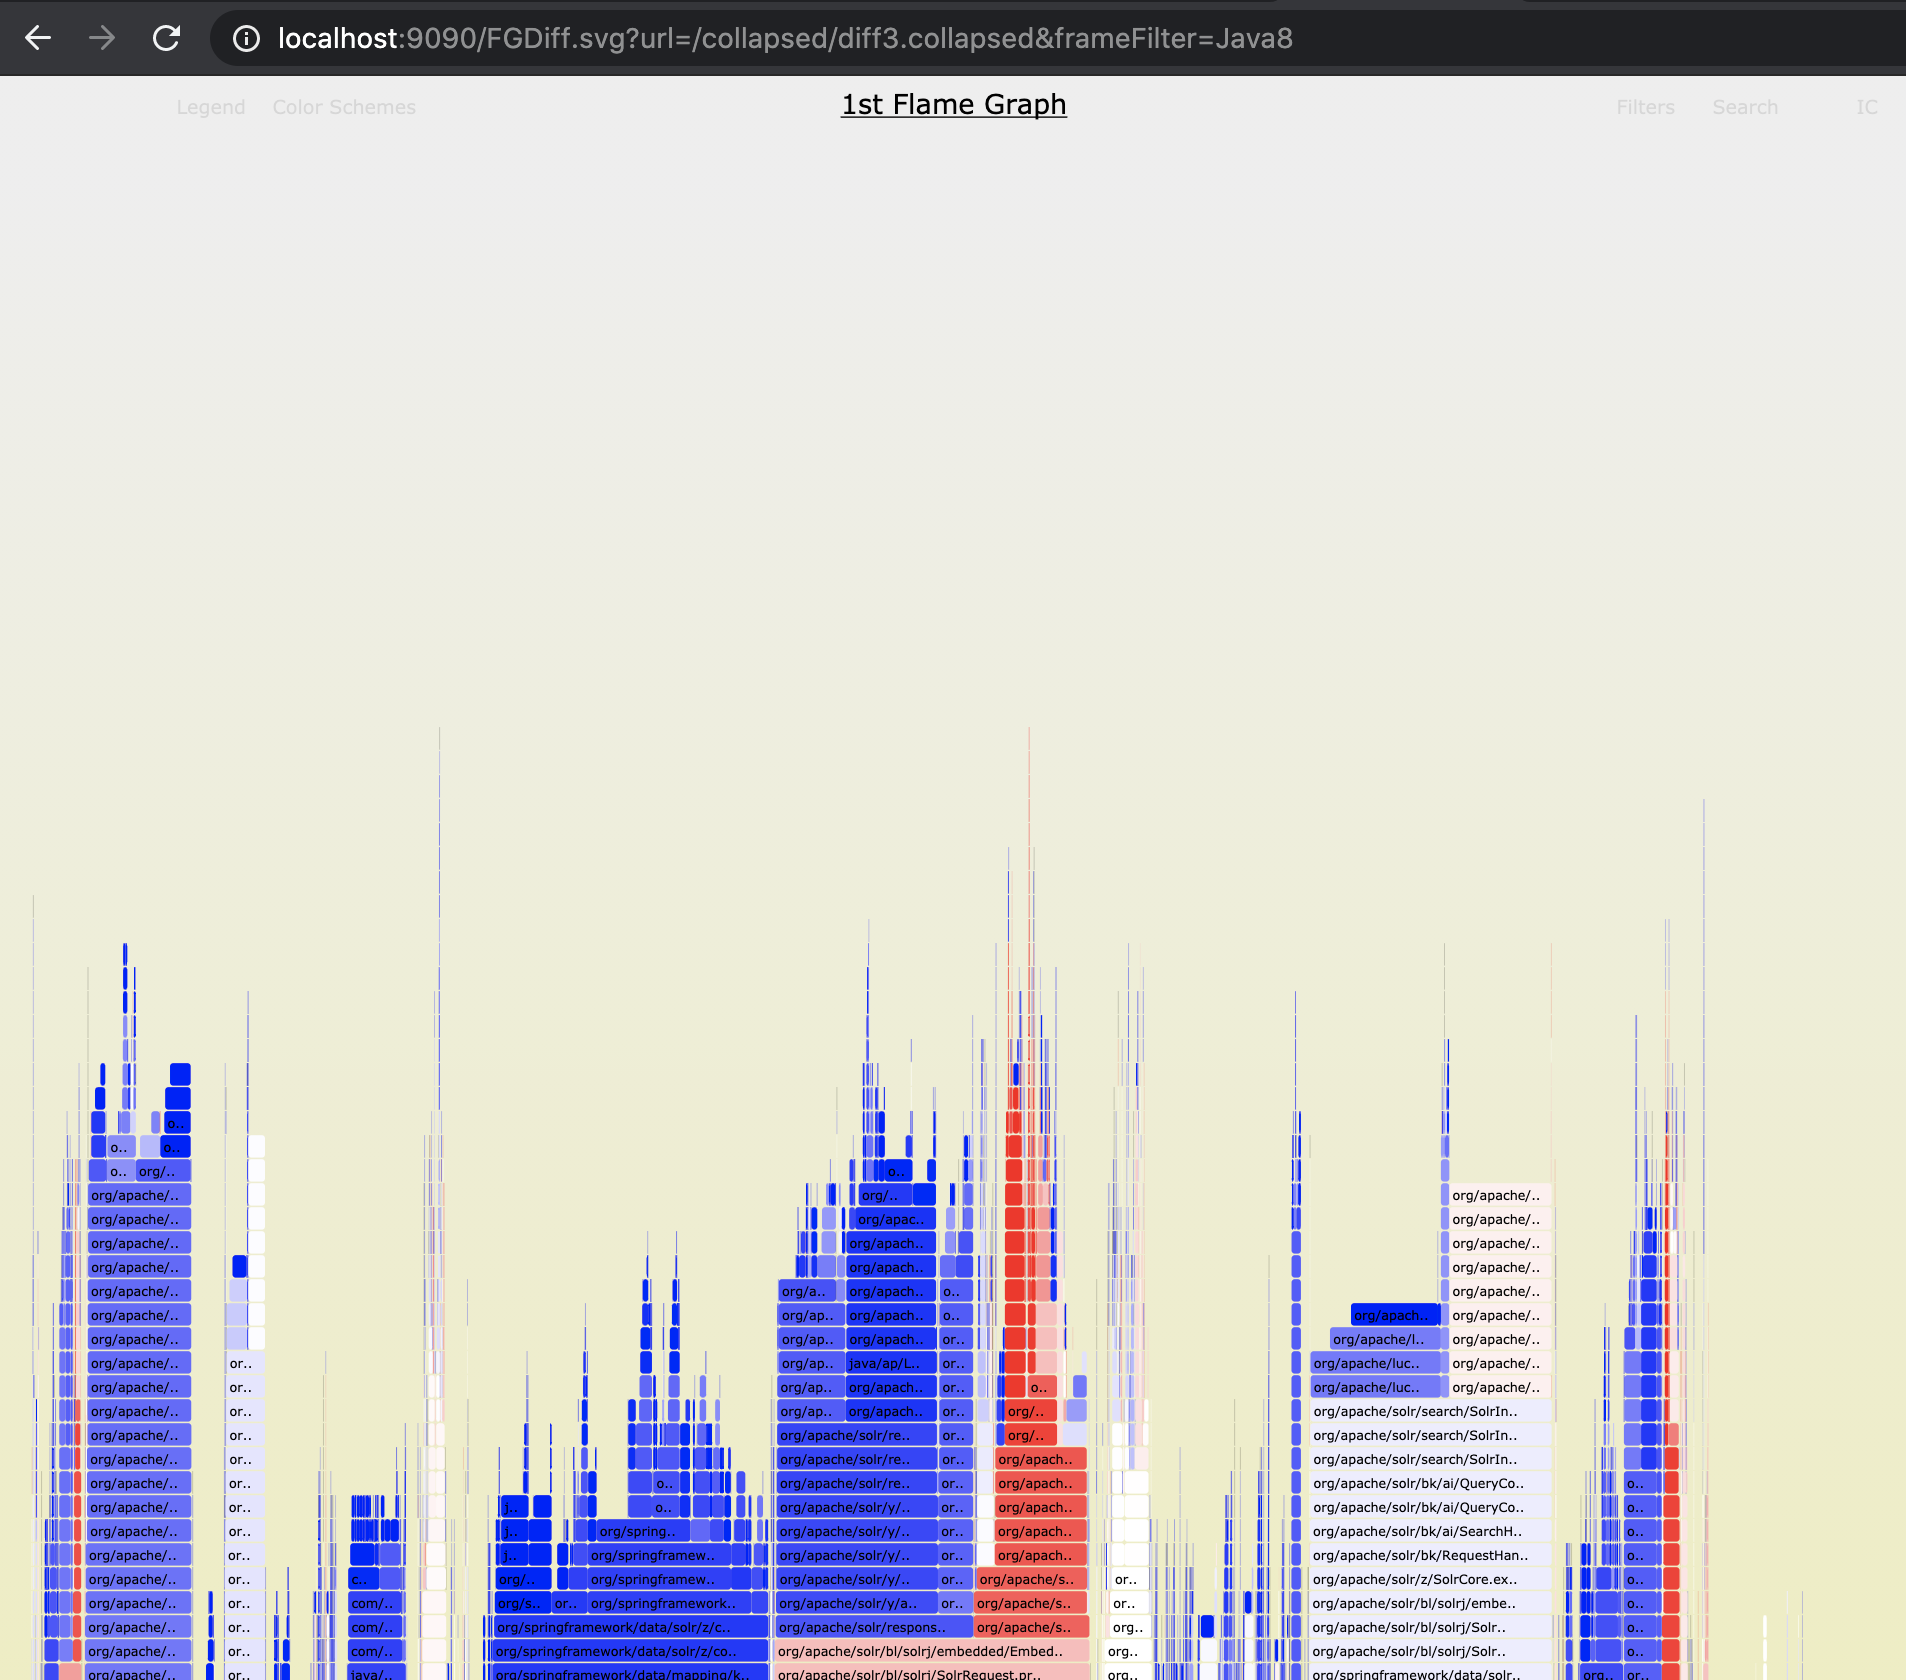
Our approach allows to choose dynamically between viewing the first, second graph or a graph which represent the sum of both measurements and can color only part of the frame to show the difference between the two measurements.
This allows us to:
- See the difference between the two measurements visually.
- Avoid having the blind spot of a frame which existed in the first measurement but was not measured at all in the second.
Showing Differential FlameGraph is done by requesting FGDiff.svg.
| Parameter | Description | Required |
|---|---|---|
| url | url of the differential collapsed stack file to visualize | unless 1st, 2nd used |
| 1st | url of first collapsed file in diff | (with 2nd) unless url used |
| 2nd | url of second collapsed file in diff | (with 1st) unless url used |
| config | path to configuration file (default = fgrav.json) | no |
| color | set specific color scheme to use (default = Diff) | no |
| frameFilter | set specific frame filter to use | no |
| width | set width for this visualization in pixels | no |
| height | set height for this visualization in pixels | no |
| visual-diff | if set to true, only relative part of frame is painted (default = true) | no |
| different-sides | if set to true (and visual-diff = true), paints relative growth from the right and relative reduction from the left (default = false) | no |
We can generate a Differential FlameGraph from two sources:
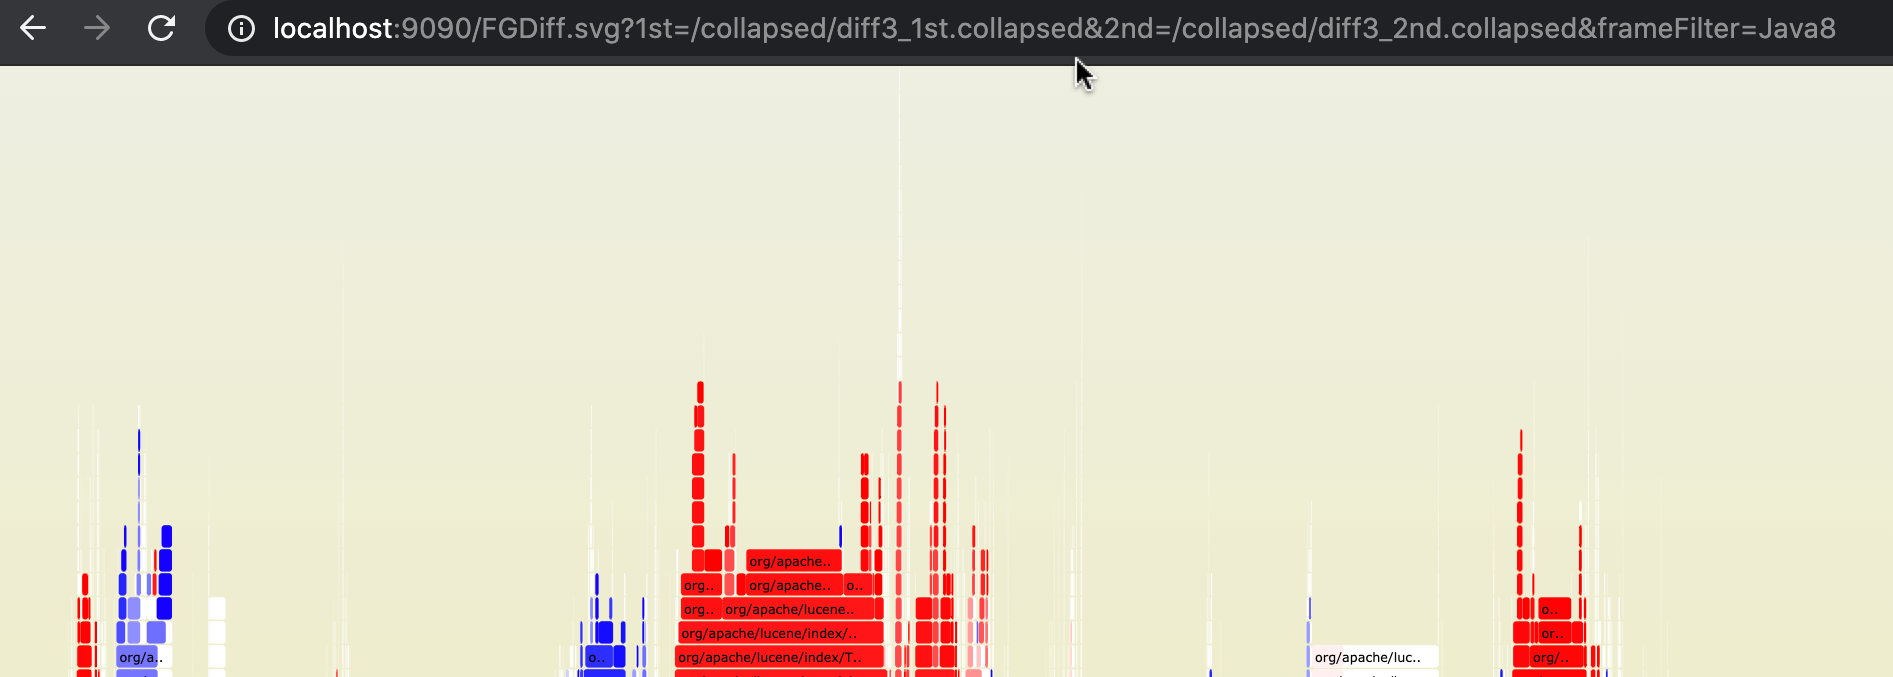
Selection between which graph to choose is done by clicking on the title:
After choosing the first graph, we get framges based on the first measurement:
The dynamic nature of the FGrav library also allows us to switch with one click between the "diff" color scheme and any other color scheme, for example:
Inspired by the github contributions calendar.
Show a calendar view with a color scheme and links to (probably) FlameGraphs that were taken on those days.
Showing a Calendar view is done by requesting CG.svg.
| Parameter | Description | Required |
|---|---|---|
| url | url of the calendar events json file to visualize. The json must be an array of objects which must contain the following fields: date, type, region, samples, url. see test example | yes |
| color | set specific color scheme to use | no |
| width | set width for this visualization in pixels | no |
| height | set height for this visualization in pixels | no |
This view can be used to show previously captured FlameGraphs for a specific process/service or instance of it by day.
Unlike a static SVG which was created with a pre-determined color scheme, FGrav FlameGraphs SVG visualization is built to work in the browser and therefore we can control and modify the color scheme, and easily see the same data with a different scheme, which allows different view points to the same data.
color scheme is implemented as an object with function
function colorFor(frame, totalSamples)
from a frame object and optional number of samples to a string that represent a color e.g.
"red" or "rgb(" + r + "," + g + "," + b + ")"
A utility function in FGravDraw.js
function colorValueFor(palette, name, value)
can be used to generate color values from a palette (supported values: "red", "green", "blue", "yellow", "purple", "aqua", "orange") and optional name, value which are used to generate a consistent shade = variance to the color where it will have the exact same shade for the same name / value.
Color schemes can be configured via an HTTP request parameter (to the Flamegraph) and/or configuration.
All FlameGraph SVG files accept parameter color as the name/path of the color scheme.
If color parameter is provided, on FG*.svg files, the code will attempt to load a JS file js/color/FG_Color_${color}.js where ${color} is the value of the color parameter.
If that value started with a / then the code assumes this is a full path for the JS file and tries to load it.
If no color parameter is defined on the HTTP request then 'Default' color scheme is used. The default color scheme for the differential Flame graph is 'Diff' (red for growth, blue for reduction). For the other visualizations, the default color scheme is 'Clear' (i.e. no color = white).
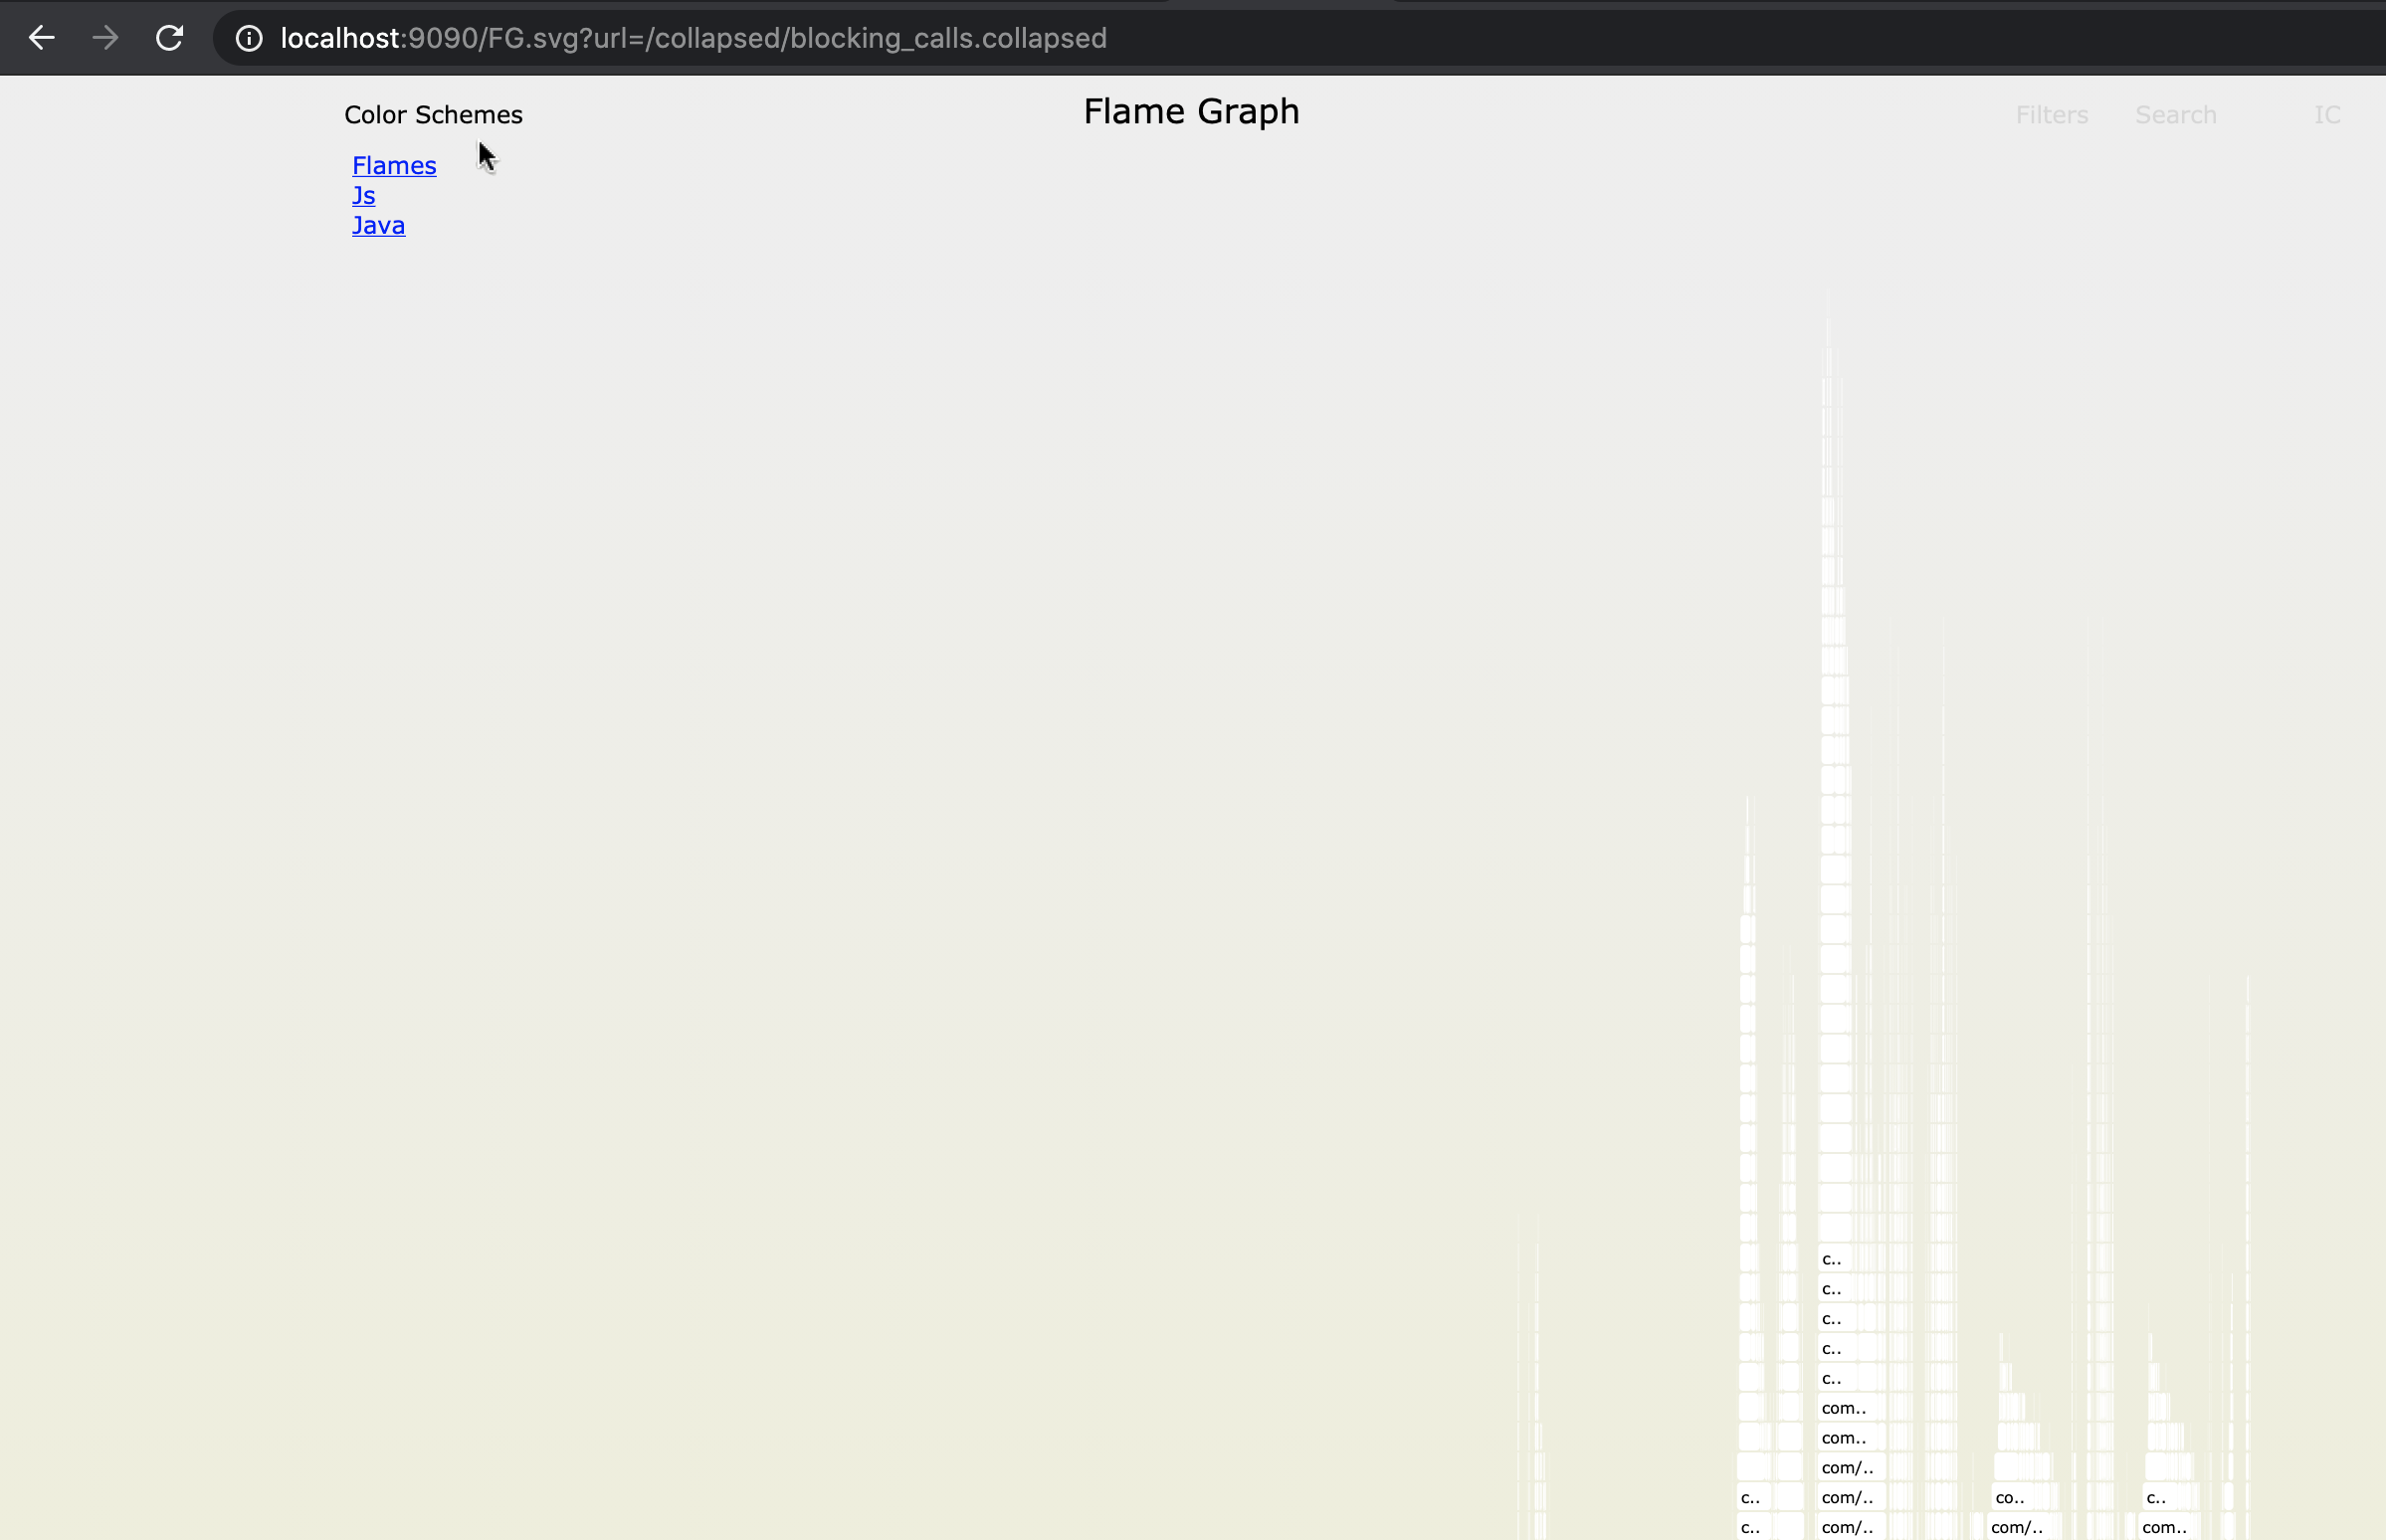
- Flames - Random color scheme similar to the one used in original Flamegraph project.
- Java - Java specific color scheme
- Js - Javascript specific color scheme
- Diff - Color scheme for "growth" / "reduction" in frame
- Clear - default. No color = "white".
To build a custom color scheme, simply implement your own color scheme JS object (extend FG_Color).
Built-in color schemes can serve as an example of how to implement a color scheme JS file.
It must contain a function that returns the color given the frame and number of samples.
You can also optionally define a legend for your color scheme by setting an object (map of color to name) to this.legend.
Loading the color scheme JS file can be done by either:
- name your JS file using the following convention pattern used for built-in functions (i.e.
js/color/FG_Color_${my_color}.js) then dynamically request theFG*.svgfile with parametercolor=${my_color}. - name your JS file to any name you want and request the
FG*.svgfile with parametercolor=/${my_color}(where/${my_color}is the path to your file) Note/at start of parameter value.
An additional feature on top of the custom FlameGraph layout born out of the ability to dynamically switch between color schemes.
You can specify a legend for any color scheme by setting colorScheme.legend with a legend object e.g.:
colorScheme.legend = {
    lawngreen: 'Java',
    yellow: 'JVM (C++)',
    aqua: 'Inlined',
    orange: 'Kernel',
    red: 'User'
};
See Java color scheme for an example.
The legend is hidden by default but can be toggled by clicking on the legend button.
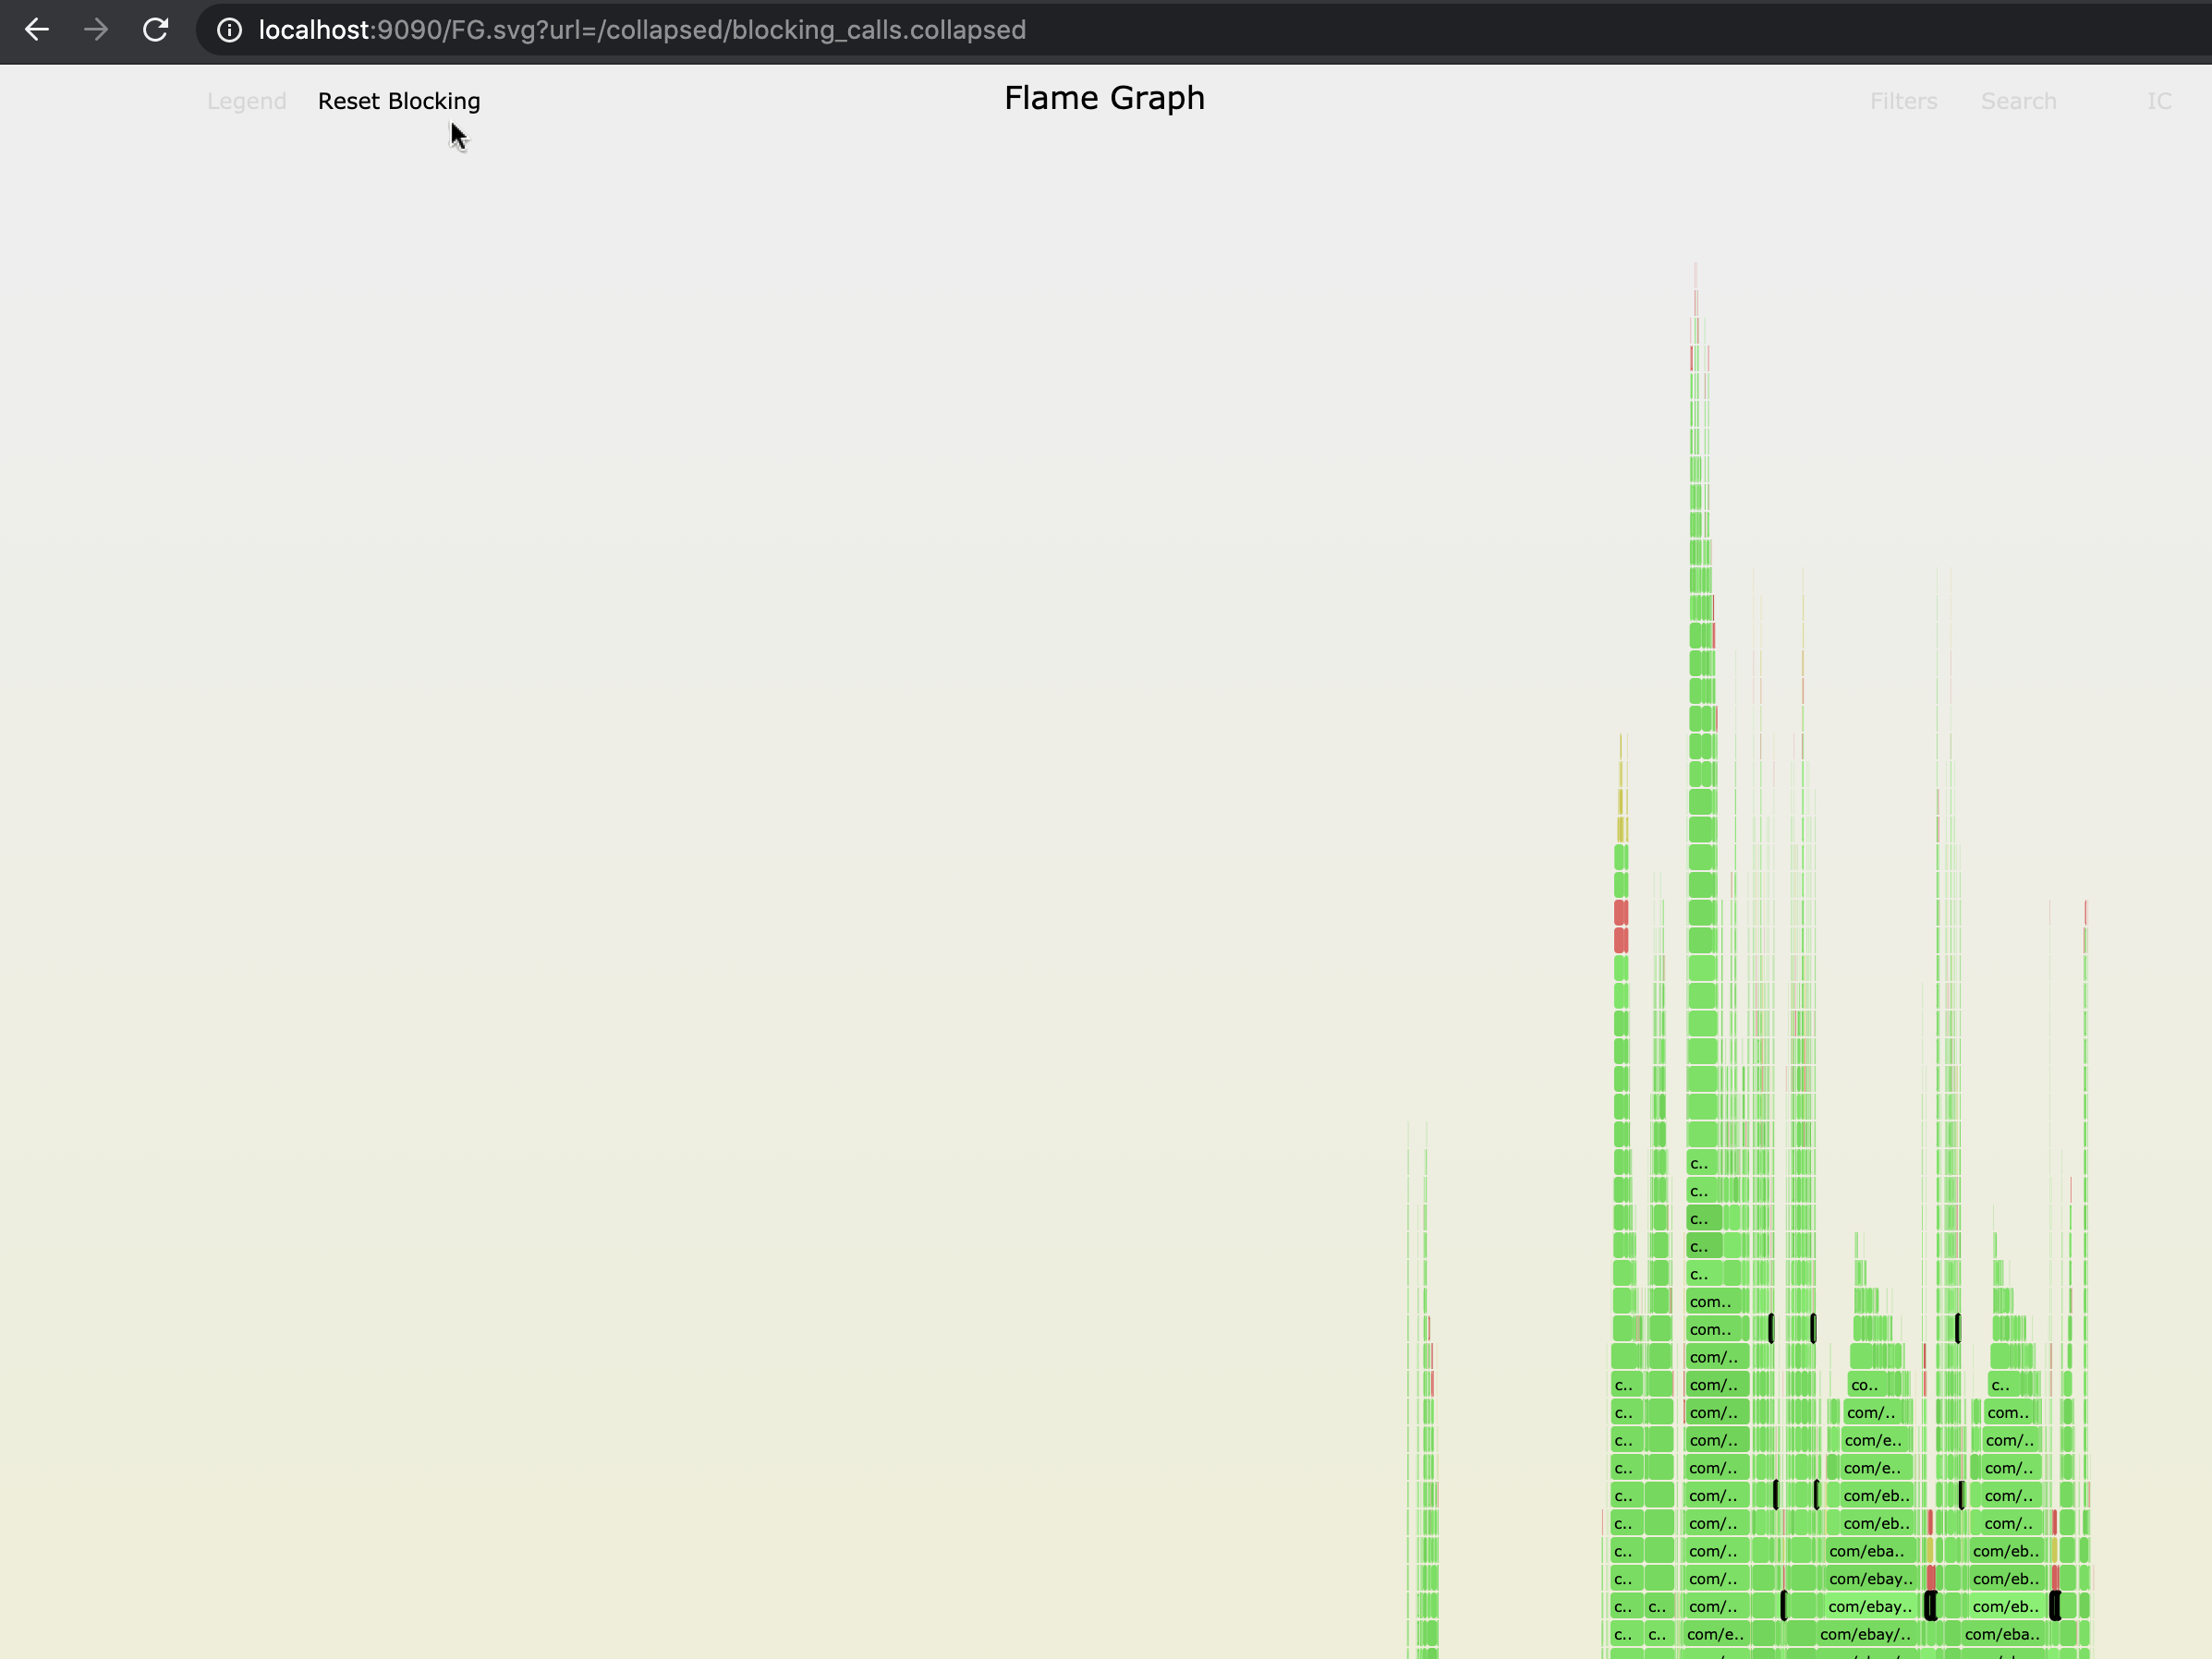
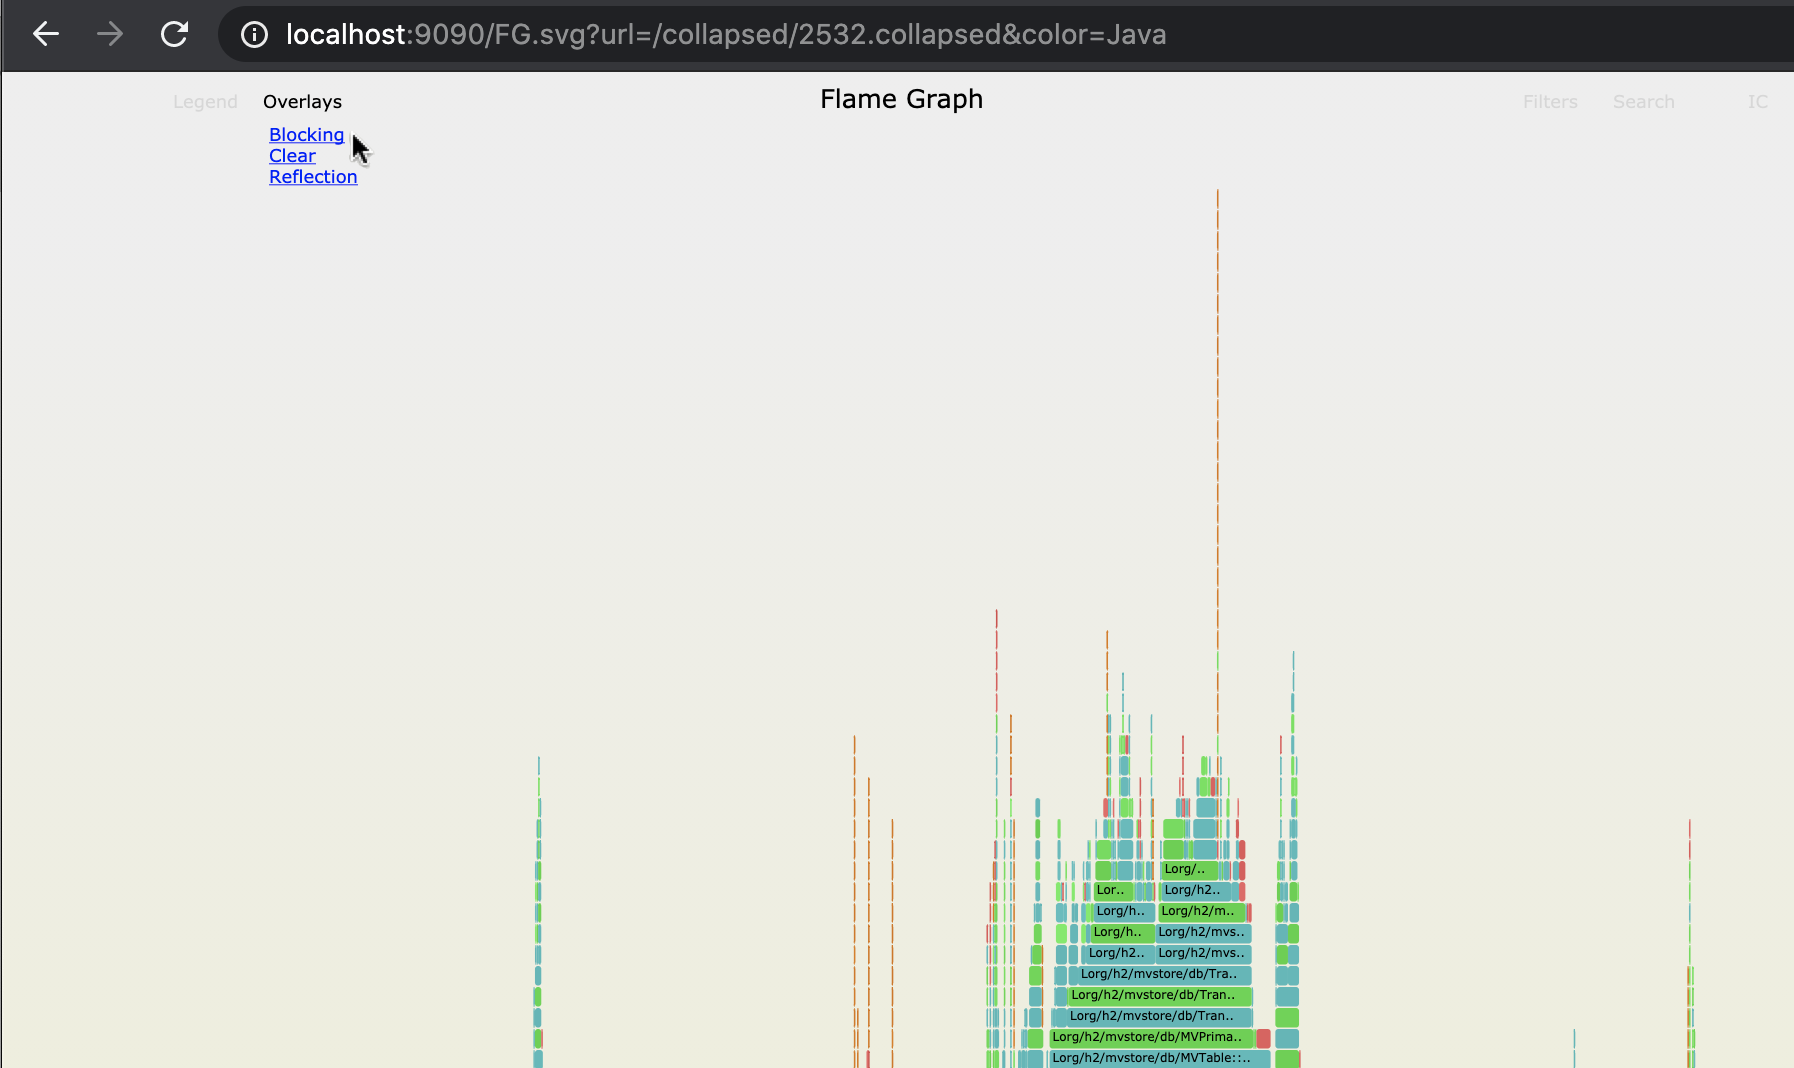
Color schemes can have overlays. This is a dynamic ability to highlight specific frames in the context of a particular scheme (or simply style some frames in a different way).
You can think of an overlay as an extended pre-defined search query that allows the user to highlight parts of the Flamegraph. Because overlays are defined as a Javascript function, they can be much more powerful than a search regex. (They can even involve external data). They can also be easier to write, and of course they can be shared among users. Because overlays are dynamic, specific overlays for your specific code can be easily integrated into the visualization.
Note that color schemes themselves can be overlays to other color schemes (which for example, allows us to switch between differential color scheme and language specific color schemes in the Differential Flamegraph).
In order to allow other configured color schemes to overlay on top of a specific color scheme, we must set its colorsAsOverlays field to true.
See Flames color scheme for an example.
If we allow other color schemes to overlay on top of our current scheme, the menu button is named Color Schemes instead of Overlays.
See Java_Blocking overlay as an example for an overlay to highlight Java blocking code.
Choose an overlay from a drop down menu by clicking on the Color Schemes / Overlays button:
Dynamic Frame filter is a function called when parsing the collapsed stack file to separate code paths.
It can be used to filter entire paths or manipulate the code path / stack trace before calculating the FlameGraph structure.
FGrav allows a user to define multiple frame filters for any FlameGraph.
All FGrav SVG files accept an optional parameter frameFilter as a comma separated list of names/paths of the filters to use.
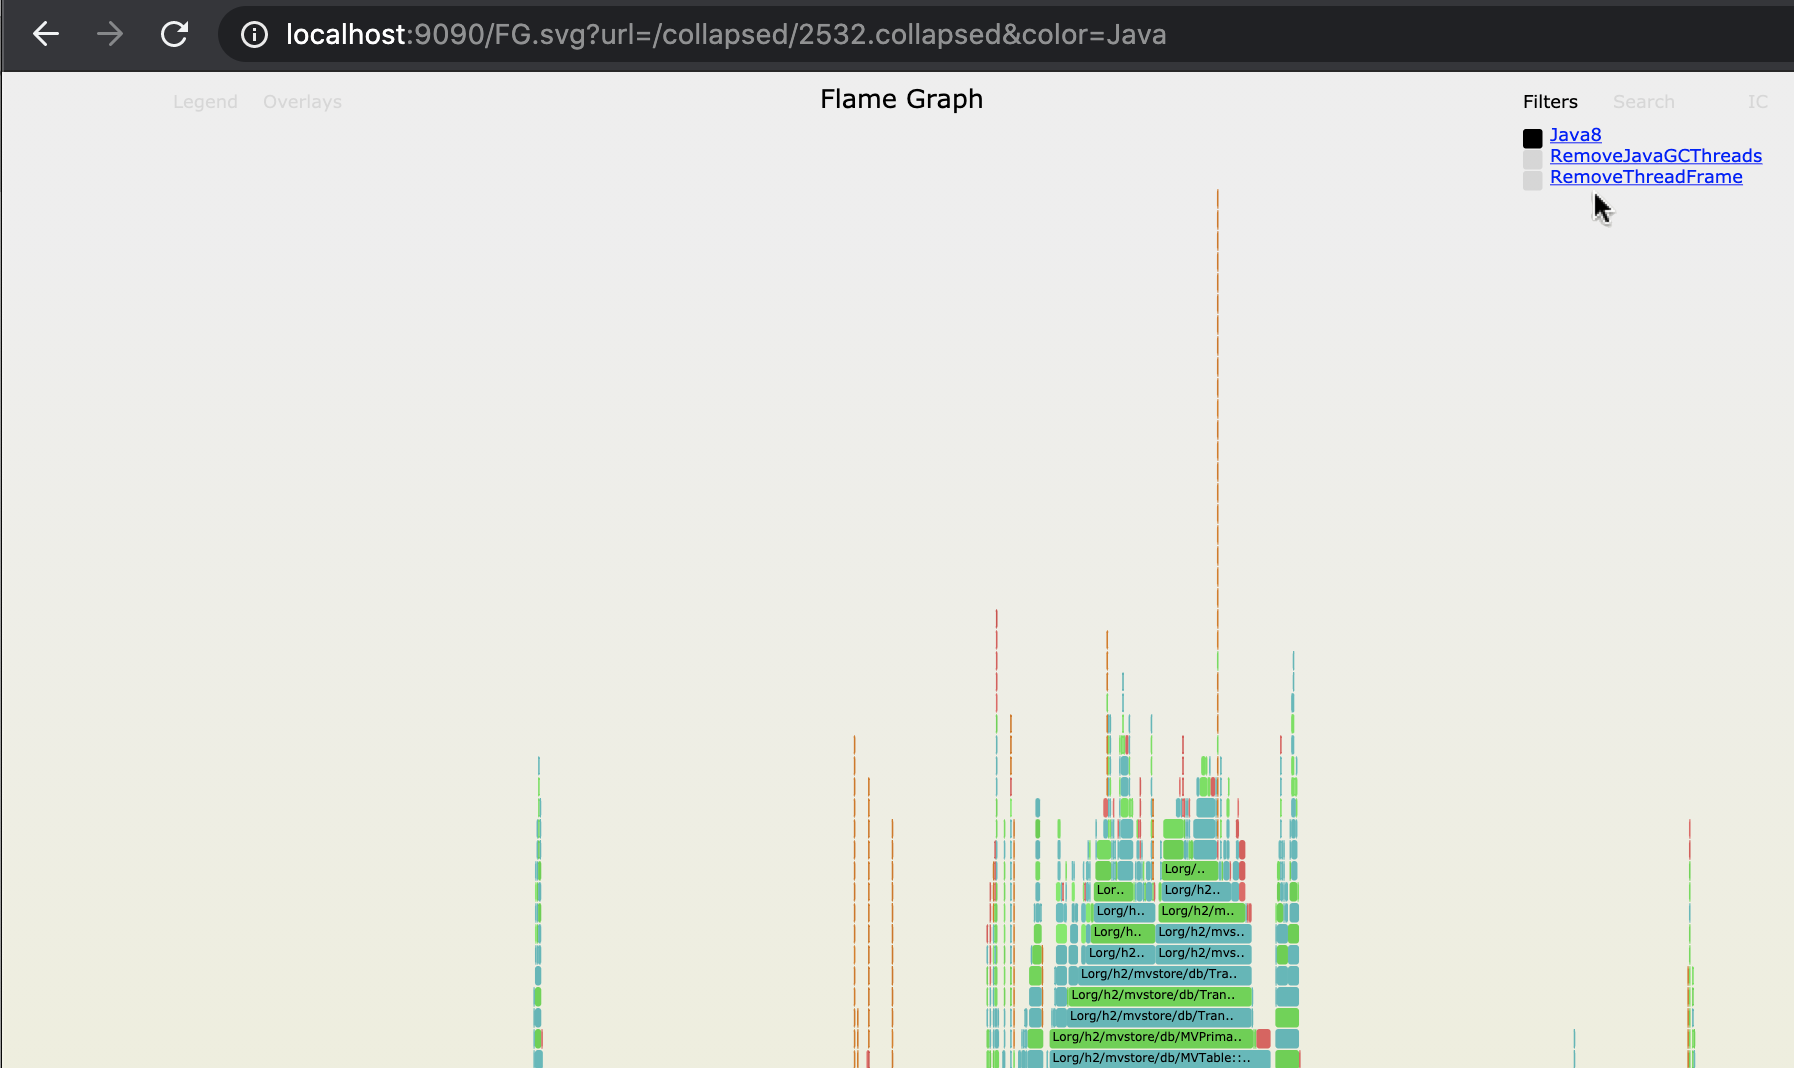
We can also choose to turn filters on or off from the Filters drop down menu.
- Java8 - Attempts to solve issue happening in Java 8+ when using
-XX:+UnlockDiagnosticVMOptions -XX:+ShowHiddenFramesin Java. Without it you will not see lambdas as part of the stack trace, with those flags lambdas will show up as frames but it also assigns arbitrary numbers to lambdas which turn many occurrences of the same lambda code to show up in the stack trace as different frames. This frame filter will remove that arbitrary number causing the FlameGraph to show all those lambdas as the same frame. This is incredibly important in comparisons visualizations and aggregations. - RemoveJavaGCThreads - Removes all code paths related to running of Java GC processes.
- RemoveThreadFrame - Removes the thread frame (first frame of any code path) which will consolidate all common paths from different threads into the same flame.
Just like the built-in filters, users can write their own filters in a JS file and load it.
Loading the filter JS file can be done by either:
- Use the convention pattern used for built-in functions (i.e.
js/frame/FG_Filter_${my_filter}.js). - Name your JS file to any name you want and request the
FG*.svgfile with parameterframeFilter=/${my_filter_path}(where/${my_filter_path}is the path to your JS file with an object with the same name and a functionfilter) Note/at start of parameter value.
FGrav must have a configuration file with the configuration of color schemes, frame filters and overlays.
This is done via a json file which any visualization can load.
The default file is fgrav.json which configures the in-built color schemes, overlays and filters.
You can modify it or use a different file by passing its path in the config request parameter.
Using the configuration file you can define the URI path to color schemes + frame filters by name and define which overlays should belong to which color scheme.
Deploy all src files and libs to an http server.
You can use deploy.sh as an example which will create a directory called web and copy all files to it. You can then run an http server via docker with serve.sh. (Note: port is configured to 9090 in the script. Feel free to change)
Once the http server is up, request an SVG file from it on a browser.
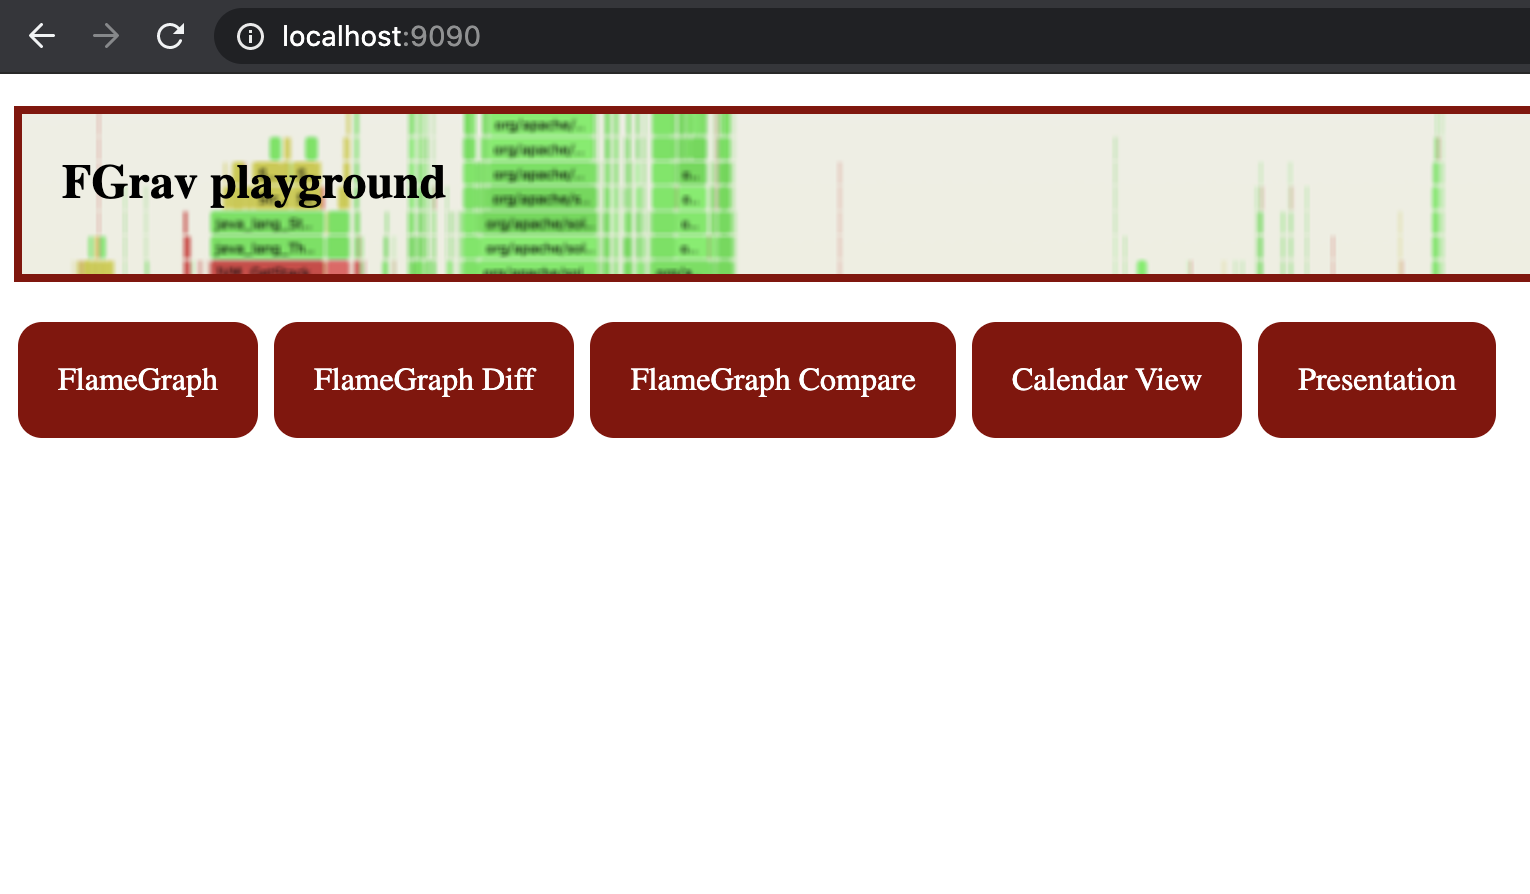
You can use FGrav playground page to construct requests.
FGrav playground page is the default root page. http://${host}:${port}/
FGrav playground page helps you build FGrav visualizations.
You can also build the URL yourself. Here are templates for some URL examples:
http://${host}:${port}/FG.svg?url=${raw-file}
http://${host}:${port}/FG.svg?url=${raw-file}&color=Java
http://${host}:${port}/FG.svg?url=${raw-file}&color=Java&frameFilter=Java8,RemoveJavaGCThreads
http://${host}:${port}/FG.svg?url=${raw-file}&color=${custom-color-scheme}&frameFilter=${custom-frame-filters}
http://${host}:${port}/FGCompare.svg?left=${raw-file1}&right=${raw-file2}
http://${host}:${port}/FGCompare.svg?left=${raw-file1}&right=${raw-file2}&color=Java
http://${host}:${port}/FGCompare.svg?left=${raw-file1}&right=${raw-file2}&color=Java&frameFilter=Java8,RemoveJavaGCThreads
http://${host}:${port}/FGCompare.svg?left=${raw-file1}&right=${raw-file2}&color=${custom-color-scheme}&frameFilter=${custom-frame-filters}
http://${host}:${port}/FGDiff.svg?url=${diff-raw-file}
http://${host}:${port}/FGDiff.svg?url=${diff-raw-file}&color=Diff
http://${host}:${port}/FGDiff.svg?url=${diff-raw-file}&color=Java&frameFilter=Java8,RemoveJavaGCThreads
http://${host}:${port}/FGDiff.svg?url=${diff-raw-file}&color=${custom-color-scheme}&frameFilter=${custom-frame-filters}
###Presentation material
You can also see a presentation about FGrav (which uses reveal.js to show real live Flamegraphs) on your browser in http://${host}:${port}/presentation/index.html
###Presentations
5 minute overview of FGrav at TLV community summit (English) - Youtube
github repo is tested using TravisCI.
All logic is tested using Jasmine.
We use the core jasmine library and its jasmine-ajax extension.
To run the Jasmine tests we use karma as our test runner with HeadlessChrome as the browser. All config is found in:
To run tests from a fresh clone using npm package manager run:
npm installnpm i --save-dev karma karma-chrome-launcher karma-cli karma-jasmine jasmine-ajax$(npm bin)/karma init// follow instructionsnpm test
Copyright 2021 eBay Inc.
Licensed under the Apache License, Version 2.0 (the "License"); you may not use this file except in compliance with the License. You may obtain a copy of the License at
https://www.apache.org/licenses/LICENSE-2.0
Unless required by applicable law or agreed to in writing, software distributed under the License is distributed on an "AS IS" BASIS, WITHOUT WARRANTIES OR CONDITIONS OF ANY KIND, either express or implied. See the License for the specific language governing permissions and limitations under the License.
