TS_PLAT_API
This project allows to access Tradestation Data through the GlobalDictionary. Thank you to JohnR@TS for providing the Global dictionary example used to create this.
The python code must be run together with an EasyLanguage indicator that acts as a proxy (see TS_files).
Please use at your own risk. It is still work in progress and relies heavily in COM objects where improper shutdown can lead to TS platform uninteded consequences.
Configuration
Tradestation
-
Create an indicator using the code from ts_plat_api.el
-
Apply this indicator to any chart. In order to avoid work duplication or conflicts make sure to run it only once. It will throw an exception if it is used more than once.
Python
In order to run the project the following external packages are used:
-
GlobalDictionary: This file requires that win32com (pywin32) be installed in your environment.
Steps to install pywin32:
- Start a command line with administrator rights
- python -m pip install pywin32
- python pywin32_postinstall.py -install
The location of pywin32_postinstall.py in my environment for example was:
~\AppData\Local\Programs\Python\Python38-32\Scripts\pywin32_postinstall.py
Python 3.8.0 (tags/v3.8.0:fa919fd, Oct 14 2019, 19:21:23)
-
Reactive Extensions (RxPy3)
- pip install RxPy3
-
FinPlot (for the chart):
- pip install finplot
-
Debugpy (to create code breakpoints in multiple threads):
- pip install debugpy
-
Other python packages
- pip install pandas
Take it for a spin
-
run ts_plat_api indicator in a chart in Tradestation first (any symbol, any timeframe, any session available in the platform)
-
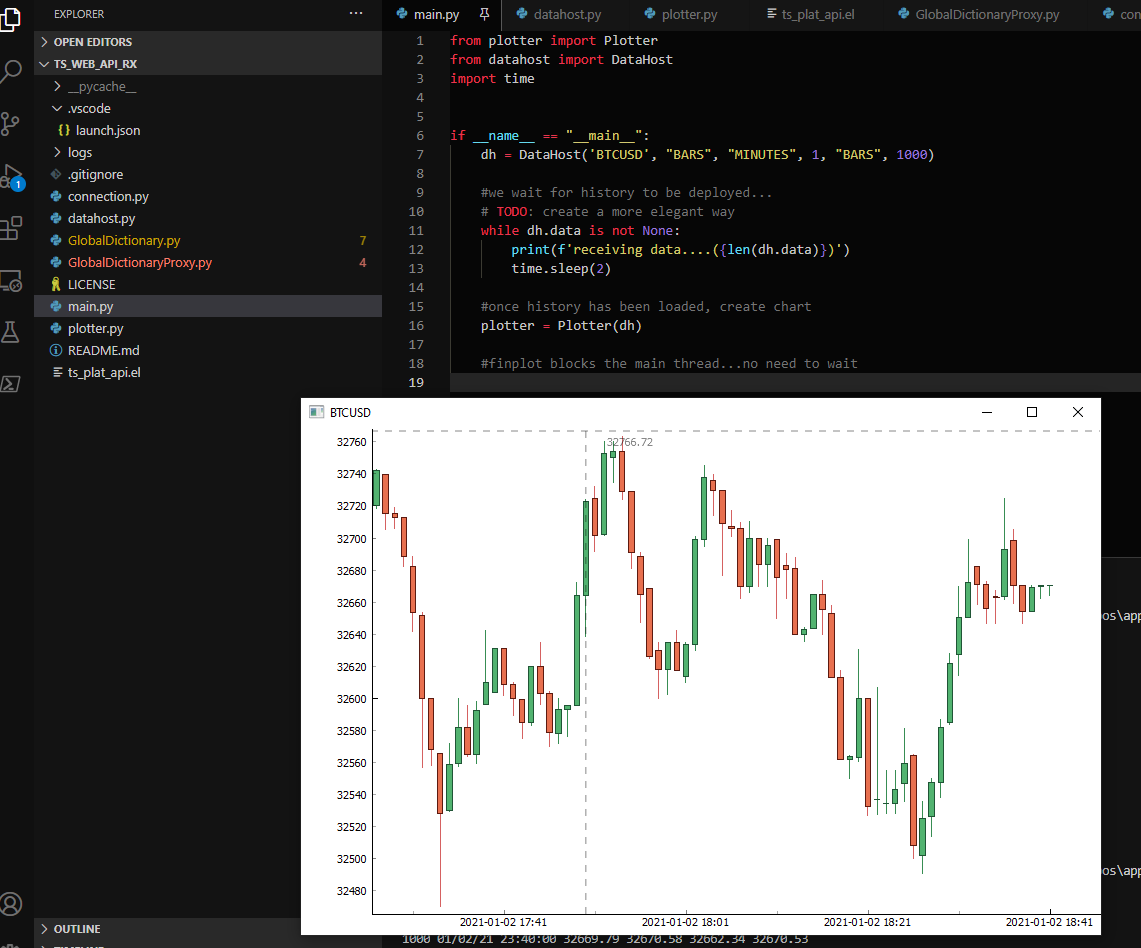
run main.py in python
main.py code
from plotter import Plotter
from datahost import DataHost
import time

if __name__ == "__main__":
    # parameters   symbol, chart_type, interval_type, unit, range_type, range_value, session = ""
    dh = DataHost('BTCUSD', "BARS", "MINUTES", 1, "BARS", 1000)

    #we wait for history to be deployed...
    # TODO: create a more elegant way
    while dh.data is not None:
        print(f'receiving data....({len(dh.data)})')
        time.sleep(2)

    #once history has been loaded, create chart
    plotter = Plotter(dh)

    #finplot blocks the main thread...no need to wait