Given an ML-II (derivation II) ECG signal, this module detects its R-peaks and return a prediction for each beat.
The classes used in this module follow the standard AAMI-Recomendations:
| Class | N | SVEB | VEB | F | Q |
|---|---|---|---|---|---|
| id | 0 | 1 | 2 | 3 | 4 |
N: Normal
SVEB: Supraventricular
VEB: Ventricular Ectopic Beat
F: Fusion
Q: unknown beat
Go to python subdir and run:
python example.py ../data/220.csv
The file example.py show a complete example of classification of ECG signals (corresponding to ML-II).
First of all we need to load the data:
ecg_signal, fs, min_A, max_A, n_bits = load_signal(sys.argv[1])Later a QRS detector is applied on the signal:
qrs_detector = QRSDetectorOffline(ecg_data_raw = ecg_signal, fs = fs, verbose=False, plot_data=False, show_plot=False)The method QRSDetectorOffline detects the R-peaks of the input ECG signal (ML-II). If the signal is not sampled at 360Hz the function will resample the data:
-
qrs_detector.ecg_data_raw signal at original sampling frecuency
-
qrs_detector.ecg_data signal resampled at 360Hz
-
qrs_detector.qrs_peaks_indices contains R peaks at 360 Hz sampling frequency
-
qrs_detector.qrs_peaks_indices_fs contains R peaks at original sampling frequency
Finally several features are computed for each beat an a prediction is given by the SVM models trained:
qrs_classifier = QRSClassifier(svm_models_path = '../svm_models', ecg_data = qrs_detector.ecg_data, qrs_peaks_indices = qrs_detector.qrs_peaks_indices, min_A = min_A, max_A = max_A) The predictions is stored as intergers in the range [0, 4] at qrs_classifier.predictions following the class naming of the AAMI-Recomendations:
-N(0): Normal
-SVEB(1): Supraventricular
-VEB(2): Ventricular Ectopic Beat
-F(3): Fusion
-Q(4): unknown beat
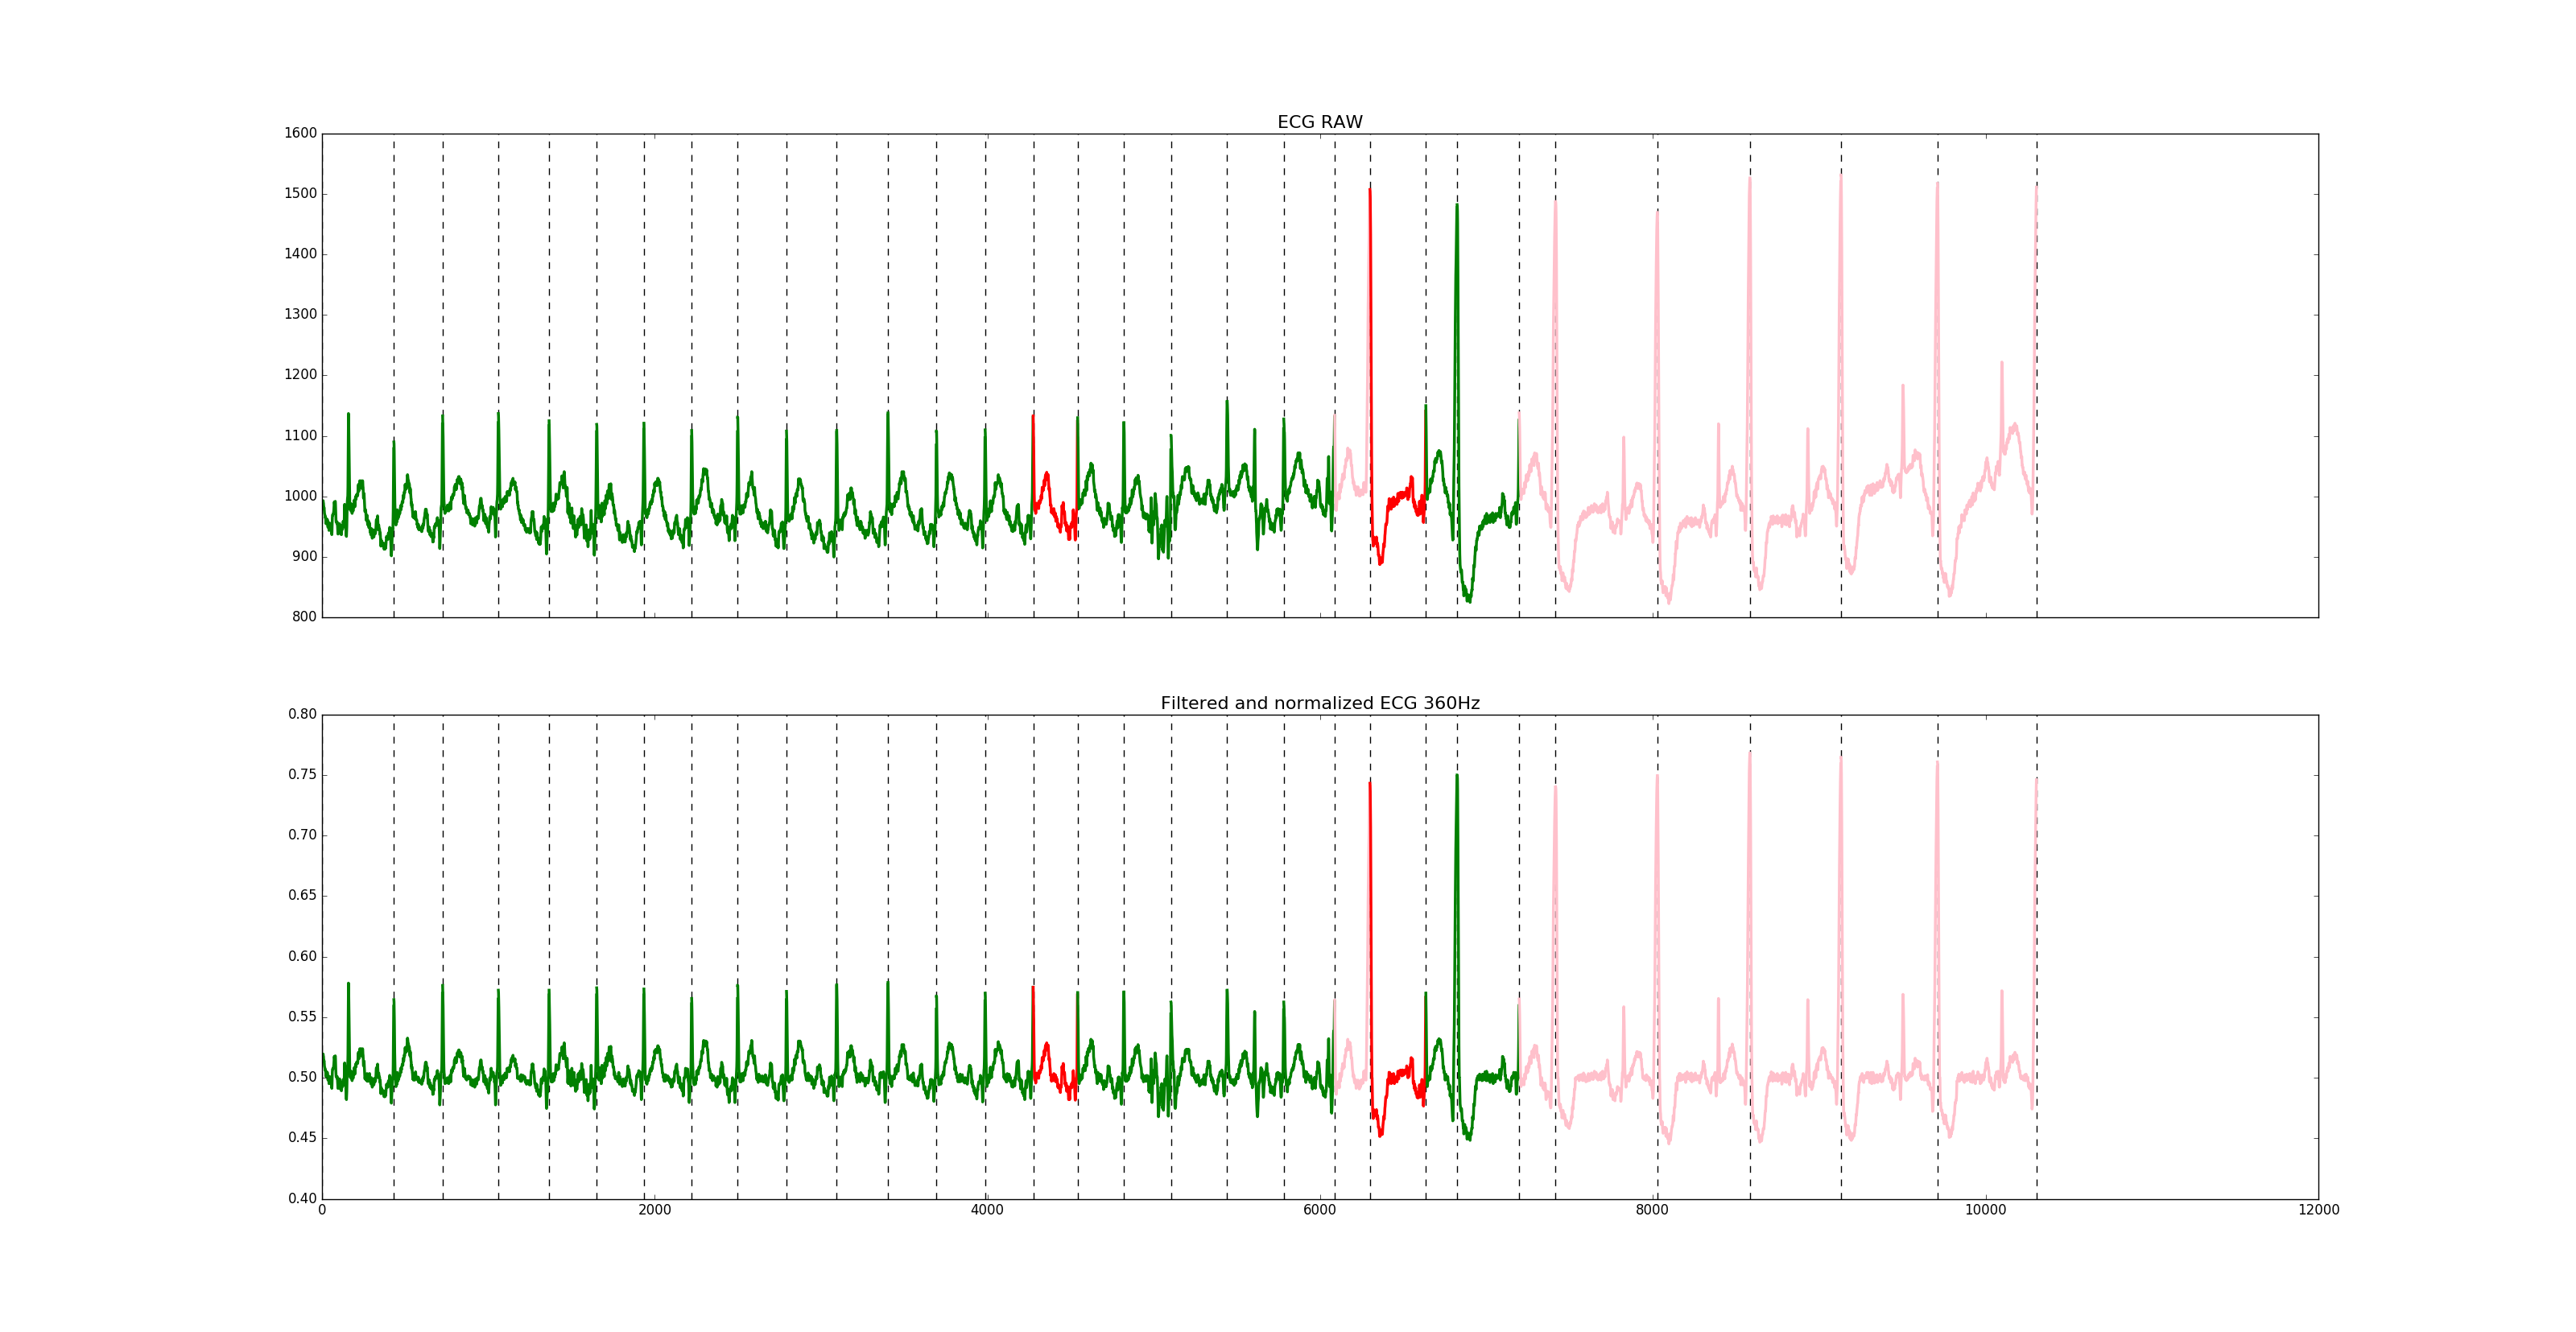
Additionally this example display a plot that contains:
- The RAW ECG signal (top) and the normalized
- filtered and sampled at 360Hz ECG signal (bottom).
Both subplots contains the R-peaks (vertical lines) and each beat is represented with a color based on the SVM prediction: (N, Green) (SVEB, Red) (VEB, Pink) (F, Yellow) (Q, Blue)
Plot from 220 record:
NOTE: these requirements are only informative since the files required for these libraries have been already included in the project
To use the trained SVM models and predict the result for new incoming data
Download from: https://www.csie.ntu.edu.tw/~cjlin/libsvm/
Installation: Type 'make clean' on dir: 3rdparty/libsvm-3.22 and then type 'make' on dir 3rdparty/libsvm-3.22/python to generate the file 'libsvm.so.2'
Based on project (https://github.com/c-labpl/qrs_detector/)
Early version developed in C++.
