Code for DRC project
Section 1: Setting the input
Data cleaning
Step 1 Handling SpatialPolygone object
- drop kinshasa
- merge three Bandundu's regions
Step 2 Dealing with the census
- merge census (residential/non-residential)
- add cluster's attributes to points
- first spatial merge (80557 points attributed)
- second classic df merge (+2136 points attributed)
First analyses
Missing cluster ID
After the two merges, 365 data points remain without any clusters information because of naming issue in the variable cluster_id in the census data
It corresponds to 20 clusters unidentified:
 cluster_id
 [1] "0"               "1"               "102"             "11"              "124"             "129"
 [7] "167"             "19"              "2"               "243"             "3"               "4"
[13] "5"               "528"             "56"              "58"              "6"               "7"
[19] "8"               "drc_kwango_0000"
Missing census observations
In some clusters (12 out of 410), mostly in Kinshasa, we don't have corresponding census observations. What happened? Is that normal that surveyors haven't carried on the survey in these areas?
 [1] "drc_kwilu_0199"     "drc_kwilu_0043"     "drc_kwilu_0070"
 [4] "drc_kwilu_0076"     "drc_kwilu_0089"     "drc_kwilu_0090"
 [7] "drc_maindombe_0044" "drc_kwilu_0156"     "drc_kwango_0017"
[10] "drc_kwango_0031"    "drc_kwango_0036"    "drc_kwango_0042"
Non-residential building with census observations
We have 73 people recorded in non-residential buildings. We discard them.
Section 2: Check for micro-census coverage
Idea: we want to know if surveyed areas, ie clusters, were fully covered by the surveyors, for sampling bias and density computation.

Drawing buffer around observations
Idea: GPS points are not completely exact. We add a relative incertitute to data by drawing a buffer around each points.
Procedure:
- transform CRS data ( we use UTM coding with zone = 34 what corresponds to Bandundu in DRC)
- draw a buffer of XXm around it.
- study the sensitivty of the result to this parameter.
Compute the proportion of covered area
1. The denominator
We considered only the builded areas in the cluster, using onrl settlement layer.

And then adding up the pixels in red.
2. The numerator
We overlay the census data buffered and pick only pixels where there is at least one observation.
Proportion results in dividing the pixels surveyed by the pixels in the builded areas.
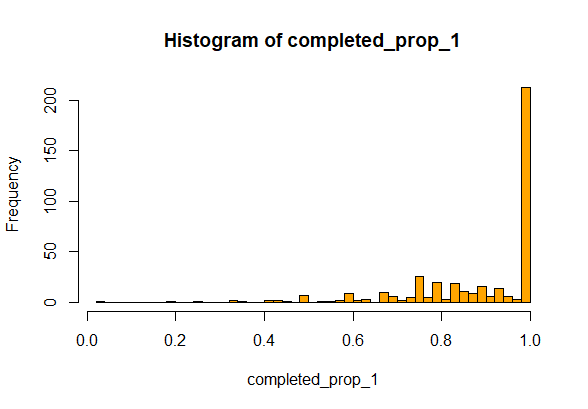
3. Results
   Min. 1st Qu.  Median    Mean 3rd Qu.    Max.
0.03846 0.83333 1.00000 0.90479 1.00000 1.00000
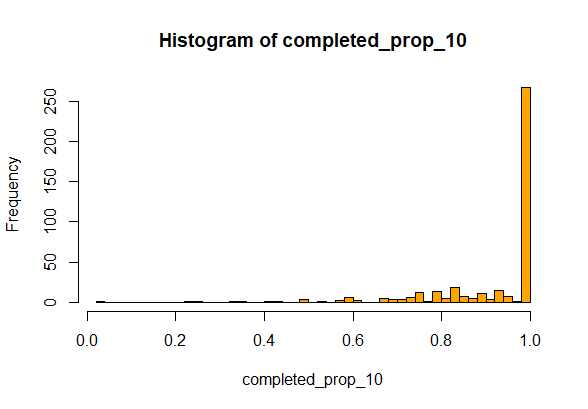
Sensitivity analyses


