deBlick, Your ultimate dashboard for a deep dive into player statistics.
Eddie Sosera
Explore the docs
View Demo
·
Report Bug
·
Request Feature
Tailored for the discerning football enthusiast, deBlick is not just a tool; it's your strategic advantage in the world of soccer analysis. Immerse yourself in a world of data-driven insights as deBlick meticulously compiles and presents player statistic.
- Built With
- Installation
- Features
- Technical Functionality
- Development Process
- Final Outcomes
- Reporting Issues
- Authors
- Licenses
- Contact
- Clone the repo
git clone https://github.com/eddiesosera/deBlick.git
- Install NPM packages
npm install
- Start the client server in
term4-group2-qnanpm start
- Start the backend server in
serverfilenpm run dev
NOTE:The api used offers different subscriptions which offer different statistics. The current subscription will expire on 23 November 2023, therefore limiting thetimelinestatistics. You may get a new token for 14 days on APIFootball.
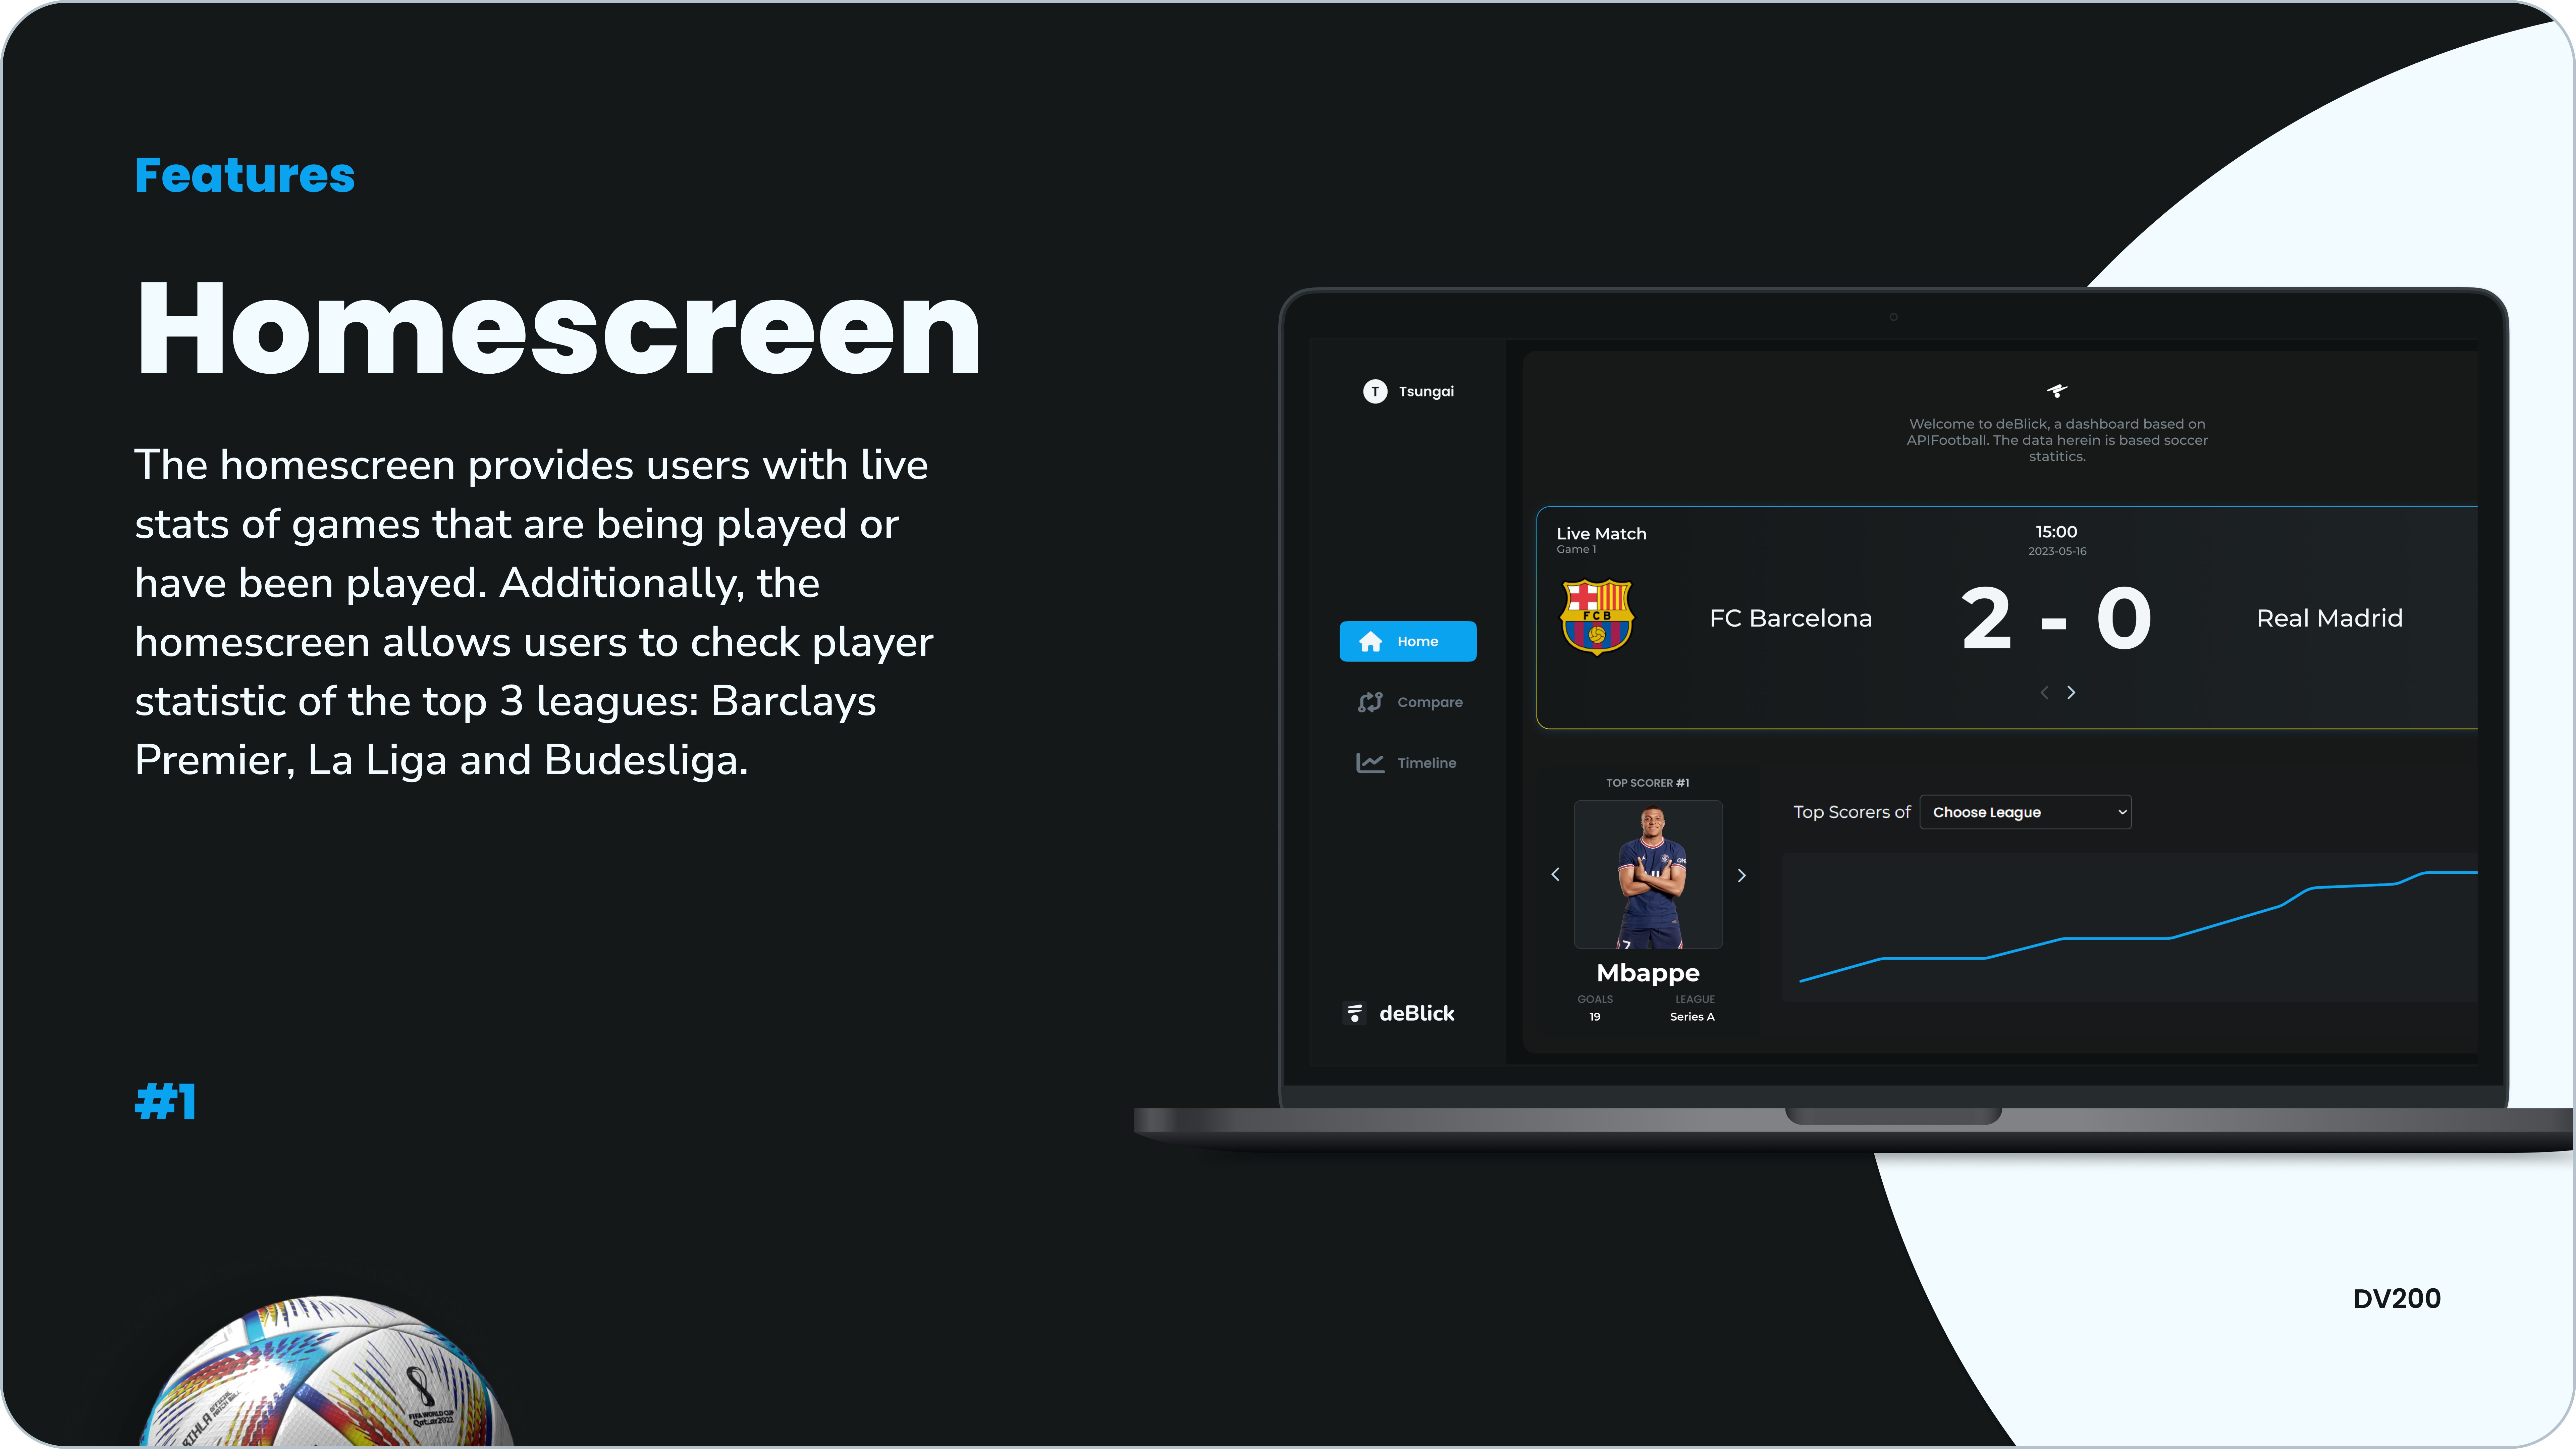
 The homescreen provides users with live stats of games that are being played or have been played. Additionally, the homescreen allows users to check player statistic of the top 3 leagues: Barclays Premier, La Liga and Budesliga.
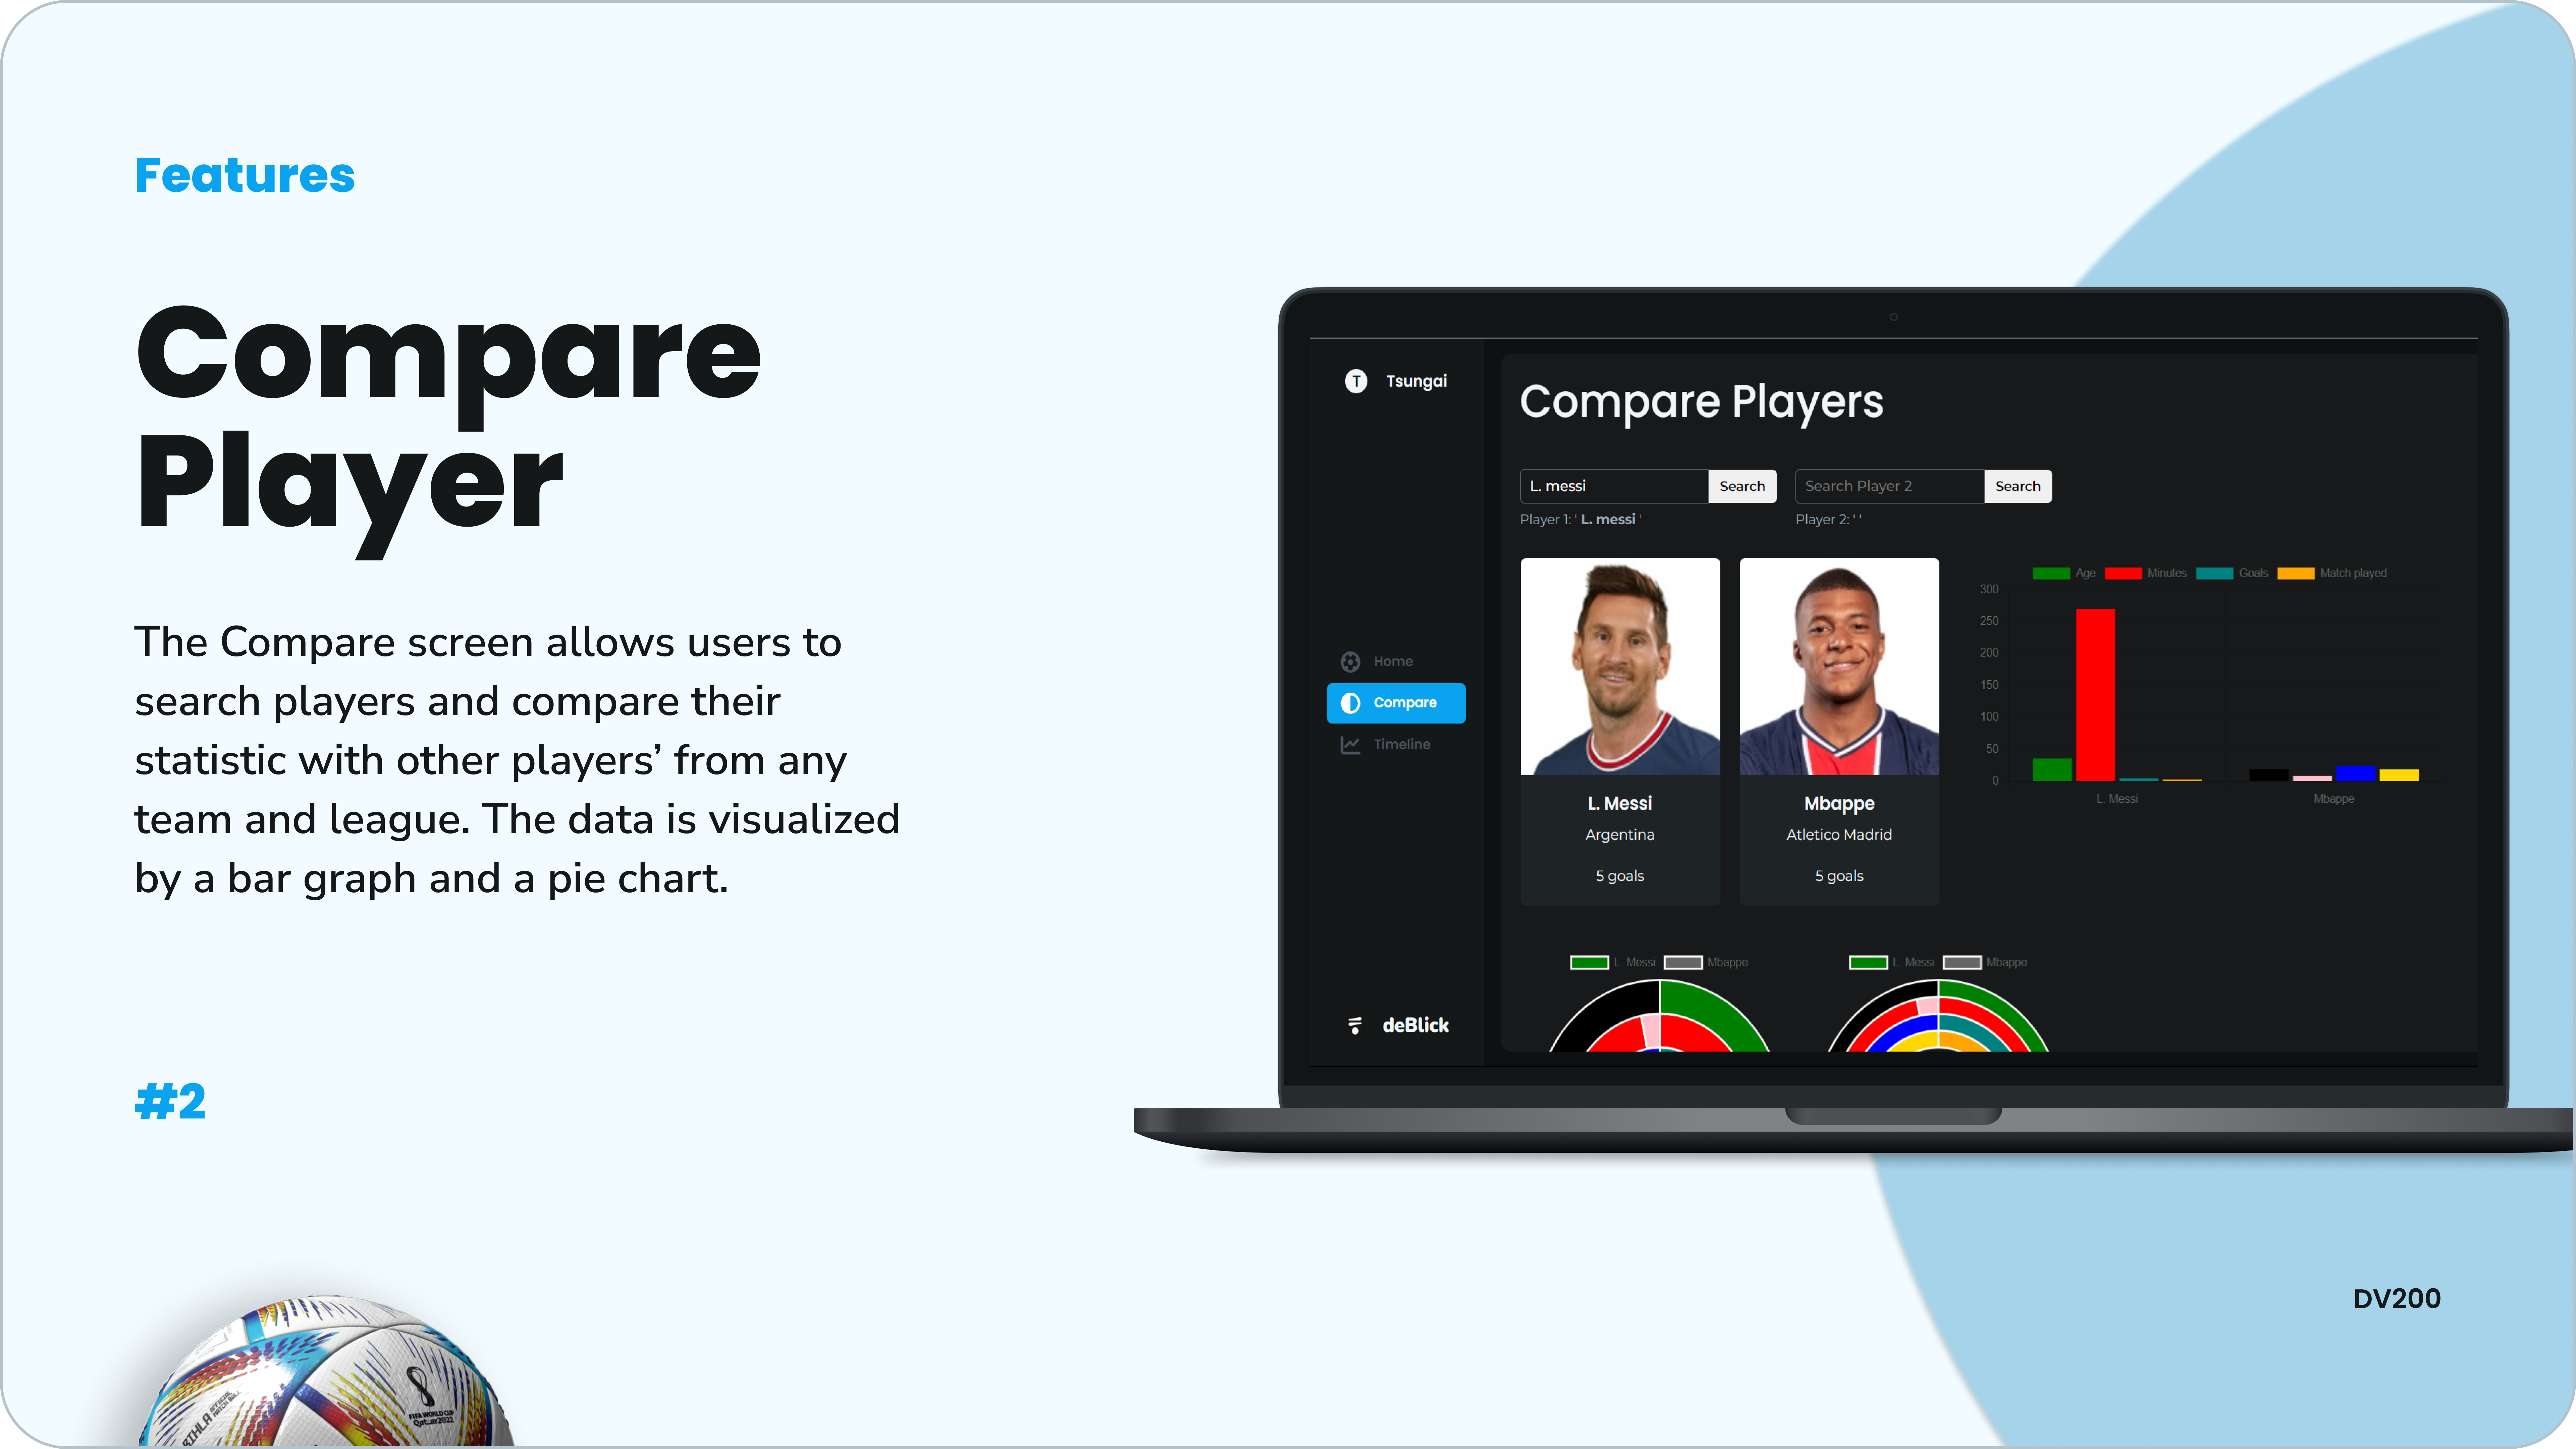
 The Compare screen allows users to search players and compare their statistic with other players’ from any team and league. The data is visualized by a bar graph and a pie chart.
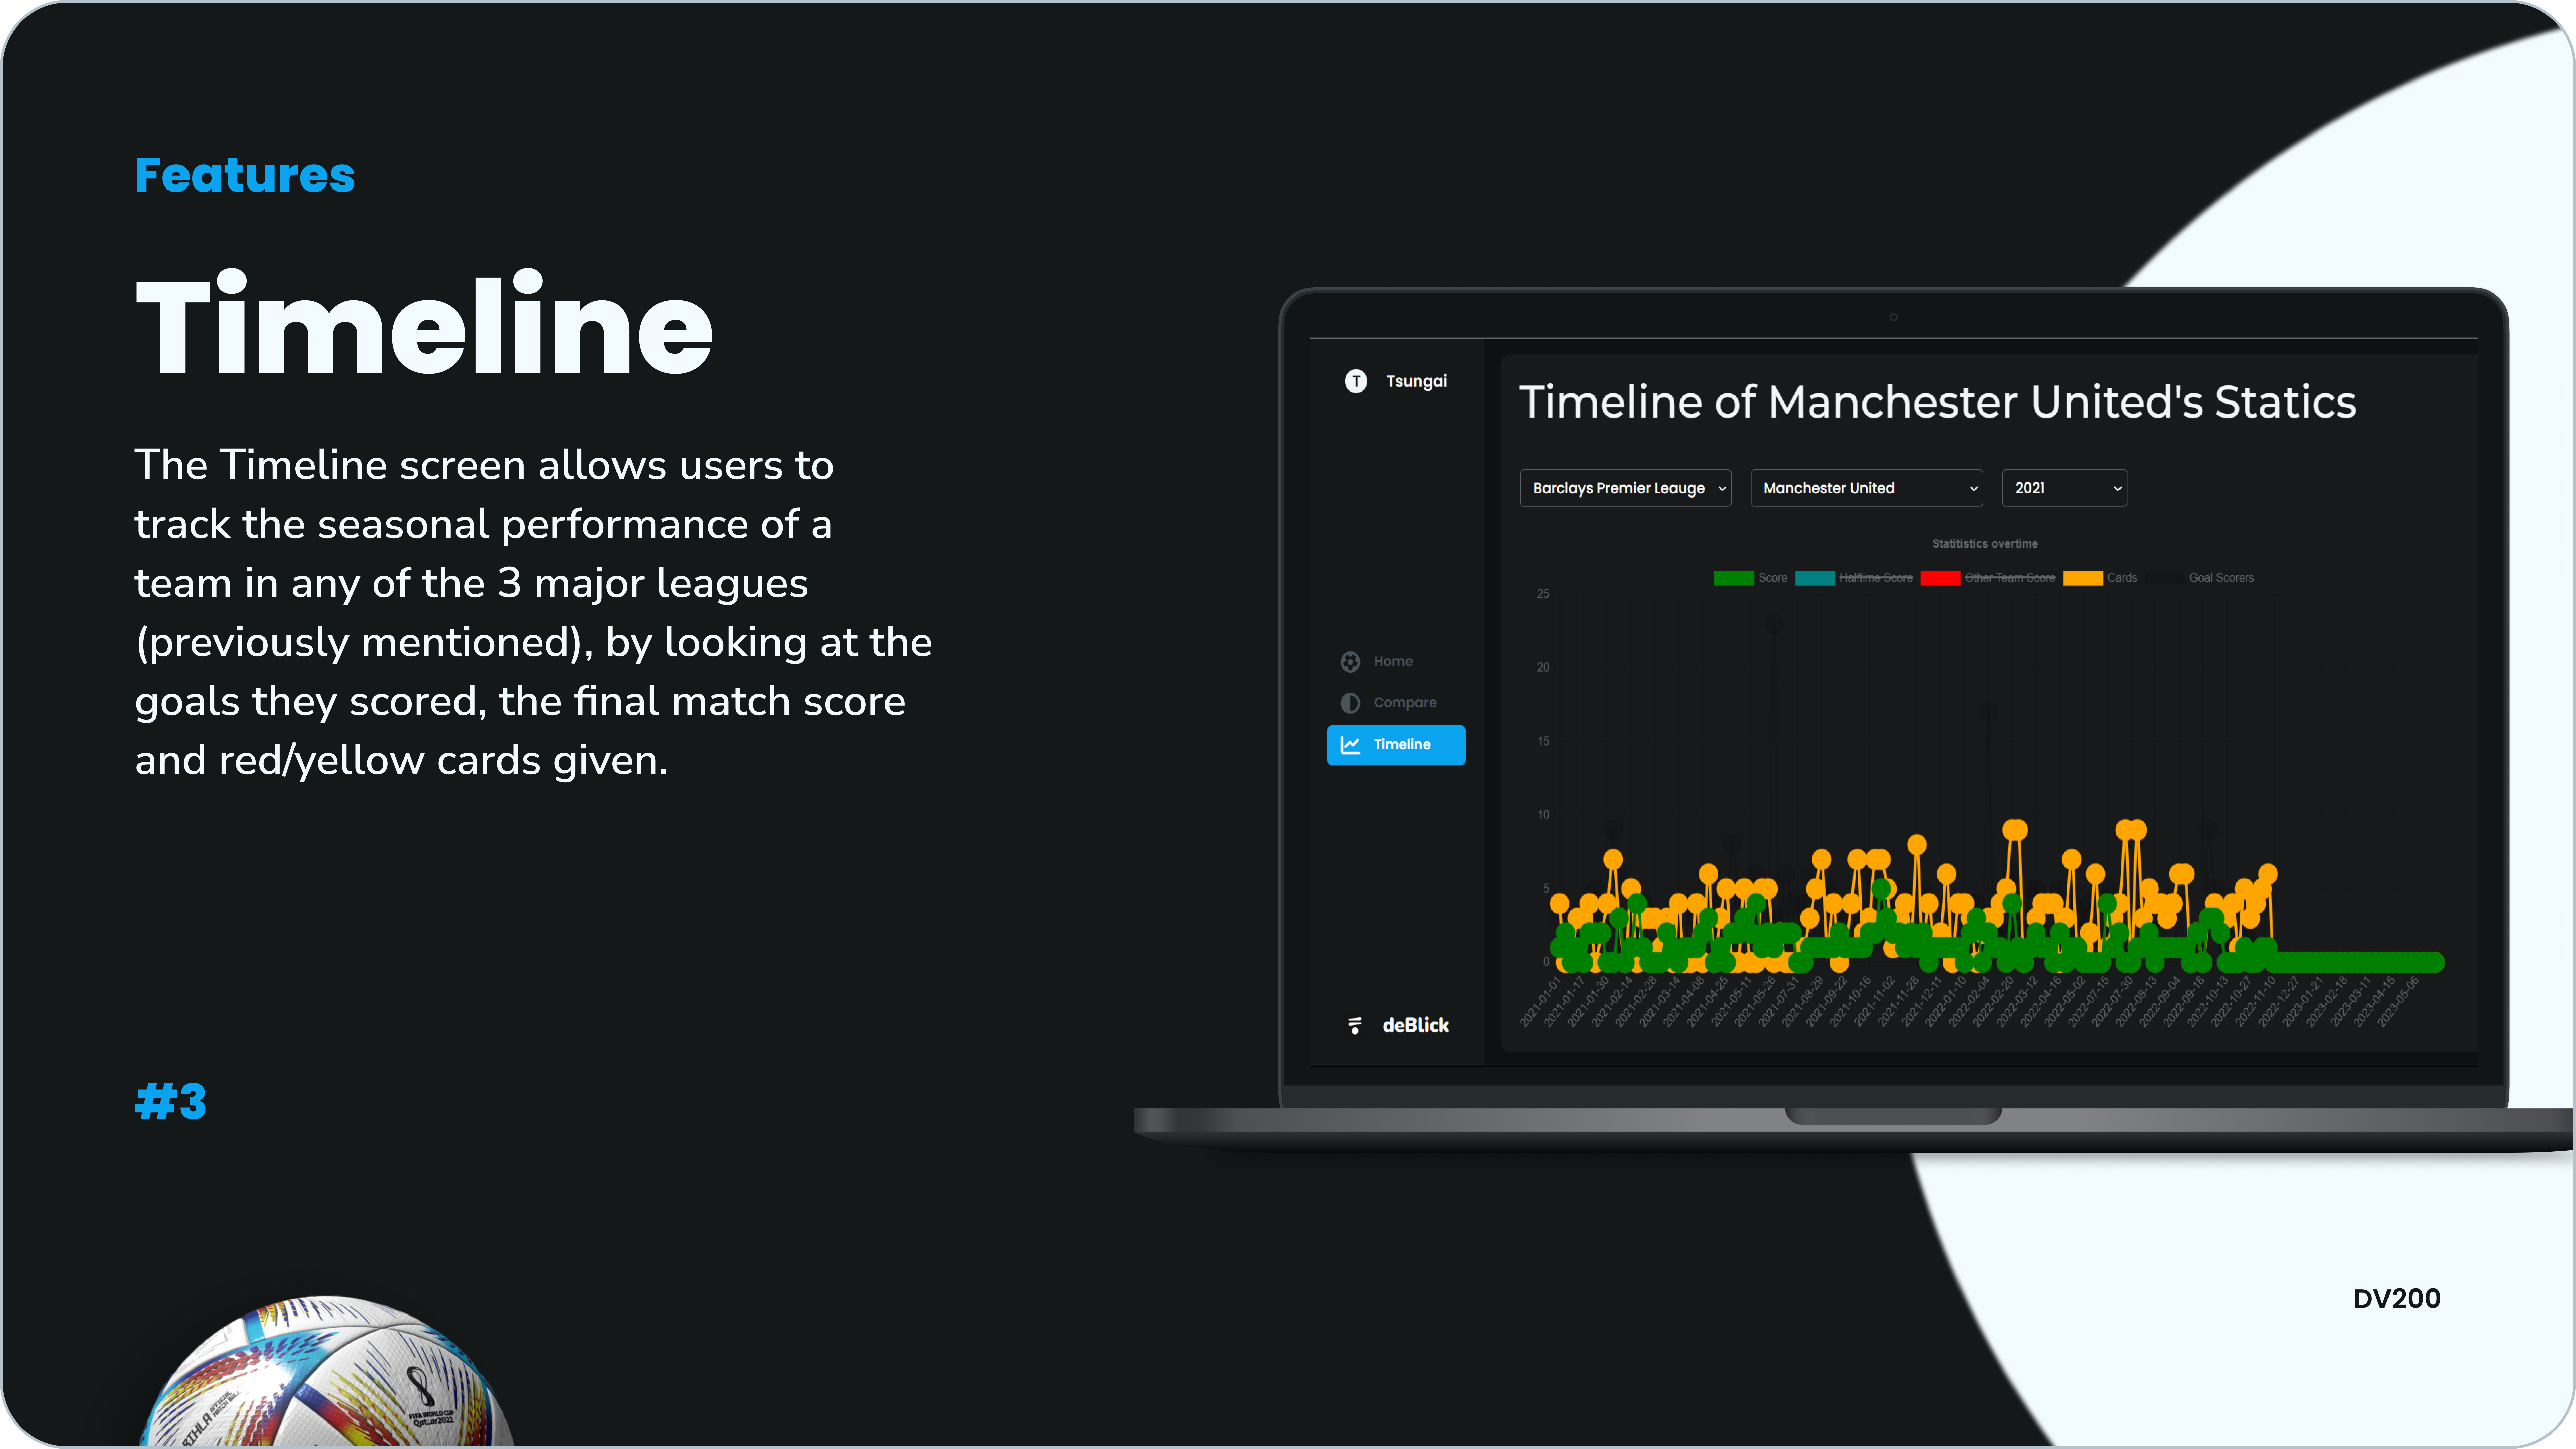
 The Timeline screen allows users to track the seasonal performance of a team in any of the 3 major leagues (previously mentioned), by looking at the goals they scored, the final match score and red/yellow cards given.
Fetch datafrom an existing api.Compare datasetsagainst each other.Track the timelineof a dataset.
The Development Process the technical implementations and functionality done for the website.
Overall this was a fun project as I got to work with a real api centered around a sport I am fond with - soccer.
I had quite a bit of a challenge managing state when fetching it and automatically updating it using useEffect, otherwise overally this was a fun project.
-
Fork the repository:
- Fork this repository to your GitHub account.
-
Clone your fork:
- Clone the repository to your local machine using the following command:
git clone https://github.com/eddiesosera/deBlick.git
- Clone the repository to your local machine using the following command:
-
Create a branch:
- Create a new branch for your feature or bug fix:
git checkout -b feature-branch
- Create a new branch for your feature or bug fix:
-
Make your changes:
- Make your desired changes in the codebase.
-
Test your changes:
- Ensure that your changes do not introduce new issues.
- Run relevant tests if available.
-
Commit your changes:
- Commit your changes with a descriptive commit message:
git commit -m "Your informative commit message"
- Commit your changes with a descriptive commit message:
-
Push your changes:
- Push your changes to your forked repository:
git push origin feature-branch
- Push your changes to your forked repository:
-
Create a pull request:
- Open a pull request against the
mainbranch of the original repository. - Provide a clear title and description for your pull request.
- Open a pull request against the
If you encounter any issues or have suggestions, please open an issue on GitHub.
Distributed under the MIT License. See License for more information.
LinkedIn - @eddiesosera, or Visit website.


