InfluxDB 2.x is now available and available via Docker Hub.
InfluxDB 2.x includes a native user interface, batch-style task processing and more. Get Started Here!
This repo is a quick way to get the entire 1.x TICK Stack spun up and working together. It uses Docker to spin up the full TICK stack in a connected fashion. This is heavily tested on MacOS and should mostly work on Linux and Windows.
To get started you need a running docker installation. If you don't have one, you can download Docker for Mac or Windows, or follow the installation instructions for Docker CE for your Linux distribution.
To run the sandbox, simply use the convenient cli:
$ ./sandbox
sandbox commands:
  up           -> spin up the sandbox environment (add -nightly to grab the latest nightly builds of InfluxDB and Chronograf)
  down         -> tear down the sandbox environment
  restart      -> restart the sandbox
  influxdb     -> attach to the influx cli
  flux         -> attach to the flux REPL

  enter (influxdb||kapacitor||chronograf||telegraf) -> enter the specified container
  logs  (influxdb||kapacitor||chronograf||telegraf) -> stream logs for the specified container

  delete-data  -> delete all data created by the TICK Stack
  docker-clean -> stop and remove all running docker containers
  rebuild-docs -> rebuild the documentation container to see updates
To get started just run ./sandbox up. You browser will open two tabs:
localhost:8888- Chronograf's address. You will use this as a management UI for the full stacklocalhost:3010- Documentation server. This contains a simple markdown server for tutorials and documentation.
NOTE: Make sure to stop any existing installations of
influxdb,kapacitororchronograf. If you have them running the Sandbox will run into port conflicts and fail to properly start. In this case stop the existing processes and run./sandbox restart. Also make sure you are not using Docker Toolbox.
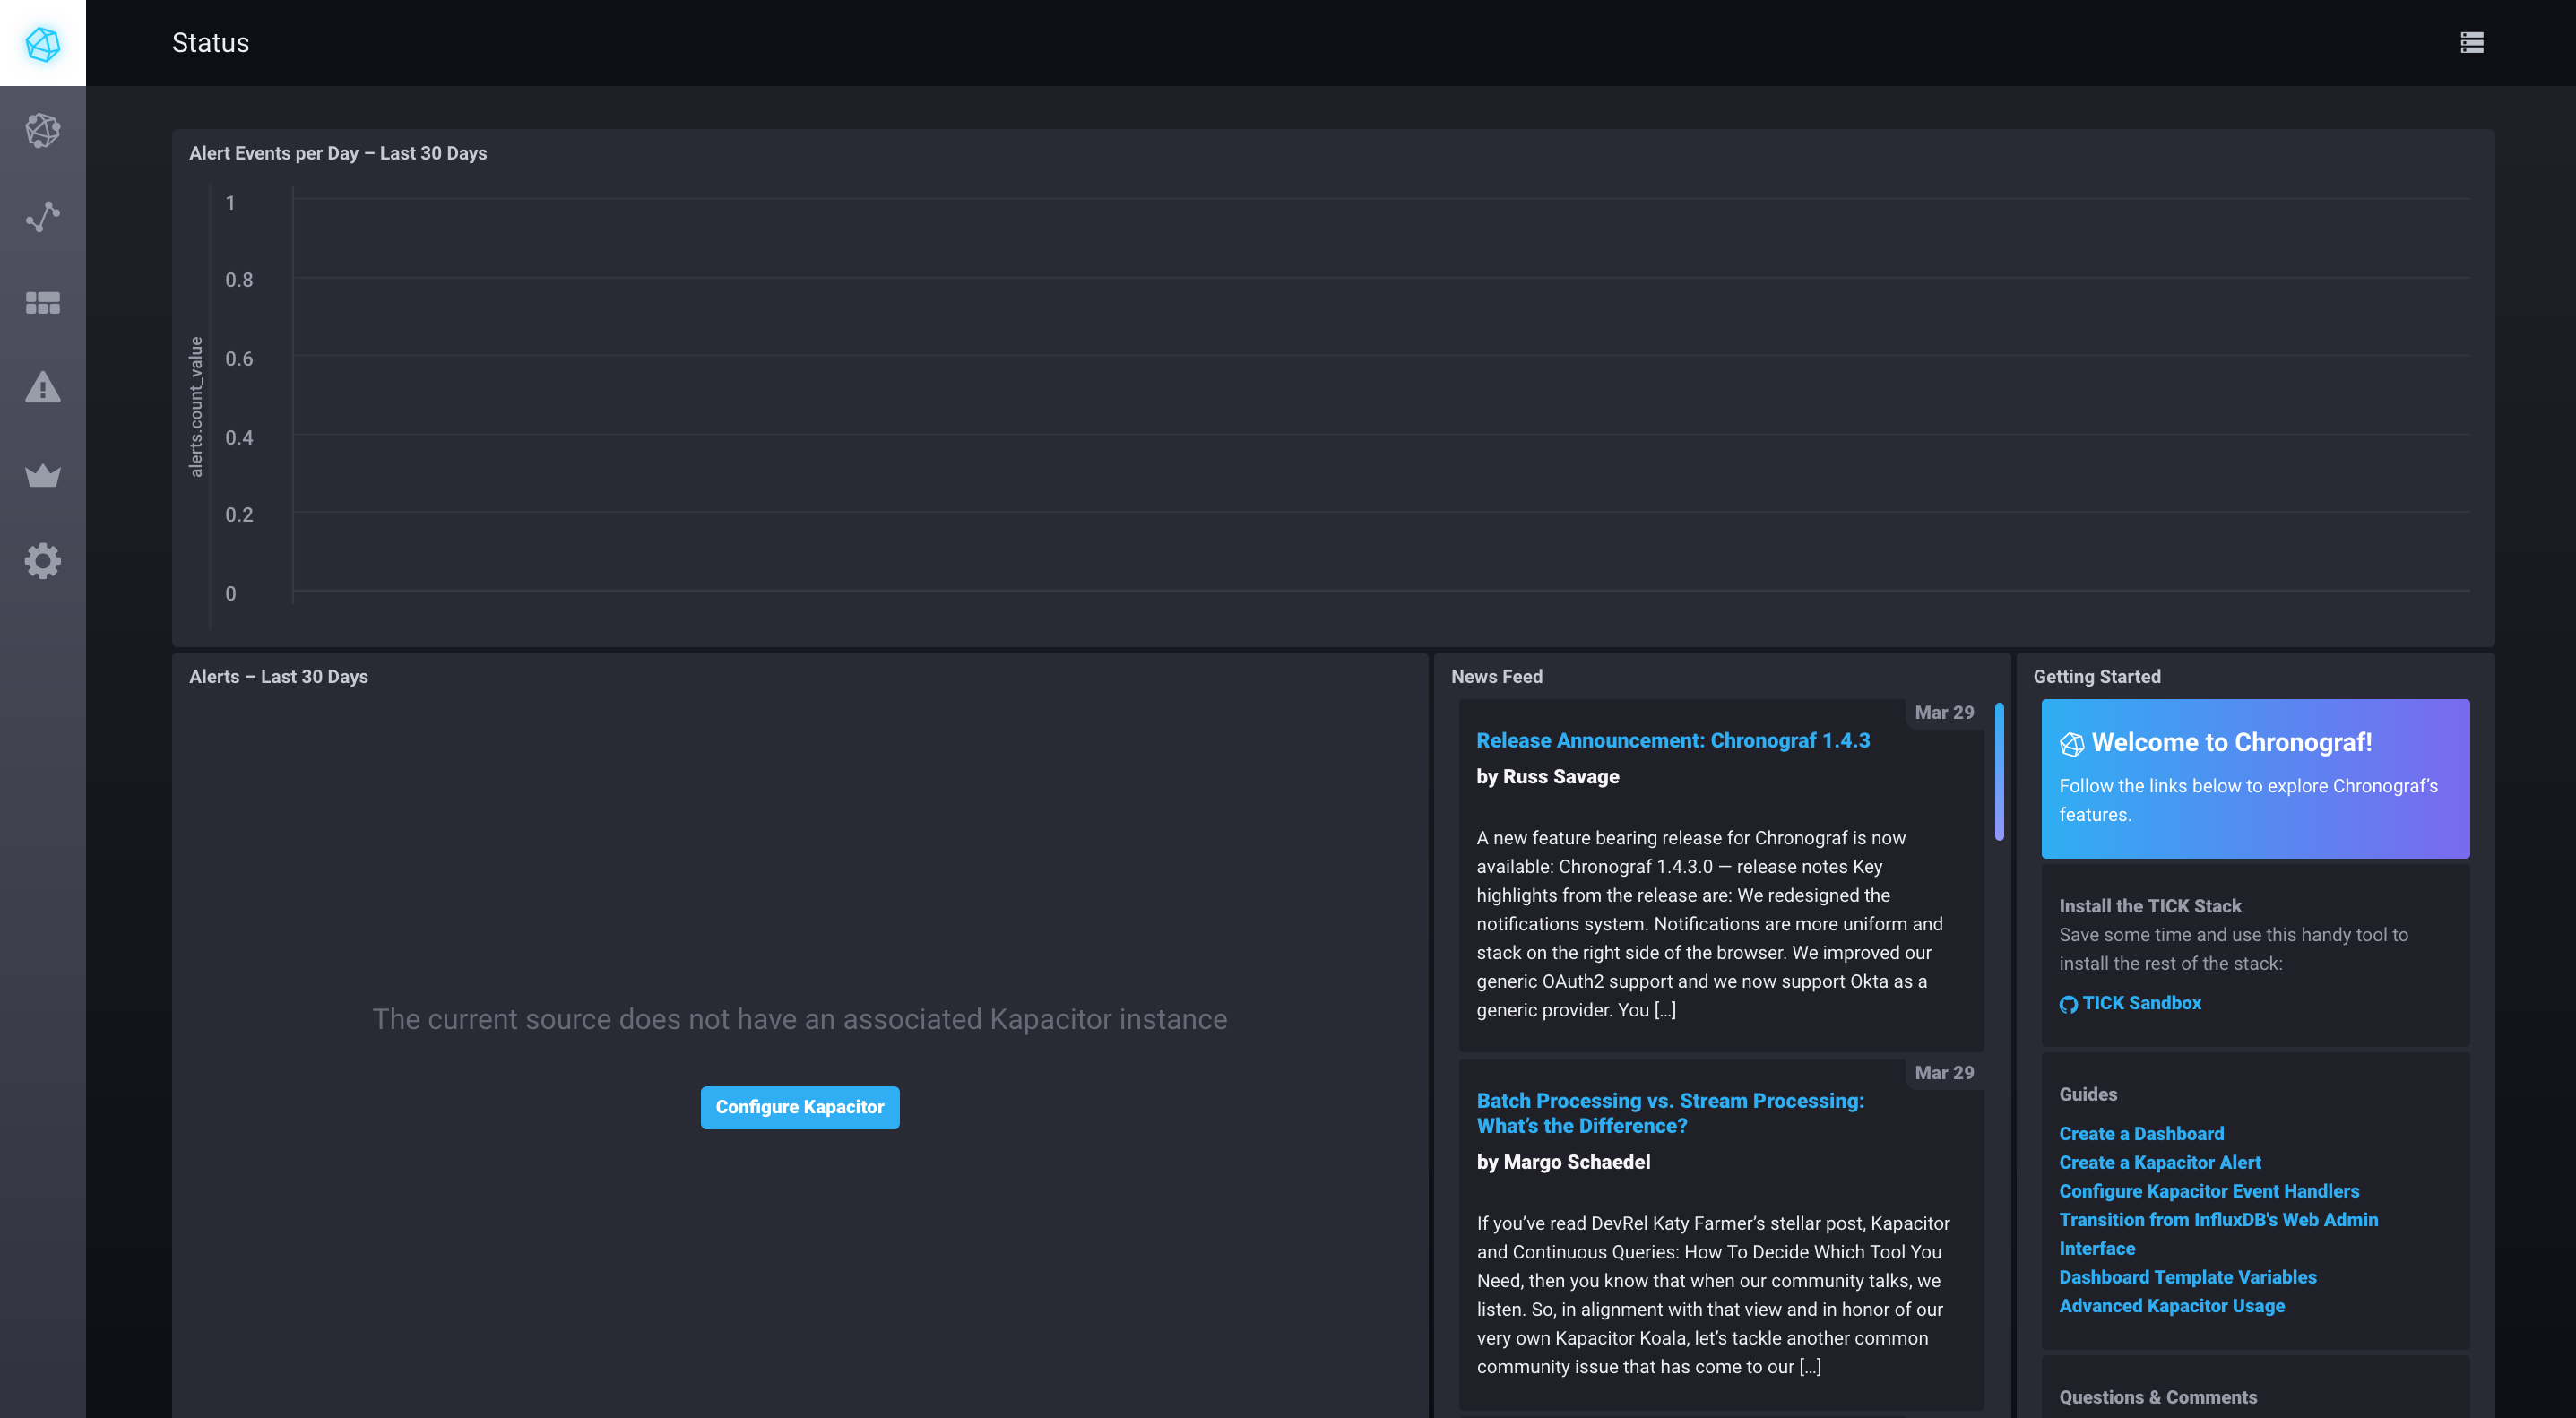
Once the Sandbox launches, you should see your dashboard appear in your browser:
You are ready to get started with the TICK Stack!
Click the Host icon in the left navigation bar to see your host (named telegraf-getting-started) and its overall status.

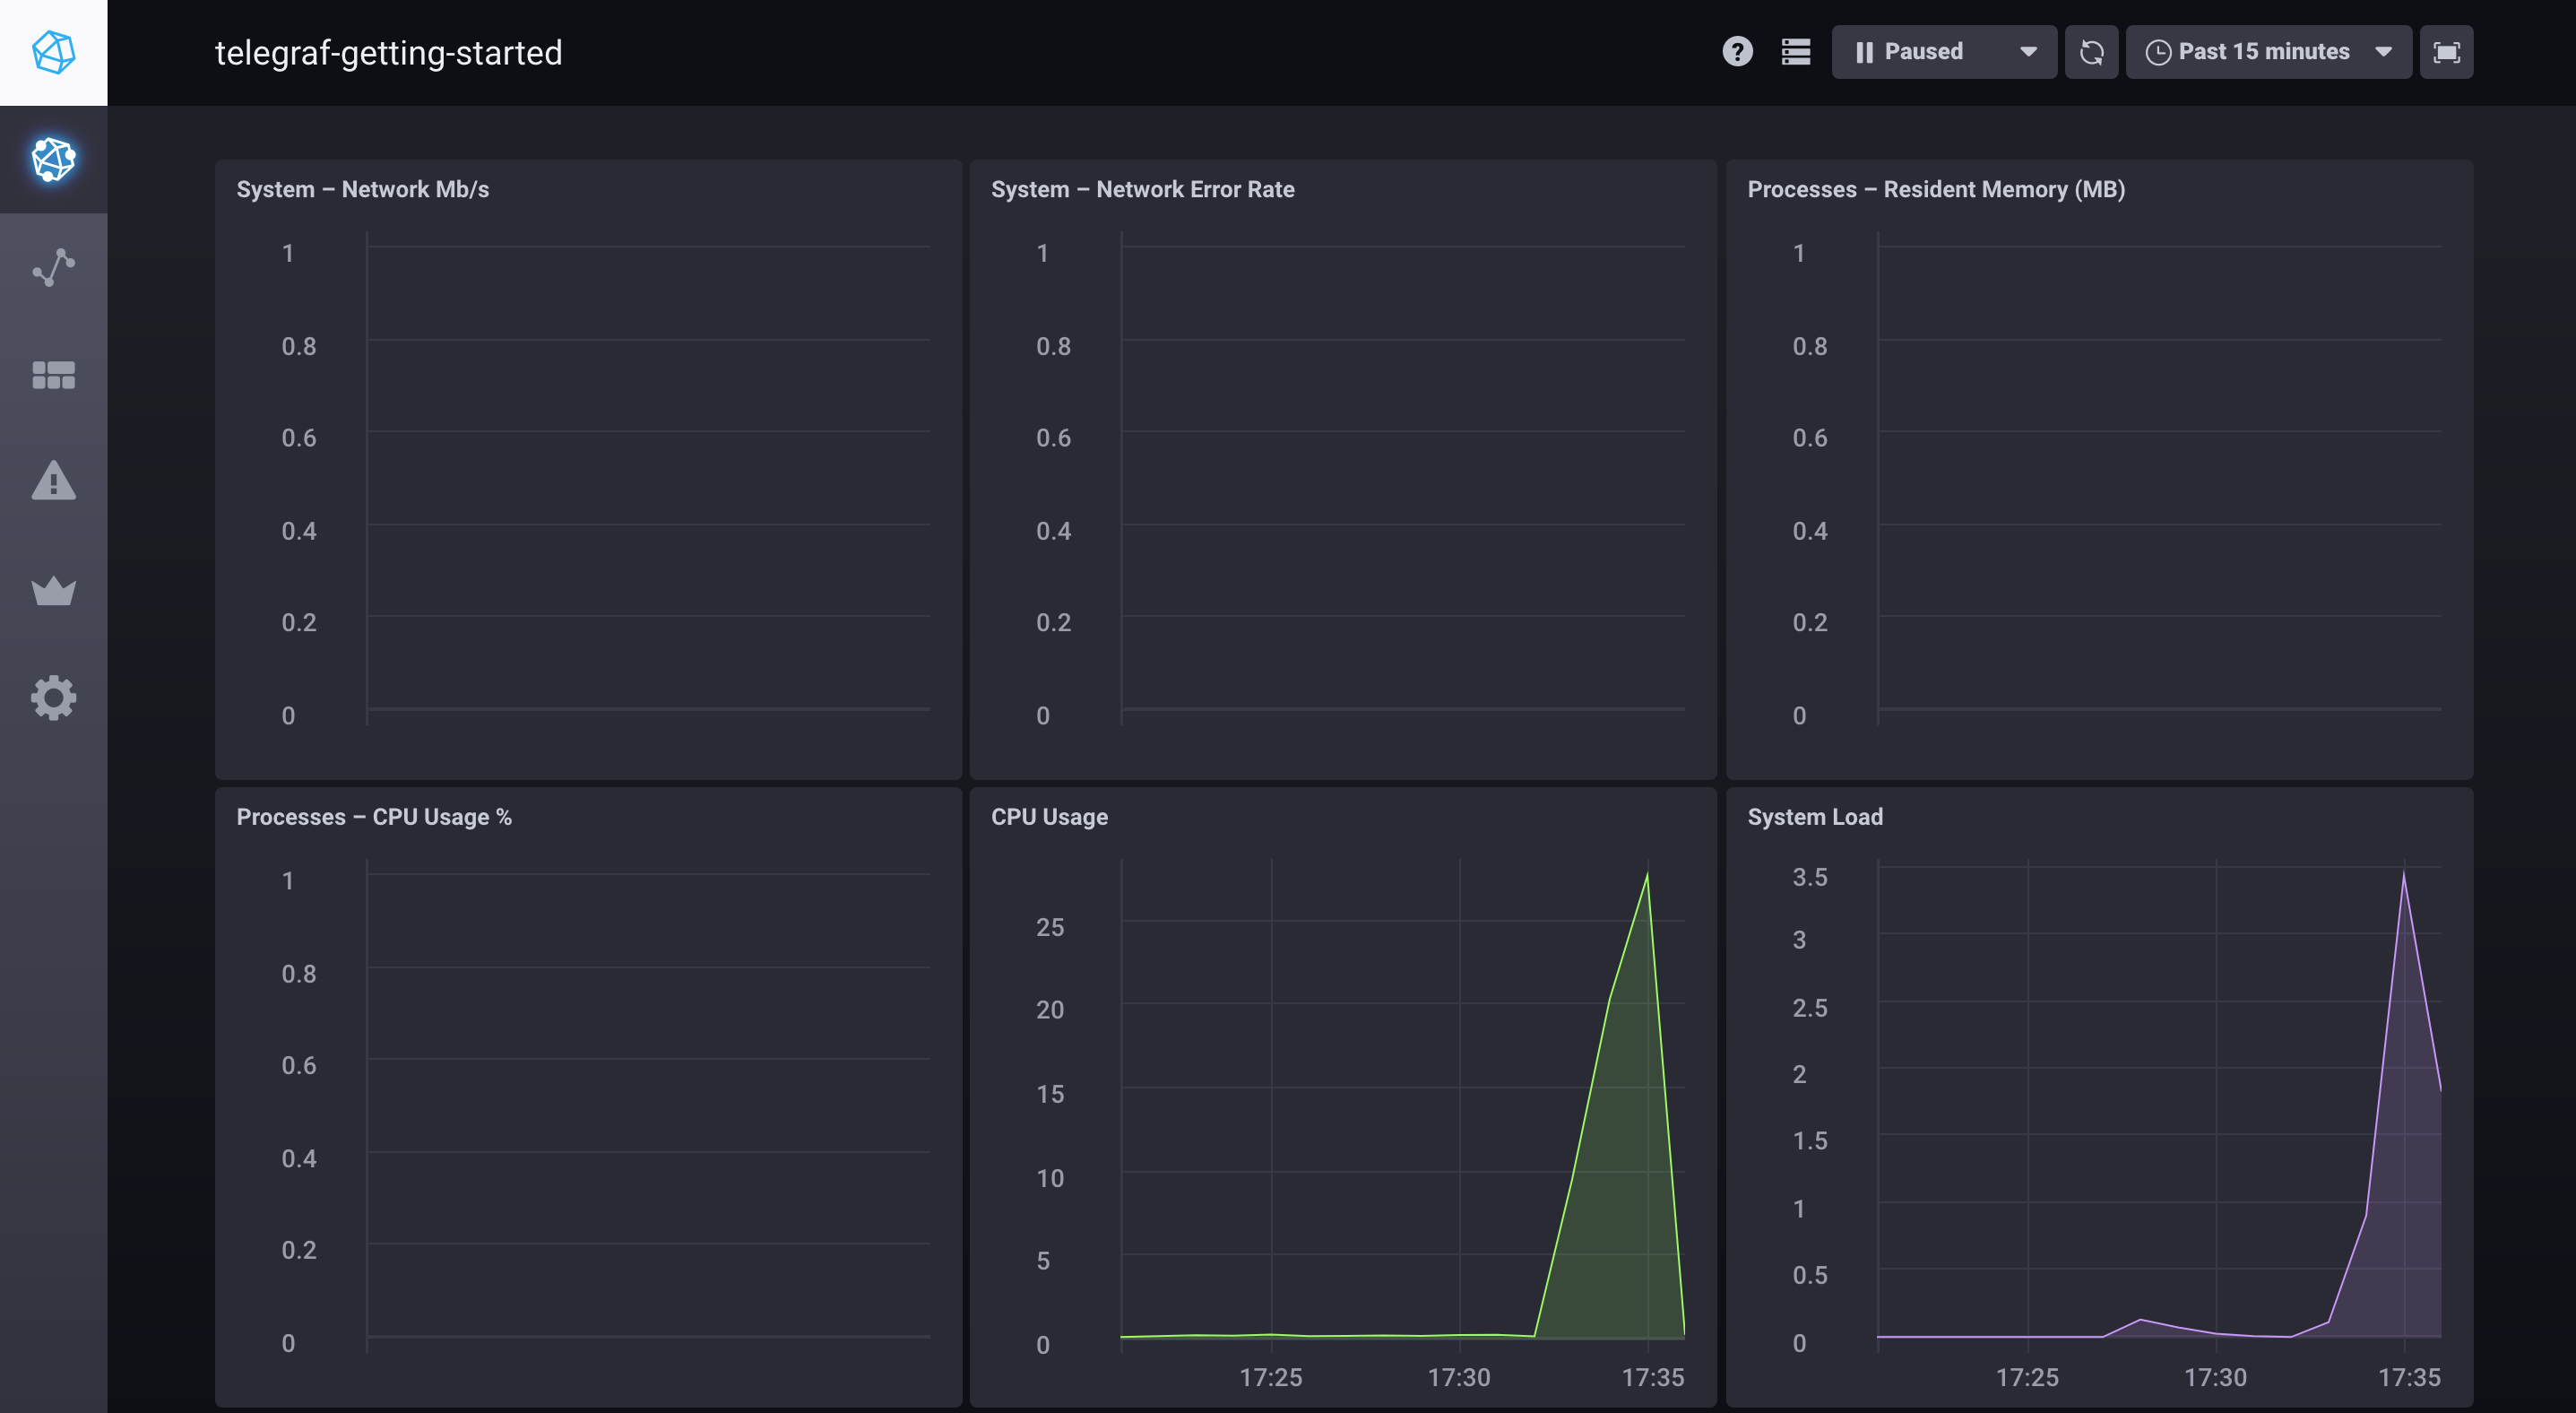
You can click on system hyperlink to see a pre-built dashboard visualizing the basic system stats for your
host, then check out the tutorials at http://localhost:3010/tutorials.
If you are using the nightly builds and want to get started with Flux, make sure you check out the Getting Started with Flux tutorial.
Note: see influx-stress to create data for your Sandbox.

