- Introduction
- Hardware Setup
- Software Setup
- Custom Configuration
- Debugging Device Auto-detection
- Bill of Materials
This is the repository for EEMBCs EnergyRunner® benchmark framework which is used by MLPerf™ Tiny. This repository is now a user-guide, and no longer hosts the binaries. Read below for more details on how to obtain them.
The source code for the MLPerf Tiny benchmark is at the MLCommons GitHub Page. The datasets are available through CLA with MLCommons. Please refer to the MLCommons Tiny documentation for more details on this.
The runner binary is sponsored by MLCommons and is available to anyone after a click-through agreement.
It can be found on the EEMBC website.
Current version: 3.0.10
View release history
- 3.0.10 - 2021-11-15 - Bugfixes: MLPerf tiny resets input file if device or model changes; CLI filename spaces; serial scan name% check fail; renaming; reloading "user" sessions from script fails; silent mount fail if a desired device is already claimed; N6705 traces can now be zoomed; race bug in Benchmark init fixed.
- 3.0.9 - 2021-06-20 - Enabled cut/paste for macOS; fixed JS110 ring-buffer issue truncating last 65K samples
- 3.0.8 - 2021-06-19 - No fixes relevant to MLPerf Tiny
- 3.0.7 - 2021-06-17 - Additional reporting message when unmounting errors occur, increased default USB pid/vid boot timeout for non-DUT hardware
- 3.0.6 - 2021-05-14 - Increased detection timeouts (some hubs are just slow, though); added
results.txtfile and log the runer version; cleaned up some error messages when mounted devices are unplugged, or if input stimuli are missing (from re-loading old sessions)) - 3.0.5 - 2021-05-07 - Added
disable-muteinitializaiton option (see below) - 3.0.4 - 2021-04-26 - Reworded the benchmark panel descriptions to be more succinct.
- 3.0.3 - 2021-04-14 - Fixed iteration check; release LPM01A host control on unmount
- 3.0.2 - 2021-04-12 - Fixed issue #7.
- 3.0.1 - 2021-04-09 -
bloadpwasn't using sliding windows - 3.0.0 - 2021-04-02 - First release
There are also two videos to accompany the energy measurement process. Part one explains how to connect the hardware described in this document. Part two explains how to use the runner to make an energy measurement.
Throughout this document, you will see constant distinctions made between performance mode and energy mode. The reason why the two collection modes have been separated is due to how the device under test, aka the DUT, behaves in both modes.
The DUT differs like this:
| Performance Mode | Energy Mode |
|---|---|
| Connects to Host PC | Electrically isolated from Host PC |
| Talks directly to the Runner | Talks directly to IO Manager |
| Baud rate can be changed | Baud rate fixed at 9600 |
| Timestamp is an MCU counter of at least 1kHz (1000us) | Timestamp is GPIO falling-edge with 1us hold-time |
| Measures throughput (infernces per second) and accuracy (Top-1 and AUC) | Measures throughput (inferences per second) and Energy (Joules per inference) |
Because of these key differences, two different plug-ins are provided in the "Benchmarks and Test Scripts" drop-down, one for each of the two modes.
It not possible to switch modes dynamically because some UARTs cannot change baud on the fly. Future versions of the benchmark will support alternate solutions for changing modes, but for now it requires a recompilation of the firmware and use of a #define EE_CFG_ENERGY_MODE 1 to switch.
Port the firmware to your device from the test harness based on the MLCommons MLPerf Tiny reference code. The sample template is un-implemented, you will need to port to your platform. There are four reference ports (one for each model) that use mbedOS and TFLiteMicro in the tinyMLPerf reference submissions. This may help give you an idea of what a functional port looks like.
Compile as EE_CFG_ENERGY_MODE=0. Program the th_timestamp function to return the current microseconds since boot time (e.g., with a MCU counter or system timer).
Connect the DUT to the system with a USB-TTL or USB-debugger cable so that it appears as serial port to the system at 115200 baud, 8N1. (If using a faster Baud rate, see the configuration section at the end of this document.) To verify this step, you should be able to open a terminal program (such as PuTTY, TeraTerm or the Arduino IDE Serial Monitor), connect to the device, and issue the name% command successfully.
Proceed to "Software Setup" below.
ProTip: Only attempt this if you are very comfortable with the process. It is possible to run performance mode at a higher baud rate. This may be desirable to speed up downloading of the images. For this to work, change the DUT default baud rate from 115200 to the new value, and then edit the .eembc.ini file dut-baud to match. Instability may occur at higher rates however depending on your OS and hardware. Also note that if you change the default baud in the .eembc.ini file, the framework will no longer detect the energy monitor or IO Manager, so be sure to set it back to run in Energy Mode!
Port the firmware to your device from the test harness based on the MLCommons MLPerf Tiny reference code. The sample template is un-implemented, you will need to port to your platform. There are four reference ports (one for each model) that use mbedOS and TFLiteMicro in the tinyMLPerf reference submissions. This may help give you an idea of what a functional port looks like.
Compile as EE_CFG_ENERGY_MODE 1. Program the th_timestamp to generate a falling edge on a GPIO that lasts at least one microsecond (hold time).
Since Energy Mode supplies power to the device at a different voltage than the host USB, we need to electrically isolate the DUT. This is accomplished through two pieces of hardware: 1) three level shifters (one each for UART-TX, UART-RX and GPIO timestamp), an Arduino Uno. The Uno is referred to as the "IO Manager" and provides a UART passthrough to/from the host Runner.
The IO Manager is a simple Arduino UNO. Using the Arduino IDE to flash the io-manager_1.0.3.hex image, like so:
C:\dev\arduino\1.6.6\hardware\tools\avr\bin\avrdude.exe -CC:\dev\arduino\1.6.6\hardware\tools\avr\etc\avrdude.conf -v -patmega328p -carduino -PCOM3 -b115200 -D -Uflash:w:io-manager_1.0.3.hex:i
The recommended level shifters are the 4-channel BSS138 devices, as sold by AdaFruit. Simply plug these into a breadboard, provide 5V on the high-side voltage from the Arduino, and VCC from another power supply. This LevelShifter VCC must match the GPIO output of the DUT.
The Runner supports three different energy monitors, aka EMON:
- STMicroelectronics LPM01A, firmware version 1.0.6 or later required
- Joulescope JS110 plus a low-noise power supply
- Keysight N6705 with 1xN6781+1xN6731 or 2xN6781
Depending on the EMON you use, there are three different Runner schematics.
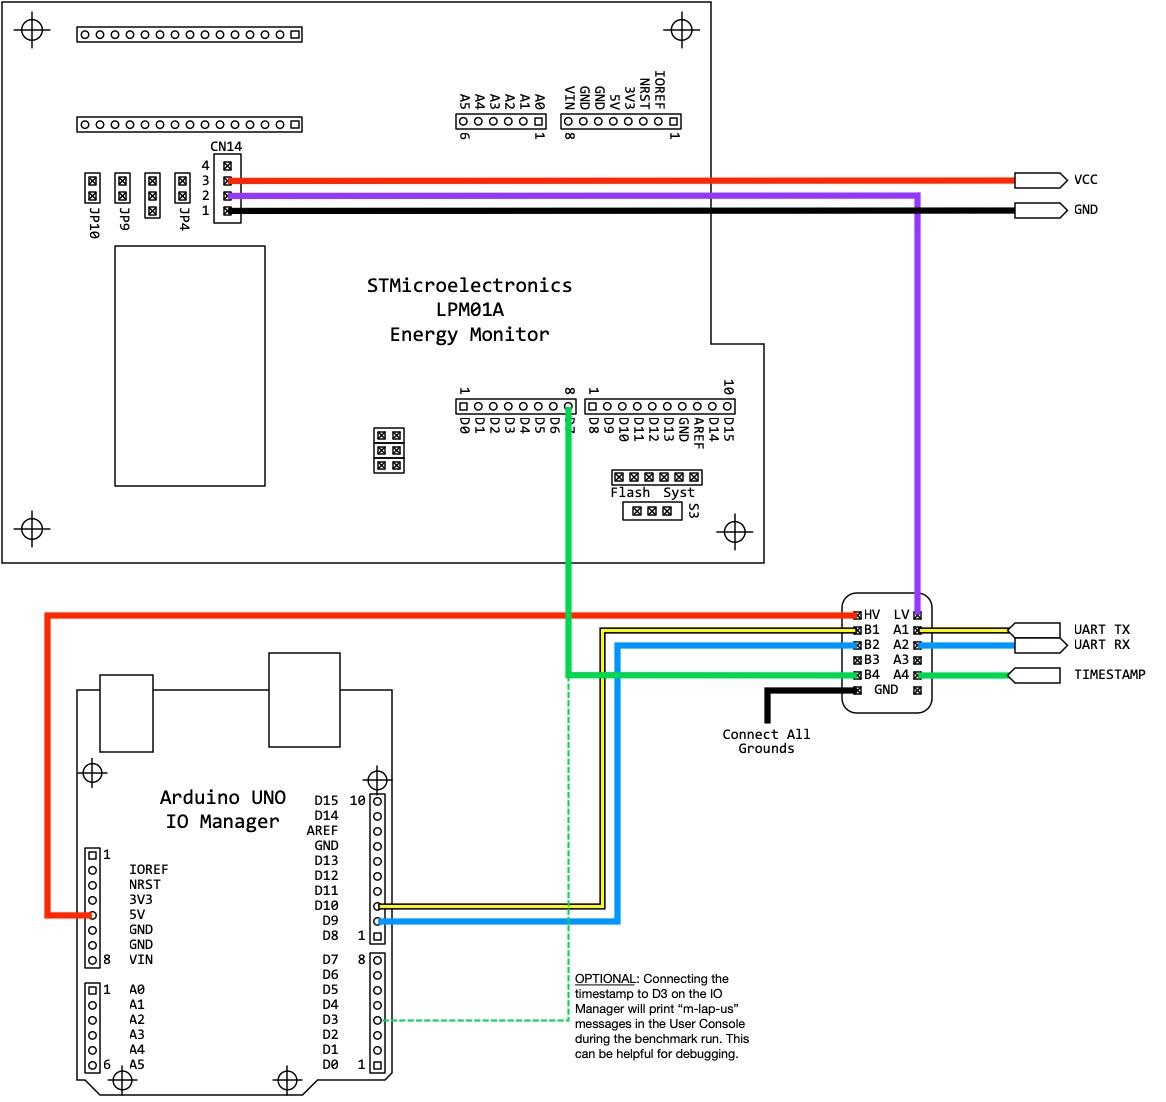
Below, the LPM01A provides two supplies: measured VOUT (CN14.3) and *un-*measured VDD (CN14.2). VOUT is used to power the device under test only, whereas VDD provides the low-voltage supply to the level shifters because VDD=VOUT. The high-side of the level shifter is provided by the Arduino UNO, which is 5V. This allows the DUT to run at 1.8V to 3.3V, and still be able to talk to the Arduino at 5V. Since low-voltage is supplied by the un-measured source, it does not count toward the joules used by the DUT.
The yellow line is the output of the DUT UART (Tx), which goes into the Arduino UNO Rx. Likewise, the blue line out of the Arduino UNO transmits to the DUT Rx through the level shifter. Same goes for the timestamp. While the source code claims it needs to be an open-drain, push-pull will work as well, since the level shifter essentially converts open drain to push pull. Pin D7 of the LPM01A listens for falling edges and logs a timestamp.
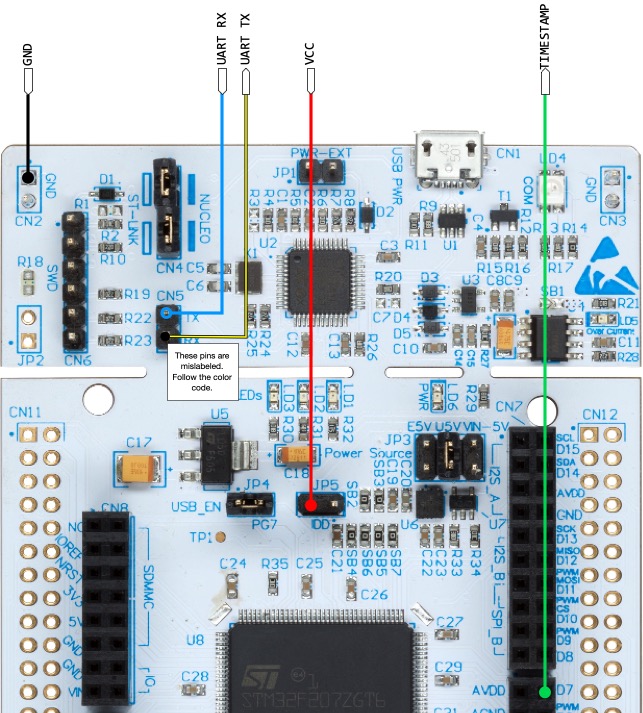
Below we see the connectivity to the reference platform, the Nulceo L4R5ZI, which uses the Nucleo 144 board schematic. Remove the IDD jumper and connect VCC to the left side. The UART pins on the ST-LINK header are the default mbed-os UARTTX and UARTRX pins. (Note: the labels don't quite make sense, as RX is connected to UARTTX, and vice versa for TX.) The timestamp should be a DigitalOut, and D7 is common for all mbed-os boards that support the Arduino interface. Lastly, there are many grounds on the board, pick one.
NOTE: Always update the STLink firmware on the nucleo board. Early versions of the firmware exhibit instability on the retargeted UART, causing the serial port to hang intermittently, requiring the user to unplug and replug the device. M27 is the latest version of the onboard STLink2 firmware (as of July 2021). Use the STMC32CureProg software to update the STLink firmware. This video on YouTube explains exactly how to do this update.
For debug purposes, the timestamp can also be sent to the Arduino D3 pin. This will cause additional timestamp information to be printed in the log as io: m-lap-us-\d+. This can be helpful if there are timestamp issues.
If you do not have firmware version 1.0.6 on your LPM01A (it prints the version on the LCD while booting), you can download it here. It requires the ST CubeMXDeFuse application as well to perform the upgrade (see instructions that come with the firmware).
For the JS110, use this schematic, and for the N6705, this one. The concept is the same, the only differences are in where the VOUT and VDD are sourced, and how the timestamp is routed. For the N6705, the timestamp is split into the Arduion UNO. This is done because the N6705 cannot generate it's own timestamps; instead it is synched to the UNO which provides them. For the LPM01A & JS110, the timestamp doesn't need to be connected to the UNO, but it can be to help provide additional debug info (as the UNO will announce it saw a timestamp, which can be helpful if your EMON doesn't seem to be listening).
IMPORTANT NOTE: Only ONE power supply is allowed to supply the DUT during measurement. Any additional circuitry on the board will contribute to power and lower the score. The run rules allow cutting traces, desoldering bridges, removing jumpers or setting switches to disable ancillary hardware on the platform (e.g., debug hardware, or kit sensors).
To assist in making the setup more compact, EEMBC provides a link to an Arduino shield for faster connectivity.
See the "Bill of Materials" section at the end of this file for more information on where to buy all the parts shown above.
For first-time setup, it really helps to have a small logic analyzer or a digital oscilloscope to help trace the output of the DUT at various stages of the isolation path. For example, is the Rx transmission from the host making it to the UART input? Is the boot message from the DUT coming from the right TX pin on the header? Is the timestamp held low long enough?
Proceed to "Software Setup" below.
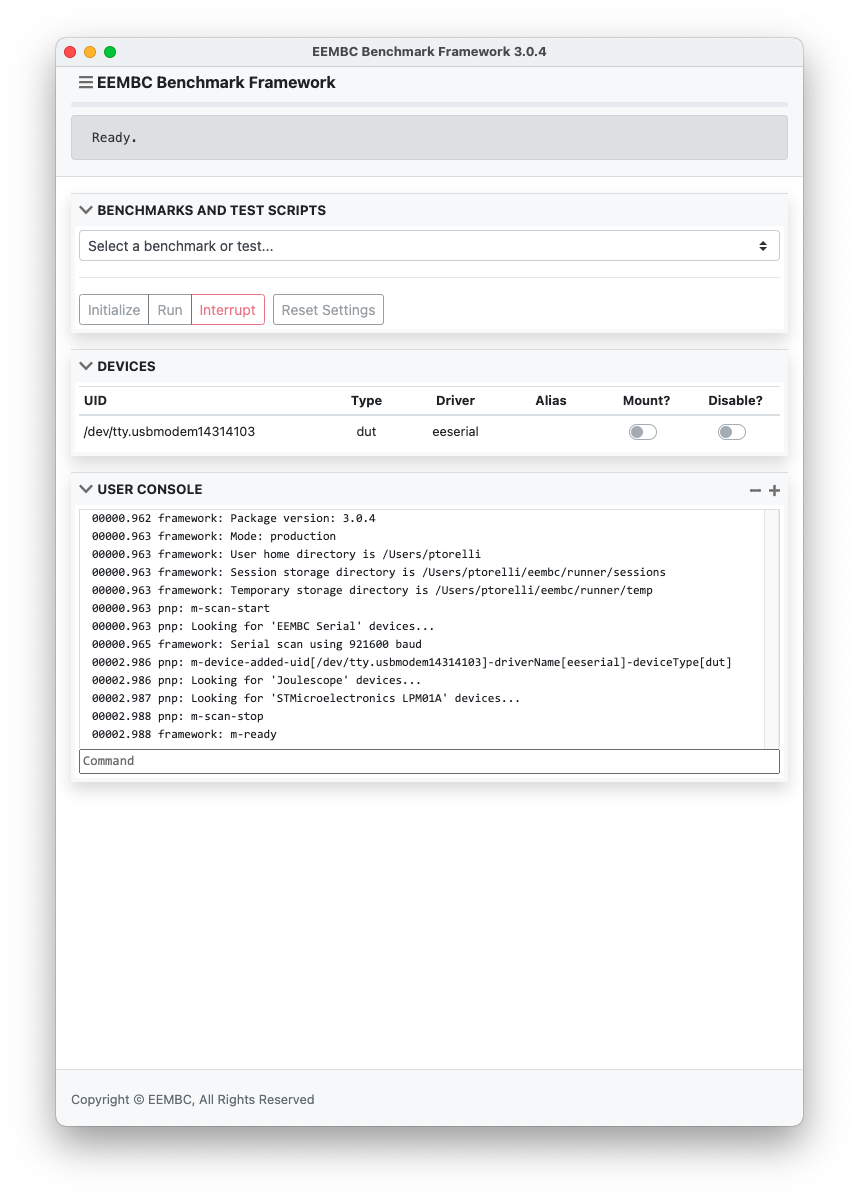
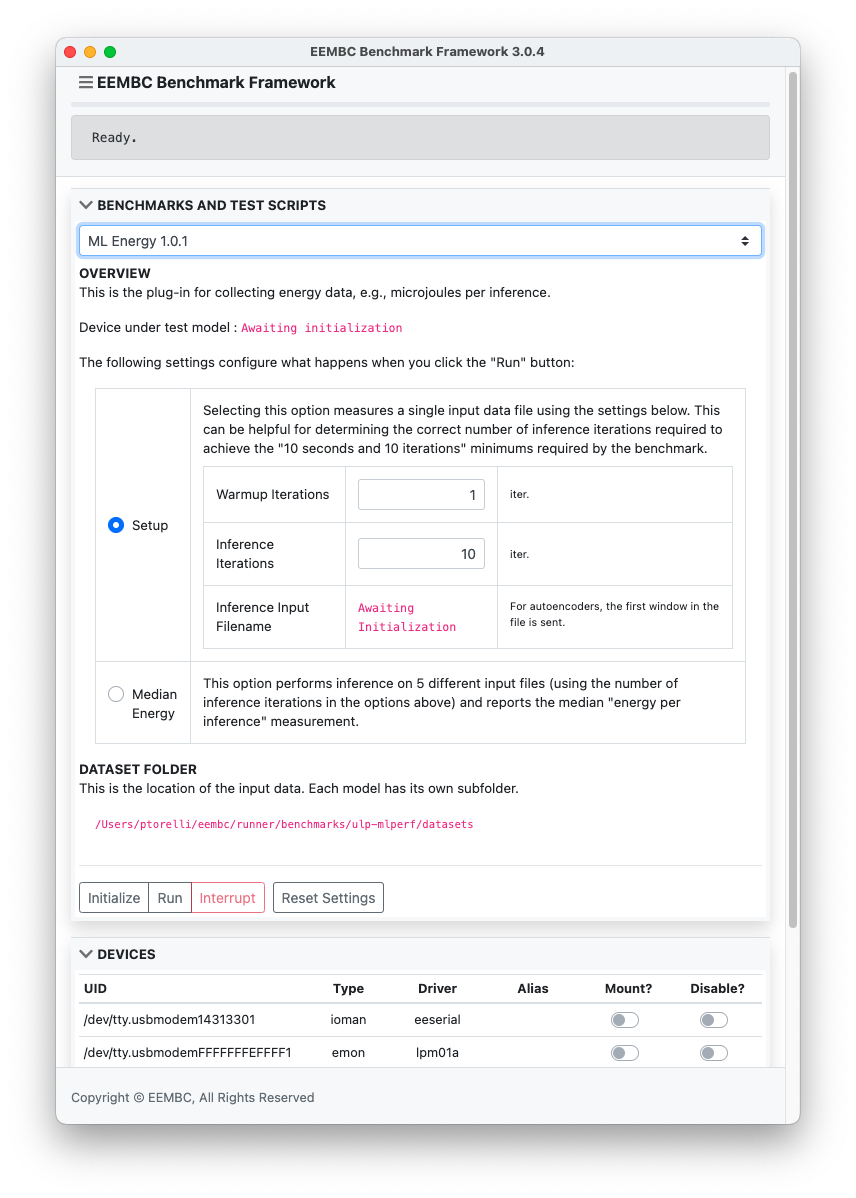
There are three OS releases: macOS, Ubuntu, and Win10. The macOS version is provided as a dmg file, Windows as 7z and Linux as a tar.gz. Open the application by double-clicking the icon in macOS, running EEMBC Benchmark Framework.exe in windows, or benchmark-framework in Linux. if everything booted properly this window appears:
In this example, a DUT is already connected to the system, so it is detected in the "Devices" panel and associated with a TTY device (or a COM port if Windows).
When the Host UI Runner first boots, it creates two things: an initialization file in $HOME/.eembc.ini, and directory structure to store benchmark input (such as datasets for inference) and output data (such as session logs from previous runs). By default, this is created under $HOME/eembc, but can be changed in the INI file, explained at the end of this document.
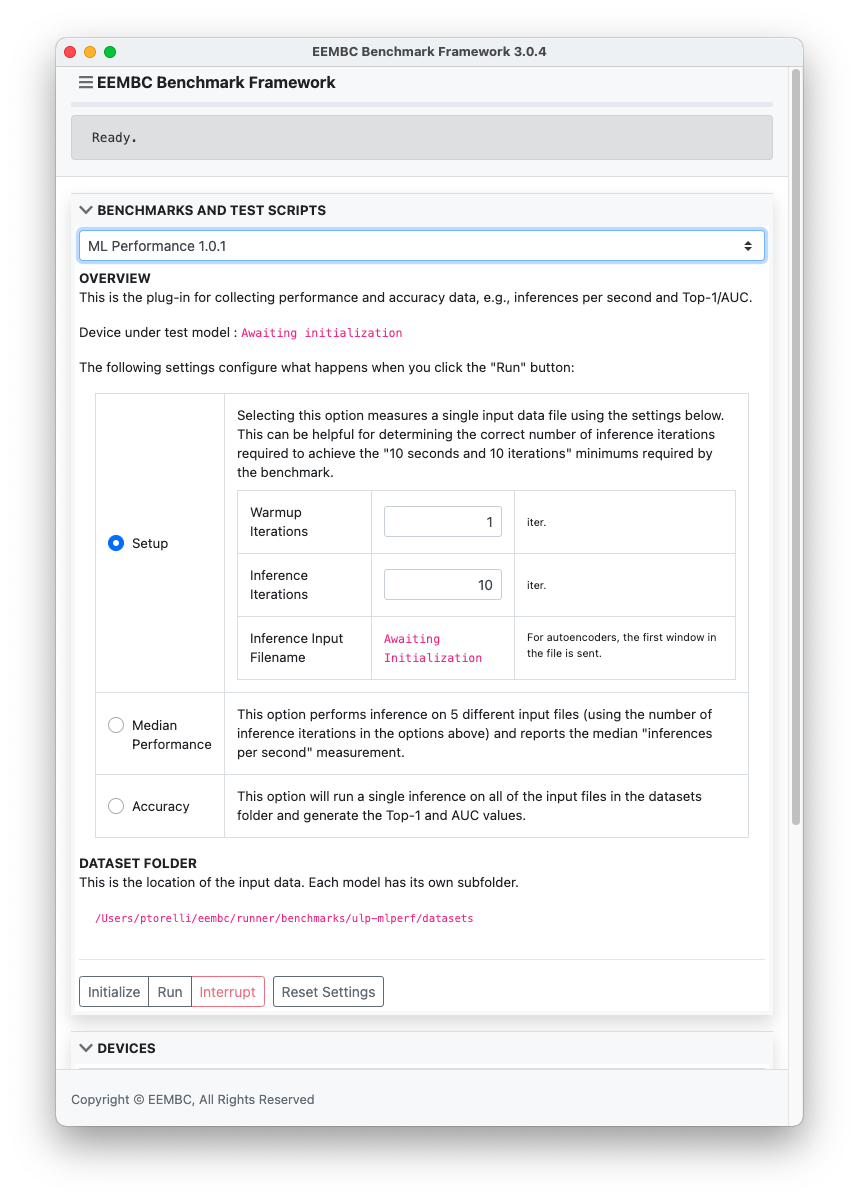
Under the Benchmarks and Test Scripts panel, choose one of the two benchmark plugins. We'll start with ML Performance. A configuration panel will appear:
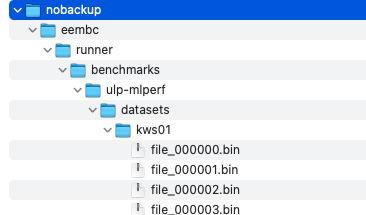
Take note of the directory (in red) in the center of the screen. This is a work directory that has been created. Copy the datasets folder from this repository into this folder. There is a README in this repositories dataset folder explaining the file formats.
Note 1: You must obtain the input files from the dataset. EEMBC cannot redistribute the input files. Refer to the README.md in the datasets folder for more information.
Note 2: The Runner will look in the subfolder defined in the firmware. It knows this because the Runner queries the DUT during initialization and the firmware is configured with the proper response string for each model port.
If you see warnings about missing VISA drivers, ignore them. (The code supports VISA test hardware, but it is irrelevant for performance testing. If the VISA scan takes too long, refer to the configuration options at the end of this document.)
Click Initialize under the benchmark section and the runner will mount the device and handshake. At this point, you can issue commands to the DUT by typing dut <command> in the User Console input line. Also note that the model name in the configuration panel has been set to ic01. Handshaking with the DUT causes the DUT to print a special query message alerting the runner of the correct model inputs to use.
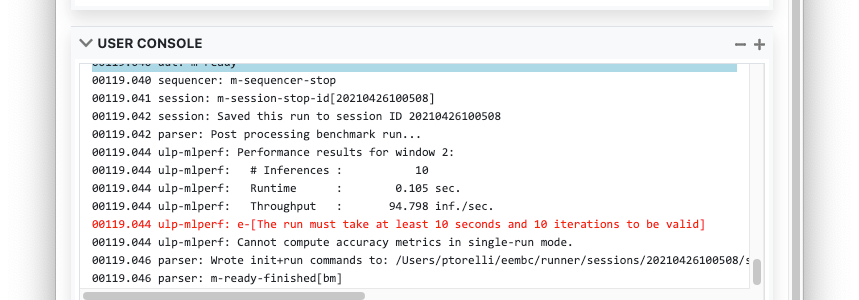
At this point, clicking Run will download the first binary input to the DUT using the db commands and collect a performance score. The difference between the two m-lap-us statements is the # of microseconds elapsed. The value will depend on the resolution of the timer implemented on your DUT.
That error message is common for first time. The benchmark needs to run for at least 10 seconds or 10 iterations to meet the minimum measurement requirements. In this case 10 iterations took 0.1 seconds, so we need to increase the inference iterations to 1000 to meet the 10-second requirement.
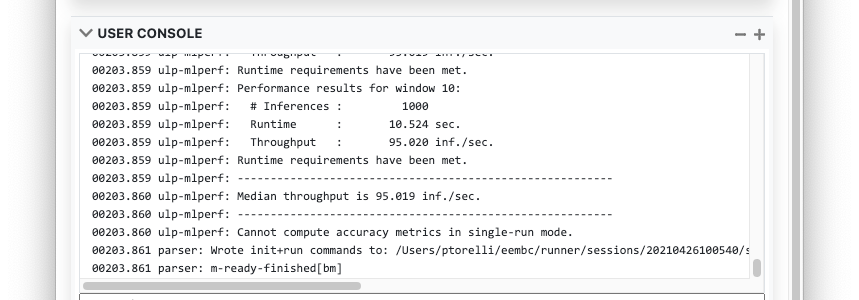
After changing the inference iterations, select the "Median Performance" option to run 5 different input files and takes the median of the inferences/second metric:
Also note that the transcript of this run is written to the sessions/20210... folder. Every run creates a session folder with current timestamp as its name. This is useful for reviewing previous runs to debug errors.
Selecting the "Accuracy" configuration option (not shown) will run all of the input files for that model and generate the Top-1 and AUC accuracy measurements. This can take one to two hours or more, depending on the speed of your hardware.
Under the Benchmarks and Test Scripts panel, choose one of the two benchmark modes. We'll start with ML Energy. A configuration panel will appear that looks similar to the ML Performance panel, except the "Accuray" option has been removed. At 9600 baud, this would take a very long time; it is quicker to run with the higher baud rate of performance emode.
Plug in the Energy Monitor (EMON) and the IO Manager, it should look like this:
Two devices appear, the EMON and the IO Manager.
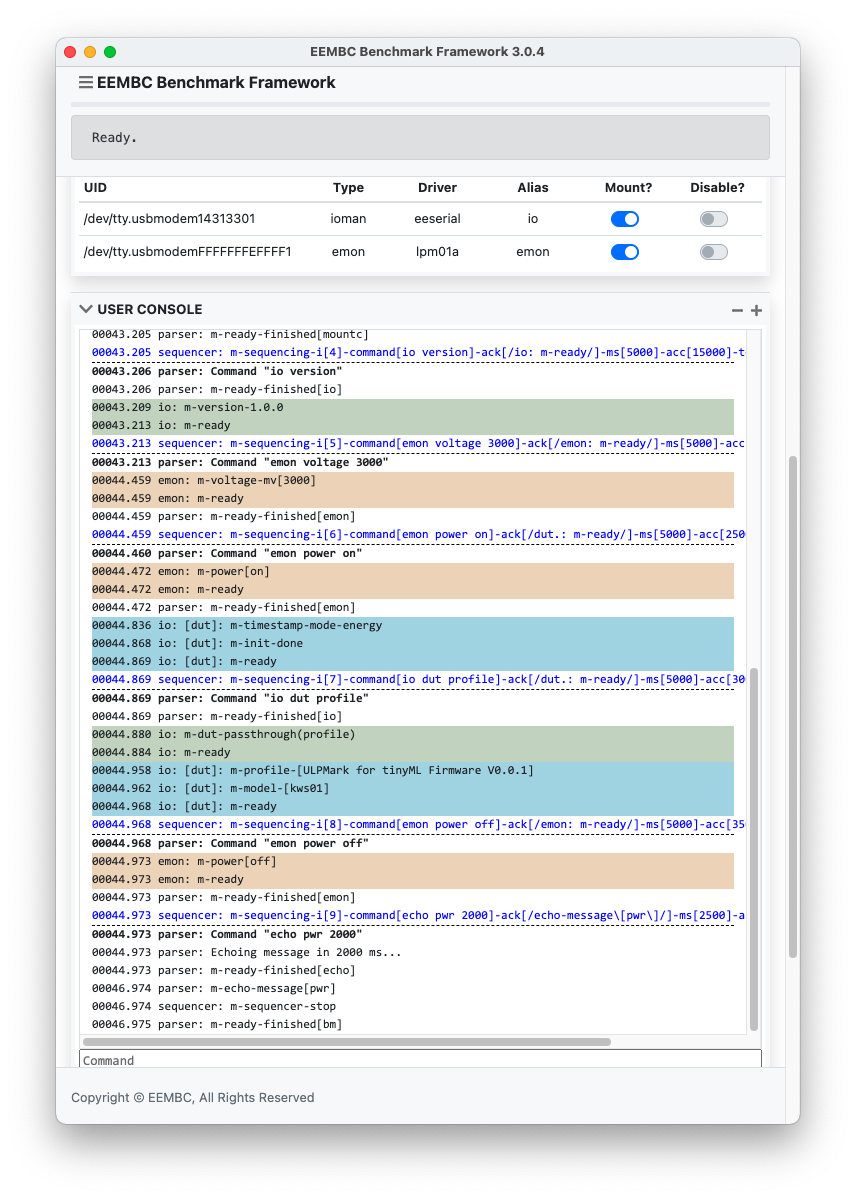
Click Initialize under the benchmark section and the runner will mount the device and handshake. If you click on the "+" sign in the upper-right of the User Console, and grow the window, it should look something like this:
The colors indicate which device is talking. Green is the IO Manager, Tan is the EMON, and Blue is the DUT. A lot of synchronized communcaiton is required to perform a simple handshake!
Advanced: Unlike Performance Mode, you cannot talk directly to the DUT right now because it is powered down. To issue a DUT command, scroll down to the EMON control panel, turn on the power, and then issue io dut <command>. The io prefix is necessary because you are sending the command to the IO Manager, which then passes it down to the DUT at the correct voltage.
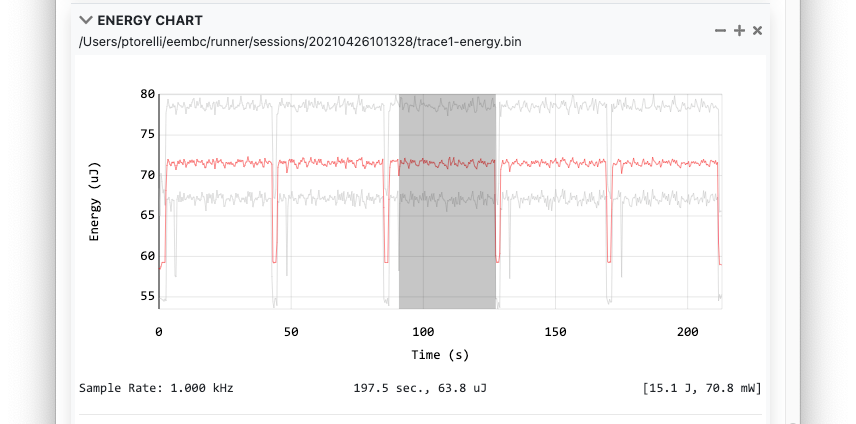
Assuming we've set the correct number of inference iterations we determined in our previous study, selecting "Median Energy" and clicking Run will start an official energy collection. When it completes, an energy window will pop up at the bottom of the screen, like this:
Hovering over the window list will highlight the region of the energy trace between the th_timestamp() calls. There are 5 regions of interest, the 3rd region is highlighted here. Notice how it appears a little bit of energy is not included in the highlighted region? Remember how the main loop in the code performs a warmup iteration before starting the timer? That region to the left of the highlight is the warmup iteration, followed by 10 measured iterations that fall within the timestamp.
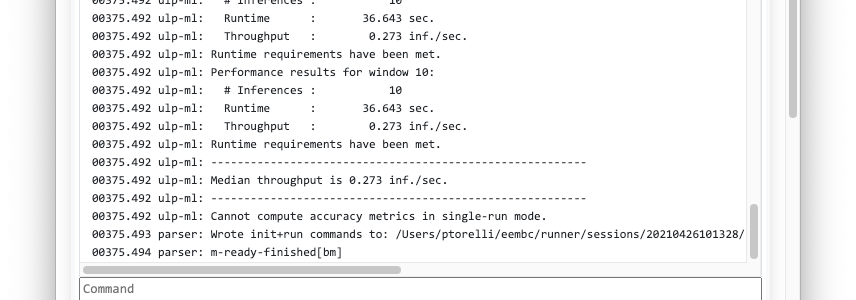
Each time a run completes successfully a new EMON window pops up; close them with the "x" in the upper-right corner. The User Console will indicate the energy and power in between the timestamps (plus a small time buffer of a few hundred microseconds to make sure we're in the middle of the run).
Here is the median score:
The default behavior of the runner can be modified with an initialization file. On startup, the Runner will create a default .eembc.ini in your home directory. On Linux and macOS this is $HOME, on Win10 it is %USERPROFILE%.
% cat $HOME/.eembc.ini
root=/Users/ptorelli
dut-baud=115200
dut-boot-mv=3000
default-timeout-ms=5000
emon-drop-thresh-pct=0.1
timestamp-hold-us=50
umount-on-error=true
use-crlf=false
use-visa=true
n6705-set-vio=true
disable-mute=false
These three are most relevant for the ML effort:
-
rootchanges where the Runner looks for input files, and saves output sessions. -
dut-baudsets the default Baud rate for serial detection in performance mode. This also controls the baud rate to the IO Manager. USE CAUTION If you change this from 115200 and forget to change it back, the framework won't detect the IO Manager! This is only for direct-connection of the DUT. -
dut-boot-mvselects the voltage used while querying the device on initialization (prior to making the EMON voltage setting available to the user). -
disable-muteturns off the muting feature when download input datasets to the DUT. The download process can generate hundreds of thousands of messages, clogging up log files and the display, so by default the disable is off (false). However, for debugging UART issues it might help to have all of these messages, so setting this flag totruewill produce lots and lots (and lots) ofdb ...messages.
Other settings are listed here for the sake of completeness:
-
default-timeout-msis the default timeout value for unspecified asynchronous scripting. -
emon-drop-thresh-pctis the maximum number of dropped samples allowed for slow EMON connections. -
timestamp-hold-usis the number of microseconds to filter noisy timestamps -
umount-on-errorcauses all devices to un-mount if there is an error, forcing re-initialization -
use-crlfprints CRLF at the end of all log file messages, rather than a single LF. -
use-visaenables/disables communication with the VISA drivers on the system. Some drivers are quite slow to detect, and if no VISA devices are used, it can speed the Runner boot-time by disabling this. -
n6705-set-vioenables/disables automatically setting the IO channel of the N6705. This may be necessary if the MCU board-input voltage differs from the GPIO voltages due to an intermediate SMPS/LDO.
When the Runner boots, it scans all of the scans all the serial ports searching for compatible firmware. During performance mode, it does this by sending the name% command and waiting up to 2 seconds for the port to respond with m-ready. If successful, the device will appear in the device console. If it does not show up, it could be due to the following:
- The Runner's default baud rate does not match the device's baud rate; make sure the baud rates are the same and using 8N1 settings.
- The device took too long to reply; minimize the amount of code executing between power-on and
m-ready. - The USB subsystem did not initialize before the plug-in event was sent; exit the runner, plug the device in, restart the runner
Also, every time a USB device changes, the system needs to perform a scan for a long list of hardware. If you have many USB devices connected to your system and this is taking a long time, it is recommended to not swap USB devices while running. Making this worse, some OSes report the USB change notification before the drivers are loaded and the device has booted, which leads to a timeout and "No compatible devices detected."
TL;DR: Sometimes a device is not detected when hot-plugged. The solution is to plug in all devices first, wait a few seconds for your device to boot, and then start the runner.
- Does
lsusb, or Windows Device manager see the device? - Is there a /dev/tty* or COMx: port associated with it?
- Can you connect to the device with "minicom -D... --baud 115200" (or PuTTY, TeraTerm or the Arduino Serial Monitor)?
- Can you send the
name%command and get a responsem-name...?
If these work, you now need to check if your DUT RX (and TX) ISR buffering works properly. This is necessary because human typing introduces natural delays that allow the FIFOs to drain, whereas the runner sends the commands at computer speed (no delay between characters, just the stop bit). If the UART character read loop and ISR buffering is not implemented properly characters can be lost.
Remember that the parser in the firmware uses % as the terminating character. This means the moment you type % the current buffer is sent to the parser in the firmware. If your terminal program sends a carriage return or linefeed, \r or \n, respectively, it will cause a syntax error. Configured your terminal program to send each character as soon as you type it, or if sending lines, do NOT send CR and/or LF.
- In a text editor create a long string of concatenated commands, like: "name%name%name%name%name%name%name%name%"
- Copy and paste this string into minicom, we are attempting to overflow the DUT Rx buffer by removing human typing delays
- Do all of the commands execute properly?
Note: nomrally the runner has a handshake (it waits for m-ready), and will not send more than one command or 64B without a handshake, but this is just a test to see if the inputs can be buffered while transmitted.
- Is the baud rate in
~/.eembc.inithe same baud rate as the DUT?
If all of these pass, then please file an issue listing the DUT hardware and the version & OS of the runner.
The most common problem is not verifying that the DUT Tx/Rx lines are sending or receiving data. You will need a logic analyzer or scope to verify this. Please verify this before raising an issue.
The vast majority of the problems have been related to:
- Accidentally swapping Tx & Rx pins
- Using the wrong baud rate (115200 for performance mode, 9600 for energy mode)
- Not connecting the SDK's
printfstdout to the UART Tx pin - Not connect the UART Rx interrupt to anything
- Not having sufficient buffering in the Rx ISR
If using the IO Manager in Energy Mode:
- Not wiring the Level Shifters properly
- Not switching to 9600 baud in the firmware
If you are not seeing the power-on message from the DUT during "Initialize", the EMON will time-out because it only waits 5000 ms for the DUT to boot.
The first debug step should be to verify that when power is applied to the DUT from the EMON that you see the Tx output pin print the prologue message. This is the first thing the DUT does in main.c. The message ends with "m-ready\r\n" which lets the GUI know it may proceed to the next step.
If that message does not appear, your UART is not configured properly. If it does appear on the DUT Tx, trace that signal out of the level shifter and into the DUT. Is there a wiring problem across the level shifter? Then trace to the IO Manager. You should see the power-on message at the input to the IO Manager. This is by far the most common problem: bad wires, wire connected to the wrong breadboard hole, wire connected to the wrong GPIO, etc.
If using linux, make sure your account is a member of group dialout:
% sudo usermod -a -G dialout $USER
You will need to log out for this to take effect.
If using a Joulescope, it requires this UDEV rule.
If using the R&S VISA drivers for the N6705 on Linux (Ubuntu 18 & 20), create this rule:
% sudo su
% echo 'SUBSYSTEM=="usb", ATTR{idVendor}=="0957", ATTR{idProduct}=="0f07", GROUP="users", MODE="0666"' > /etc/udev/rules.d/99-keysight.rules
% sudo udevadm control --reload-rules && udevadm trigger
% exit
If you see a message like the following:
00195.677 emon: e-[Dropped more than 0.1% of packets]
This most likely means you are using a Joulescope on a Mac M1. The current version of the GUI does not support M1 silicon natively, so the USB code has to go through a translation, which slows it down considerably. It is recommended to use an x86 Mac, Linux, or Windows machine. This is currently issue #21.
When measuring energy, the DUT is electrically isolated from the system, and uses the IO Manager to relay messages from its UART to the host. The IO Manager is half-duplex, which means if it is sending commands to the DUT, and the DUT is sending back data at the same time, there will be corruption. Typically this will appear as the DUT reporting an error like e-?<partialtext> where the partial text is whatever part of the transmitted message was seen by the DUT. The run scripts inside the GUI are specifically designed to use a send/acknowledge protocol to avoid contention. However, if you have added debug messages to your DUT, these might interfere, especially if they occur after the acknowledge m-ready\r\n from the DUT. If you are seeing these errors, it is most likely related to debug message placement, try moving them before the acknowledge message.
| Component | Product | Links |
|---|---|---|
| Energy Monitor (50mA max.) | STMicro. LPM01A (v1.0.6) | STM - Farnell - Mouser |
| Level Shifter | BSS138 x4 | Adafruit - Digikey |
| IO Manager | Arduino UNO | Arduino - DigiKey |
| Breadboard | Pololu 400pt | Pololu - Digikey |
| Hookup Wires | E-Z-Hook | E-Z-Hook - DigiKey |
| Headers (extra tall) | Samtec Inc. | Samtec - DigiKey |
All content on this repository is Copyright of EEMBC.
