IRIS DATASET 150 records Every record has 4 features of datatype float and 1 true class index of datatype integer.
# Pattern Recognition
# Classification of Iris Dataset
import numpy as np
import matplotlib.pyplot as plt
import os
import urllib.request

# Load Iris
class Irisdataset:
    feature_names = ['Sepal length', 'Sepal width', 'Petal length', 'Petal width']
    set_names = ['Iris-setosa', 'Iris-versicolor', 'Iris-virginica']

    # trn: number of traning examples
    # 150-trn: number of test examples
    def __init__(self, trn=120):
        # 0<=TR_data<=150
        N = trn
        # Testing samples 150-N
        self._AR = np.zeros((150, 5))

        if not os.path.isfile('iris.data'):
            print('Download IRIS dataset')
            urllib.request.urlretrieve(
                "https://archive.ics.uci.edu/ml/machine-learning-databases/iris/iris.data",
                "iris.data"
            )
            print('Download complete')

        with open('iris.data', 'r') as f:
            i = 0
            for Line in f:
                line = Line[:-1].split(',')
                line[0] = float(line[0])
                line[1] = float(line[1])
                line[2] = float(line[2])
                line[3] = float(line[3])
                if(line[4] == 'Iris-setosa'):
                    line[4] = 0.0
                elif(line[4] == 'Iris-versicolor'):
                    line[4] = 1.0
                elif(line[4] == 'Iris-virginica'):
                    line[4] = 2.0

                self._AR[i] = np.array(line)
                i += 1
                if i == 150:
                    break
        self._AR = np.random.permutation(self._AR) # random sort
        self.TrainData = self._AR[:N]
self.TestData = self._AR[N:]One Layer Perceptron with 3 simple neurons,
choice two features for classifier inputs,
Training set: 120 examples
Test set: 30 examples
Final classification error average errors choosing training & test examples 5 times at random.
# Methods
Hot = lambda x:[1 if i==x else -1 for i in range(3)]
learning_rate = 0.7
total_test_error = 0
f0 = 3
f1 = 1
for cnt in range(5):
iris = Irisdataset(120) # 120 train data
train_data = iris.TrainData[:,[f0,f1]]
train_hot = -1*np.ones((120,3))
train_hot[range(120),iris.TrainData[:,-1].astype(int)] = 1
test_data = iris.TestData[:,[f0,f1]]
test_hot = -1*np.ones((30,3))
test_hot[range(30),iris.TestData[:,-1].astype(int)] = 1
W = np.random.rand(2, 3) # Weights
B = np.random.rand(1, 3) # Bias
# Training
# update W, B 200 times or Epochs = 200
for i in range(200):
tr_error = 0
for tr_d,tr_hot in zip(train_data,train_hot):
# forward pass
tr_d = tr_d.reshape(1, 2)
neurons_outs = np.dot(tr_d, W)+B
# outputs indexis with wrong prediction class
tr_error+=np.where(neurons_outs*tr_hot<0)[0].size>0
# backward pass
neurons_outs[np.where(neurons_outs*tr_hot>0)] = 0
neurons_outs = np.sign(neurons_outs)
# Deltas
DW = -learning_rate*np.dot(tr_d.T,neurons_outs)
DB = -learning_rate*neurons_outs
# Update
W += DW
B += DB
test_neurons_outs = np.dot(test_data, W)+B
test_prediction = test_neurons_outs.argmax(1)
ts_error = sum(test_hot.argmax(1) != test_prediction)
total_test_error += ts_error
print('Round {0:d}: Test error={1:.2f}'.format(cnt+1, ts_error/30))
print('\nAverage Test error={0:.2f}'.format(total_test_error/(5*30)))Minimize MSE of a linear classifier using normal equation. Using all features for train & validation.
# Methods
def normal_eq(X,Y):
    W = np.linalg.inv(np.dot(X.T, X))
    W = np.dot(np.dot(W, X.T), Y)
    return W
iris = Irisdataset(150)
def_tr_index = lambda x,n:[False if j==x else True for j in range(n)]
error = 0
S_Examples = iris.TrainData
N = S_Examples.shape[0]
S_Data = S_Examples[:,:-1]
S_Data = np.concatenate((np.ones((N,1)),S_Data),axis=1)
S_Hot = np.zeros((N,3))
S_Hot[range(N),S_Examples[:,-1].astype(int)] = 1
for i in range(N):
tr_index = np.array(def_tr_index(i,N))
tr_data = S_Data[tr_index]
tr_hot = np.array([S_Hot[tr_index] == 1]).reshape(-1,3)
ts_data = S_Data[i].reshape(1,-1)
ts_hot = np.array([S_Hot[i] == 1]).reshape(-1,3)
W = normal_eq(tr_data,tr_hot)
W[0,:]+=0
ts_pr = np.dot(ts_data,W)
cl_p = np.sum(ts_pr.argmax()!=ts_hot.argmax())
error += cl_p
print('Test error: {0:.2f}'.format(error/N))- hypothesis 1: all features are independent and following the normal distribution
- hypothesis 2: all fatures follow 4D normal distribution
# Methods
Normal_dist = lambda x,avg, std: 1/np.sqrt(2*np.pi*std**2)*np.exp(-(x-avg)**2/(2*std**2))

ND_mahalanobis = lambda x,mean,S: np.dot(np.dot((x-mean).T,np.linalg.inv(S)),(x-mean))**(1/2)

def ND_normal_dist(x,mean,S):
    m_dist = ND_mahalanobis(x, mean, S)
    constant = 1/((2*np.pi)**(4/2)*np.linalg.det(S)**(1/2))
    return constant*np.exp(-1/2*np.square(m_dist))
iris = Irisdataset(150) # all dataset
error_h1=0 # hypothesis_1 error
error_h2=0 # hypothesis_2 error
def_tr_index = lambda x:[False if j==x else True for j in range(150)]
for i in range(150):
tr_index = np.array(def_tr_index(i))
tr_data = iris.TrainData[tr_index]
# get i_th record for validation
vl_data = iris.TrainData[i]
# Estimate maximum likelihood per feature
# AVG - STD
# Setosa
tr_setosa = tr_data[np.where(tr_data[:,4] == 0)][:,:4]
tr_setosa_avg_per_feature = np.mean(tr_setosa,axis=0)
tr_setosa_std_per_feature = np.std(tr_setosa, axis=0)
# Versicolor
tr_versicolor = tr_data[np.where(tr_data[:,4] == 1)][:,:4]
tr_versicolor_avg_per_feature = np.mean(tr_versicolor, axis=0)
tr_versicolor_std_per_feature = np.std(tr_versicolor, axis=0)
# Virginica
tr_virginica = tr_data[np.where(tr_data[:,4] == 2)][:,:4]
tr_virginica_avg_per_feature = np.mean(tr_virginica, axis=0)
tr_virginica_std_per_feature = np.std(tr_virginica, axis=0)
# hypothesis 1 START
# Test Model
# class confidence per feature
h1_conf_setosa = Normal_dist(vl_data[:-1], tr_setosa_avg_per_feature, tr_setosa_std_per_feature)
h1_conf_versicolor = Normal_dist(vl_data[:-1], tr_versicolor_avg_per_feature, tr_versicolor_std_per_feature)
h1_conf_virginica = Normal_dist(vl_data[:-1], tr_virginica_avg_per_feature, tr_virginica_std_per_feature)
# prediction_class
arg_max_class_conf_per_feature = np.argmax([
h1_conf_setosa,
h1_conf_versicolor,
h1_conf_virginica
], axis=0)
counts = np.bincount(arg_max_class_conf_per_feature)
h1_prediction_class = np.argmax(counts)
# add 1 if true_class != prediction_class
error_h1 += h1_prediction_class != vl_data[-1]
# hypothesis 1 END
# hypothesis 2 START
# calculate converance by class
tr_setosa_cov = np.cov((tr_setosa).T)
tr_versicolor_cov = np.cov((tr_versicolor).T)
tr_virginica_cov = np.cov((tr_virginica).T)
# class confidence
h2_conf_setosa = ND_normal_dist(vl_data[:-1].reshape(4,1),tr_setosa_avg_per_feature.reshape(4,1),tr_setosa_cov)
h2_conf_versicolor = ND_normal_dist(vl_data[:-1].reshape(4,1),tr_versicolor_avg_per_feature.reshape(4,1),tr_versicolor_cov)
h2_conf_virginica = ND_normal_dist(vl_data[:-1].reshape(4,1),tr_virginica_avg_per_feature.reshape(4,1),tr_virginica_cov)
h2_prediction_class = np.argmax([h2_conf_setosa, h2_conf_versicolor, h2_conf_virginica])
# add 1 if true_class != prediction_class
error_h2 += h2_prediction_class != vl_data[-1]
# hypothesis 2 END
print(error_h1/150)
print(error_h2/150)- Perceptron:
Round 1: Test error=0.13
Round 2: Test error=0.33
Round 3: Test error=0.20
Round 4: Test error=0.10
Round 5: Test error=0.40
Average Test error=0.23 - MSE method:
Test error: 0.18 - Naive Bayes:
hypothesis 1 Test error: 0.1
hypothesis 2 Test error: 0.026
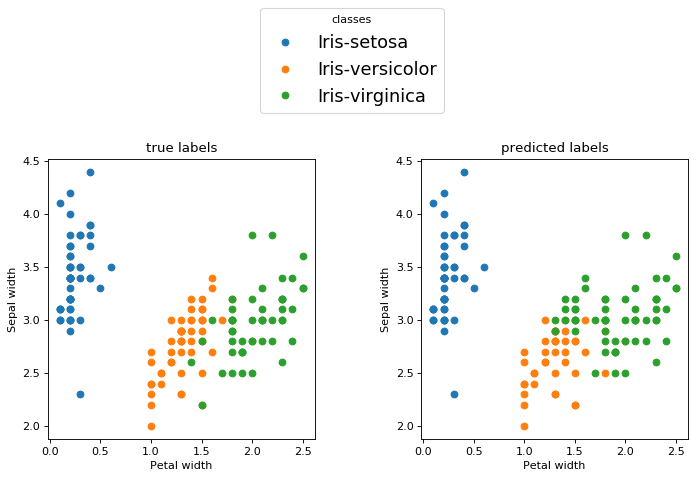
As you can see all classes couldn't be separated with a single line.

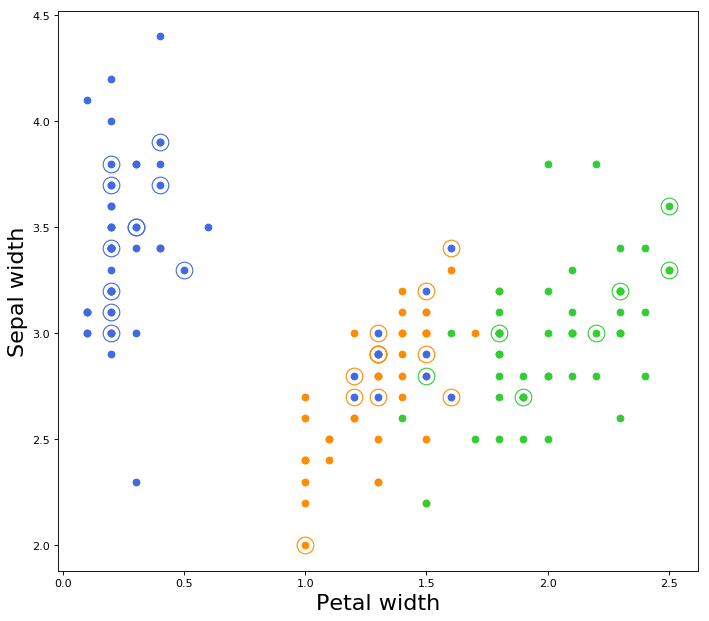
From the above image if we choose the features Sepal-Width and Petal-Width, the classes are relatively linearly separable from one another.
All test data marked as circle with dot in center.
Color of circle is equivalent to true label,
Color of dot is equivalent to predicted label.

This 4-D hyperplane is not able to seperate fully the data of the classes.
Something interesting happens though if we choose to show the examples from the two features

This 4-D hyperplane works as a non-linear classifier for these two features.
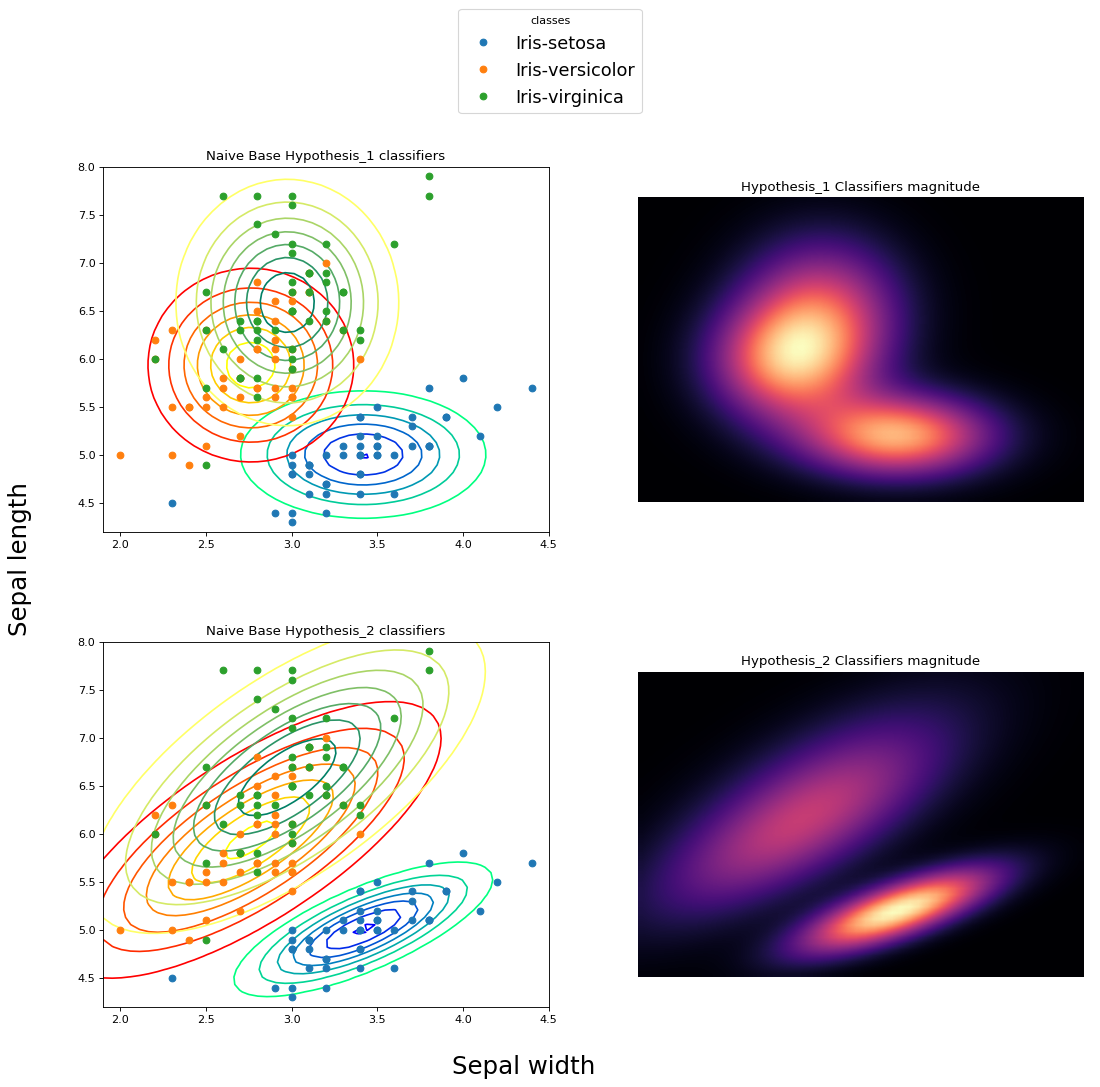
In he next picture, the second classifier fits better on the dataset. Both classifiers have the attribute of vertical and horizontal "stretching". The second clarifier achieves to make relationships between features and this could be described as a slope.
