This is a small program that analyzes a recording of a watch or clock and tells you how slow or fast it runs. You can use this to regulate a mechanical watch using, eg, a cell phone to record its ticking.
$ python fourier.py recording.wav

initial guess: 6.0       p/m 0.00606  Hz
updated guess: 5.9998549 p/m 1.88e-05 Hz
error is -2.1 seconds / day
The file recording.wav should be a mono sound file. My cell phone
has a “voice memo” program that records audio using the built-in
microphone. It’s plenty sensitive for this purpose.
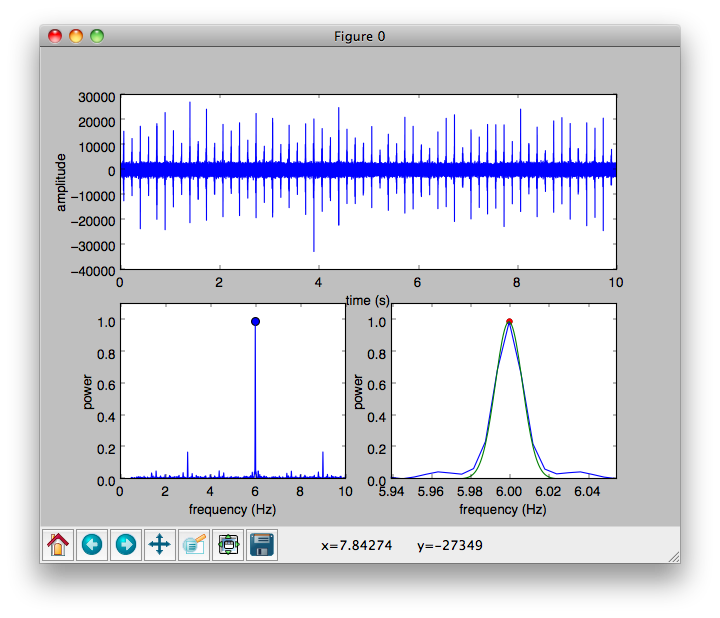
With a good-quality recording, you’ll see something like this:
The top panel shows the last 10 seconds on the recording… this lets you evaluate the quality of your data. Here, you can clearly see the individual ticks, and that this watch ticks 6 times per second. The signal-to-noise ratio is probably 10ish or so in this example.
The bottom left plot shows the Fourier transform of the recording, zoomed in to the range of 0.5-10 Hz. The spike in this plot corresponds to the tick frequency of the watch. It’s close to 6 ticks/per second, where it should be… but how close?
The bottom right plot shows a fit to the peak, used to estimate the frequency to high precision. This precision easily matches the frequency stability of a mechanical watch (which varies slightly due to differences in temperature and orientation, among other things).
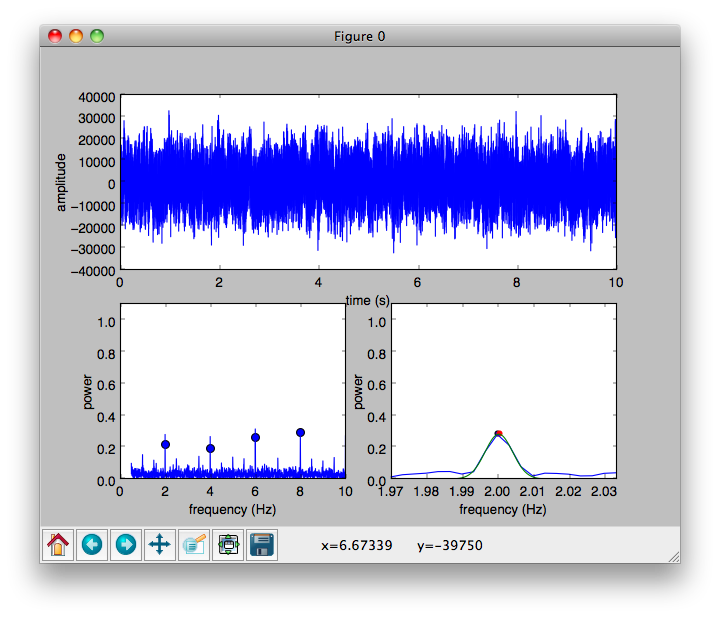
With a (very) low quality recording, you’ll instead see something like this:
Here, the individual ticks are buried in the noise… but the program still picks them out! You need a longer recording to reach the same level of precision, however.
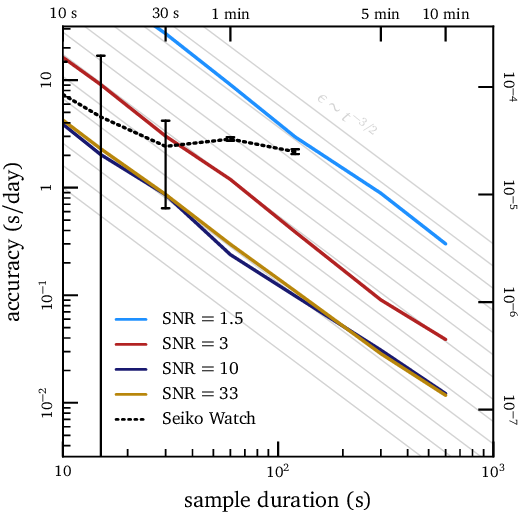
I’ve tested the program using synthetic signals generated a couple of different ways. The results are summarized in the plot above.
The fractional uncertainty in the measurement scales falls with the length of the recording to the (3/2) power. It also depends on the quality of your measurement. So, while you want to make as good of a recording as you can, it may be easier to make up for quality with quantity. I find that 5 minutes of crappy data is about as good as 30 seconds of perfect data. But leaving your watch and phone alone in a sock drawer for 5 minutes is a lot easier than going out and buying a better microphone. So it’s up to you.
If the data is so bad that you can’t even hear ticks in the recording, you may be in trouble, though. Try again in a quieter place, or find a better microphone. (And, of course, make sure your clock actually ticks.)
The dotted black line shows measurements of a real watch. I wanted to adjust it to run with a few seconds per day and found a recording of 30 seconds or one minute was adequate for the task. You nudge the regulator bar, record for a minute, nudge again, and so on until you get an answer you’re happy with. I got it regulated to within about 2 seconds per day, which was my goal. That translates to an error of less than a hundredth of a tick over the span of the recording, which is pretty impressive, I think!
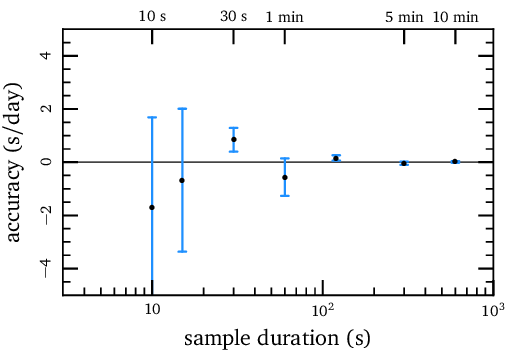
The plot above shows a test using a synthetic ‘tick’ signal generated using Audacity. This shows that the uncertainty reported by the program is a pretty meaningful representation of the true, “1-σ” uncertainty.
The code is pretty straightforward, and most of the effort went into making it run predictably without any human intervention. I Fourier transform the input signal to measure the peak frequency. Before transforming, i hit the signal with a Gaussian window… I choose the shape of the window such that frequency peaks will have a Gaussian shape with a width of ~3 frequency bins. This can be fit accurately with a Gaussian profile, yielding a good estimate of the true frequency. You can look at the plots to get a sense of how well it’s working.
I use a scipy function to automatically identify the peaks, which seems to work pretty well.
And I attempt to identify an “optimum” length for the FFT. No problems with it so far.
Results aren’t sensitive to the sampling frequency, unless it’s too low to adequately resolve the ‘ticking’ sound of the clock. But the program runs pretty fast, so there’s no reason not to just use the 44.1 kHz sampling rate that’s pretty standard.
- Automatically suggest whether the user needs a longer recording, or if we have enough data to make an accurate measurement.
- improve handing of noise?
- improve the (3/2) scaling? if that’s even possible?


