PerfMark is a low-overhead, manually-instrumented, tracing library for Java. Users can add the tracing function calls to their code to see how long each part takes.
-
Very Low Overhead: When enabled, tracing a function call adds about 70ns. Tracing is done in a lock-free, wait-free, thread local buffer, which avoids interfering with your latency-sensitive code.
-
Dynamically Enabled: PerfMark can be enabled or disabled at runtime. When disabled, PerfMark has zero overhead, taking advantage of the JIT compiler to remove the tracing.
-
Inter-thread Communication: Existing profilers have difficulty expressing which thread wakes up and executes work on another thread. PerfMark allows users to express this relationship explicitly, making for a clear picture of how code flows.
-
Small Library Size: The PerfMark tracing API is only 5 KB in size, and has minimal dependencies making it easy to include in other projects. If no backend for recording the trace is present, the library safely disables itself.
-
Multiple Java Versions: The PerfMark API supports Java 6, making it easy to include on older or constrained environments. Additionally, PerfMark includes optimized backends for Java 6, Java 7, and Java 9. Each of these backends is automatically loaded at runtime (if possible) and uses advanced JVM features for maximum speed.
-
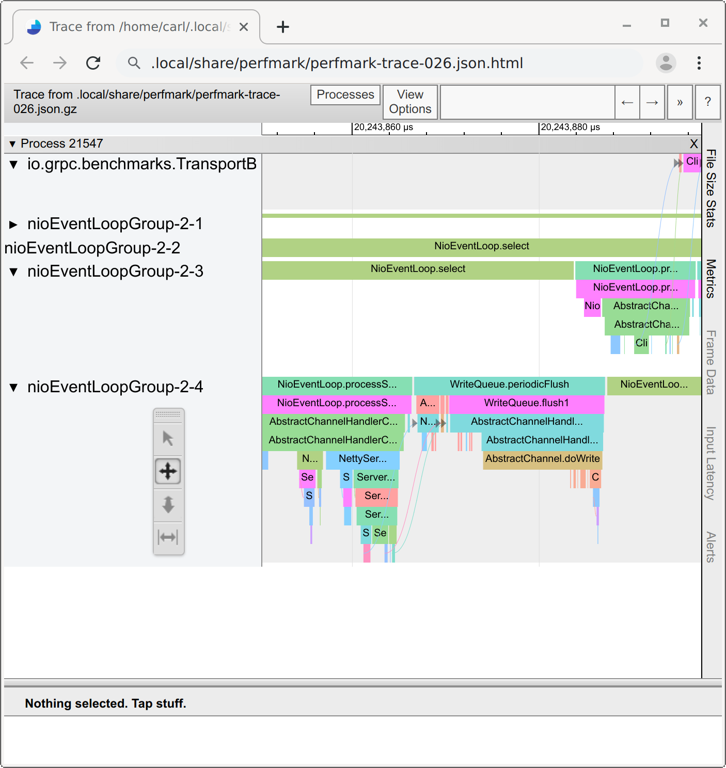
Chrome Trace Viewer Integration: PerfMark can export to the Chrome Trace Event Format, making it easy to view in your Web Browser.
To use PerfMark, add a dependency on io.perfmark:perfmark-api:0.20.1. In your code, add the
PerfMark tracing calls like so:
Map<String, Header> parseHeaders(List<String> rawHeaders) {
  PerfMark.startTask("Parse HTTP headers");
  try {
    Map<String, String> headers = new HashMap<>();
    for (String rawHeader : rawHeaders) {
      Header header = parseHeader(rawHeader);
      headers.put(header.name(), header);
    }
    return headers;
  } finally {
    PerfMark.stopTask("Parse HTTP headers");
  }
}
PerfMark can also be used to record asynchronous work:
Future<Response> buildResponse() {
  PerfMark.startTask("Build Response");
  final Link link = PerfMark.linkOut();
  try {
    return executor.submit(() -> {
      PerfMark.startTask("Async Response");
      PerfMark.linkIn(link);
      try {
        return new Response(/* ... */);
      } finally {
        PerfMark.stopTask("Async Response");
      }
    });
  } finally {
    PerfMark.stopTask("Build Response");
  }
}
To view the traces in your browser, generate the HTML:
  PerfMark.setEnabled(true);
  PerfMark.startTask("My Task");
  } finally {
    PerfMark.stopTask("My Task");
  }
  TraceEventViewer.writeTraceHtml();
}
The output looks like:
PerfMark uses Semantic Versioning, and thus will not break existing APIs within a minor version update. PerfMark may need to disable some functionality, and thus may need to make some tracing calls become No-ops. In such cases, it will remain safe to call these functions being recorded.
PerfMark was designed originally for gRPC.

