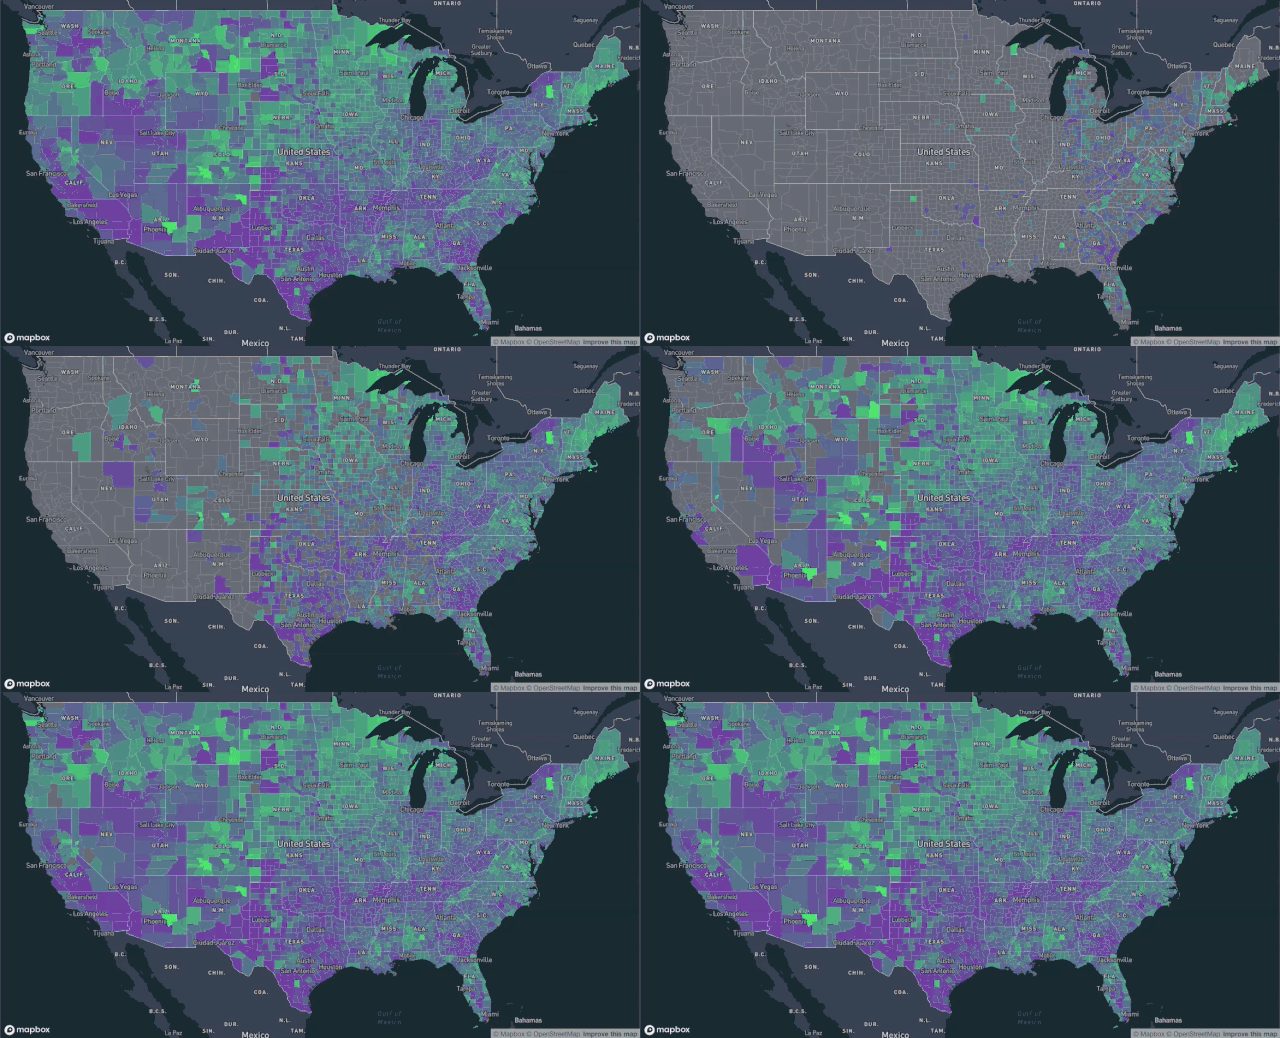
This is a reference architecture for visualizing real-time data with Mapbox.
It includes an election-based example where counties are updated live with voter participation data sent from a server. The data for this example is based on historic election participation and is animated using simulated poll-closing times.
- Quick start
- Development
- Using a custom front-end
- Deployment
- Built with
- Authors
- License
- Acknowledgments
Add a valid Mapbox access token to your environment. Tokens can be added via your shell:
export REACT_APP_MAPBOX_TOKEN=<your Mapbox token>Tokens can also be added to a .env file. See sample.env for an example of how to structure your .env file.
Once the environment is configured, install dependencies and start the application.
npm install
npm start
Your browser will open a page displaying a map of US counties. Over time, the counties change color as the server reports the number of votes cast in each county.
You need a recent version of Node.js. This architecture was tested with Node 12.8, 10.16, and 8.16.
You need an active Mapbox account and access token.
The code for this project is organized in three top-level directories.
client/     -- web front-end that joins tiled geometry and real-time data from the server
server/     -- SSE server that emits mock voter turnout data over time
data/       -- script for data upload, county boundary data, and election participation data
Two sources of data need to be joined at runtime for the real-time visualization to work. One is the source geometry, which is served as tiles from Mapbox. The other is a sequence of real-time messages.
The source geometry goes through a series of transformations before being tiled. We first make sure that it has the attributes we care about and then format it as a GeoJSON sequence. Once uploaded, the Tilesets API lets us further filter the data and limit what is served in our tiles to only what our application needs.
At runtime, the client joins tiled geometry to live data streamed from a server and styles it based on their real-time values.
In order to join the two sources of data, the geometry needs a property that matches the real-time data from the server. For this application, we store the county FIPS code as the feature ID to use for runtime joining.
The data join happens by setting the map's feature-state whenever new data is received from the server.
map.once("style.load", () => {
    subscription = electionData.subscribe(update => {
    if (update === RESET) {
        map.removeFeatureState({ source: "composite", sourceLayer: realtimeLayerID });
    } else {
        update.forEach(county => {
            const voteProportion = county.votes_total / county.population;
            if (county.geoid === "NA") {
                return;
            }
            // Assign the `voteProportion` feature-state to the source feature
            // whose ID matches the county's geoid
            map.setFeatureState(
                { source: "composite", sourceLayer: realtimeLayerID, id: county.geoid },
                { voteProportion }
            );
        });
    }
});
An expression in the map's style object determines how the feature-state is interpreted as a visual on the map.
map.setPaintProperty(realtimeLayerID, "fill-color", [
    "case",
    ["!=", ["feature-state", "voteProportion"], null],
    // if we have turnout information for a feature, use it to interpolate a color
    [
        "interpolate",
        ["exponential", 2],
        // use the value of the `voteProportion` feature-state as an input
        ["feature-state", "voteProportion"],
        // color low turnout purple
        0.3,
        "rgba(127, 0, 200, 0.6)",
        // color high turnout bright green
        0.7,
        "rgba(0, 255, 80, 0.9)"
    ],
    // if there is no turnout information, use gray
    "rgba(127, 127, 127, 0.5)"
]);
Because the state and the style work in conjunction, the visual map updates in real-time whenever new data is received from the server and assigned to a value in feature-state.
You can upload the US county geometry and use it within your own account by following the steps outlined in the data README.
A typical geometry feature follows. It has many properties, like STATE_NAME, that we can use in our tilesets recipe for deciding when and how to include data in our tileset. We use the GEOID as the feature id in our tileset, which lets us connect the tiled data to our real-time information about each county.
{"type": "Feature", "properties": {"STATEFP": "21", "COUNTYFP": "007", "COUNTYNS": "00516850", "AFFGEOID": "0500000US21007", "GEOID": "21007", "NAME": "Ballard", "LSAD": "06", "ALAND": 639387454, "AWATER": 69473325, "STATE_NAME": "Kentucky"}, "geometry": {"type": "Polygon", "coordinates": [...]}}
To tile your own geometry for real-time data joining, do the following:
Use the Tilesets API to upload newline-delimited GeoJSON and publish a tileset.
Define a new map style in Mapbox Studio and add the tileset as a source for a layer. Style it as desired for visibility and size across relevant zoom levels. The default appearance should be appropriate for a "no data available" state.
Pass your style URL as a prop to the RealtimeMap to test out your data. If it uses 2018 FIPS codes for the data join, it should work with the existing application.
To use a custom front-end, make sure you are loading a style with relevant source ids. Then configure the visuals and state updates based on your applications needs. The core tasks are adding a paint property that is controlled by feature state, subscribing to updates or polling for data about relevant features, and setting feature state on the map as real-time updates arrive.
For deployment, you will need access to a live data provider.
Map styles created with the Tilesets API and Mapbox Studio are production ready.
- Mapbox Studio
- Data previsualization
- Map styling
- Tilesets API
- Data upload
- Data filtering
- Data tiling
- Mapbox GL JS
- Map rendering
- Runtime data-join
This project was created by the Mapbox Solutions Architecture team.
solutions_architecture@mapbox.com
The code for this project is licensed under the BSD 3-Clause License - see the LICENSE file for details.
For data licensing, see the README in the data/ folder.
Ivan Ramiscal and Chris Toomey for help clarifying and diagramming structure of solution.
Link back to mapbox.com/solutions landing page.
