When I wanted to become a backend developer my gorgeous husband made some practical interview with me then created a repository and put the questions and answers there. Now I want to apply for a data scientist position in which unfortunately he has no experience, so I'm making this repository and want to put all my practices here.
-
you have buckets one 5 liters the other 3 liters, measure 4 liters:
First I make the 3 liters bucket full and then pour it to 5 liters bucket then I make it full again and pour it to the 5 liters bucket till it gets full, so the amount of water left in the 3 liters bucket is 1 liter then I make the 5 liters bucket empty and pour that 1 liter in it then make the 3 liters bucket full again and pour it to the 5 liters bucket which had 1 liter inside, so the result is 4 liters of water in the 5 liters bucket.
- Differences between supervised and unsupervised: In supervised the data has label
- How is logistic regression done?
- Explain steps in decision tree
- How do you build a random forest?
- How can you avoid overfitting? Lasso regression
- What are feature selection methods? Wrapper methods: forward selection, backward selection. Filter methods: Chi-Square, ANOVA (learn f-distribution, t-test, p-value, null hypothesis and significance level)
- How do you deal with more than 30% missing value?
- Explain dimensionality reduction and its benefits
- How will you calculate eigenvalues and eigenvectors of a 3 by 3 matrix
- How to maintain deployed model?
- What are recommender systems? Collaborative, content-based
- It rains on Saturday with 0.6 probability and rains on Sunday with 0.2 probability what is the probability that it rains this weekend?
- How can you select k for k-means?
- What is the significance of p-value?
- How can outlier values be treated?
- How can you say that a time series data is stationary?
- How can you calculate accuracy using confusion matrix?
- Write the equation and calculate precision and recall rate
- If a drawer contains 12 red socks, 16 blue socks, and 20 white socks, how many must you pull out to be sure of having a matching pair?
- People who bought this, also bought... recommendations seen on Amazon is a result of which algorithm?
- Write a SQL query to list orders with customer information?
- You are given a dataset on cancer detection. You've built a classification model and achieved an accuracy of 96%. Why shouldn't you be happy with your model performance? What can you do about it?
- Which of the following ML algorithms can be used for imputing missing values of both categorical and continuous variables? K-means-clustering → crash, linear regression → crash, Decision tree → crash, KNN works
- calculate entropy [0,0,0,1,1,1,1,1]
- What is the standard of the mean?
- What is Mean Reciprocal Rank?
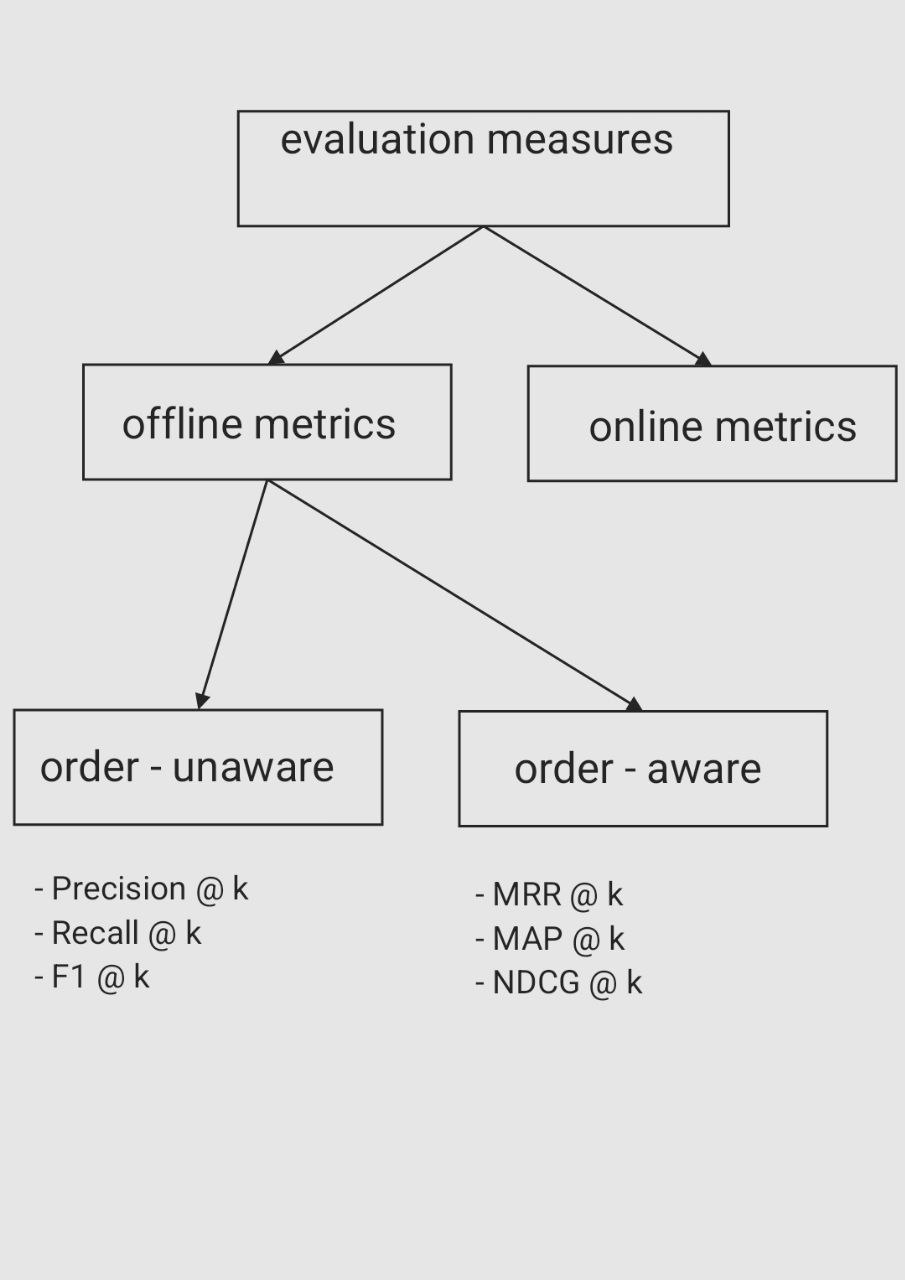
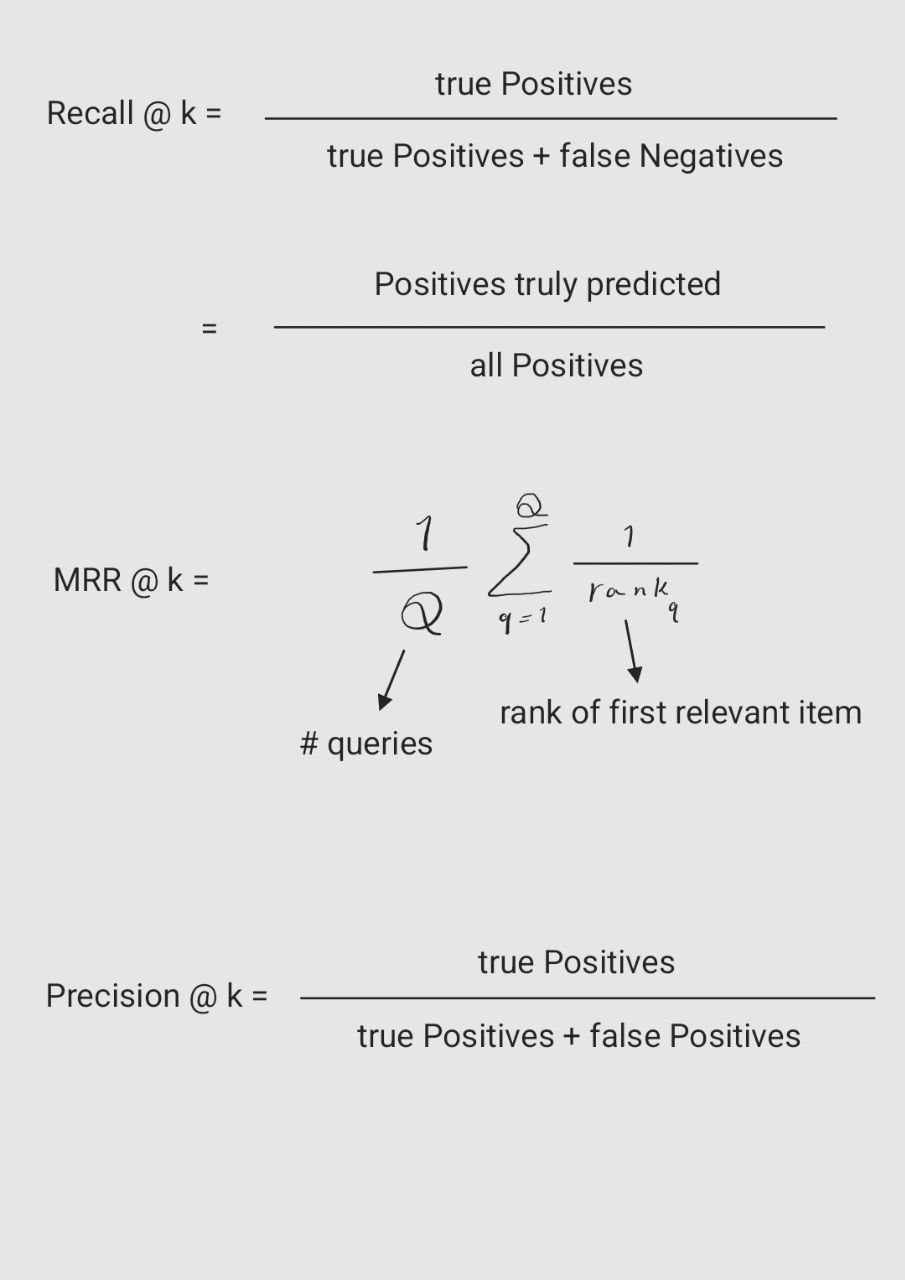
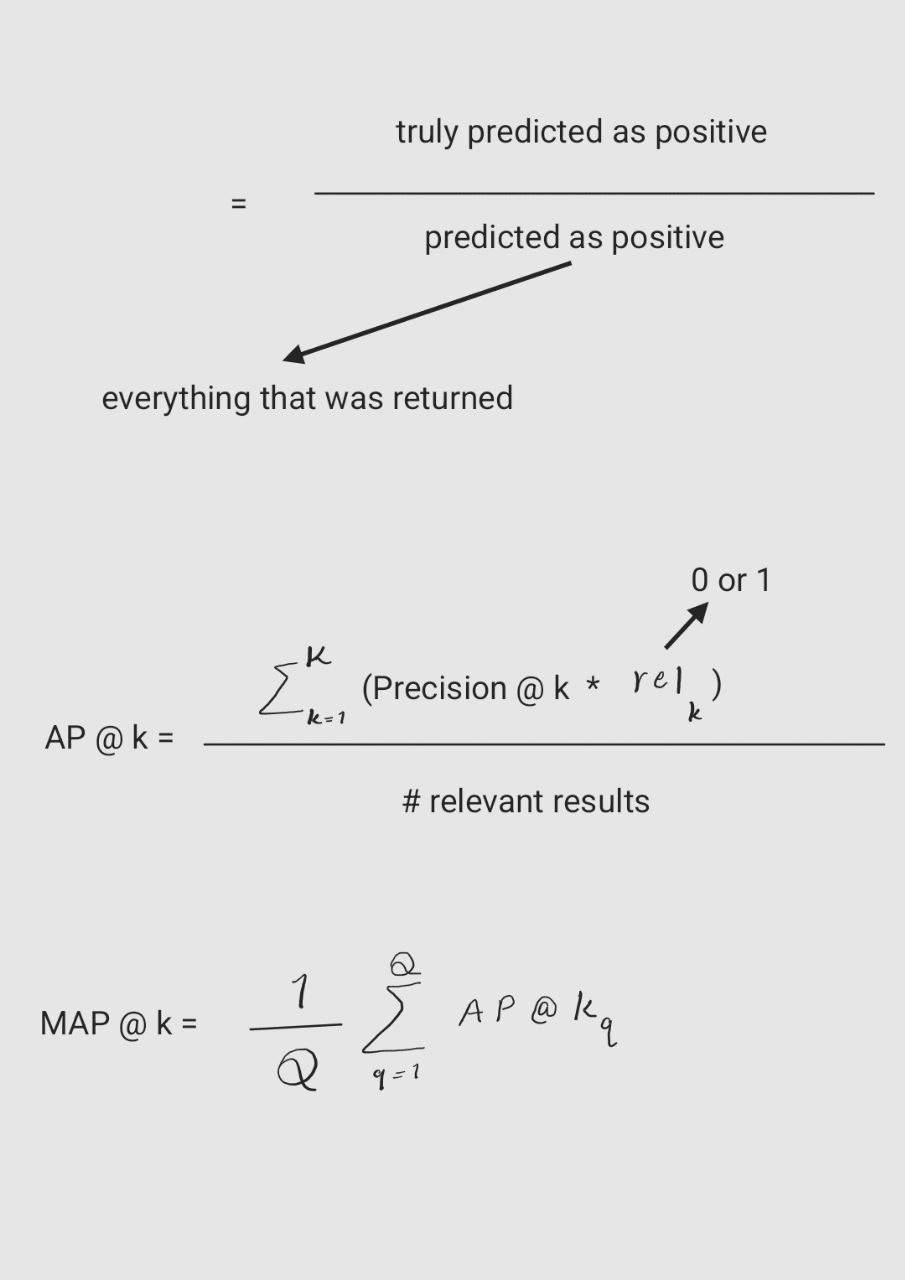
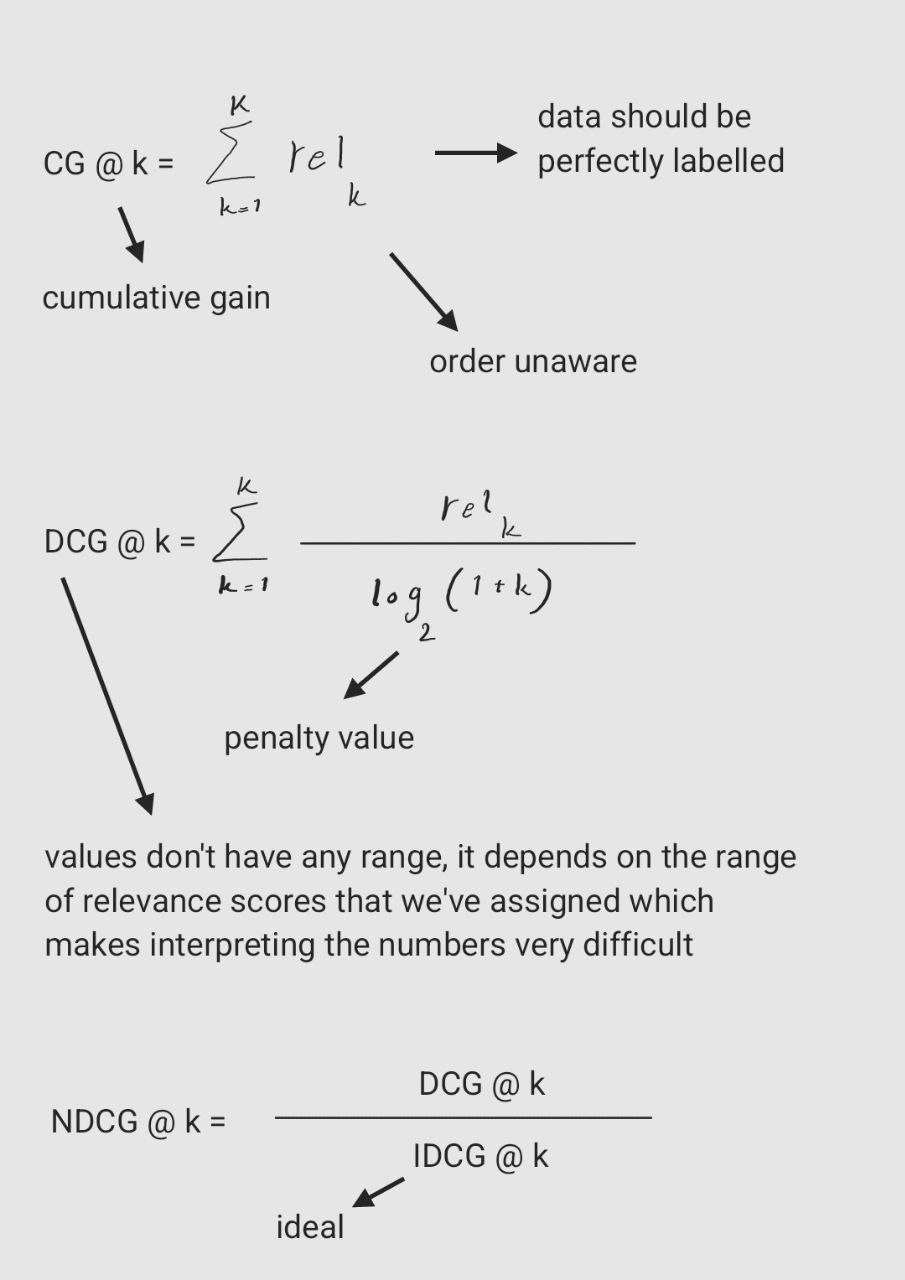
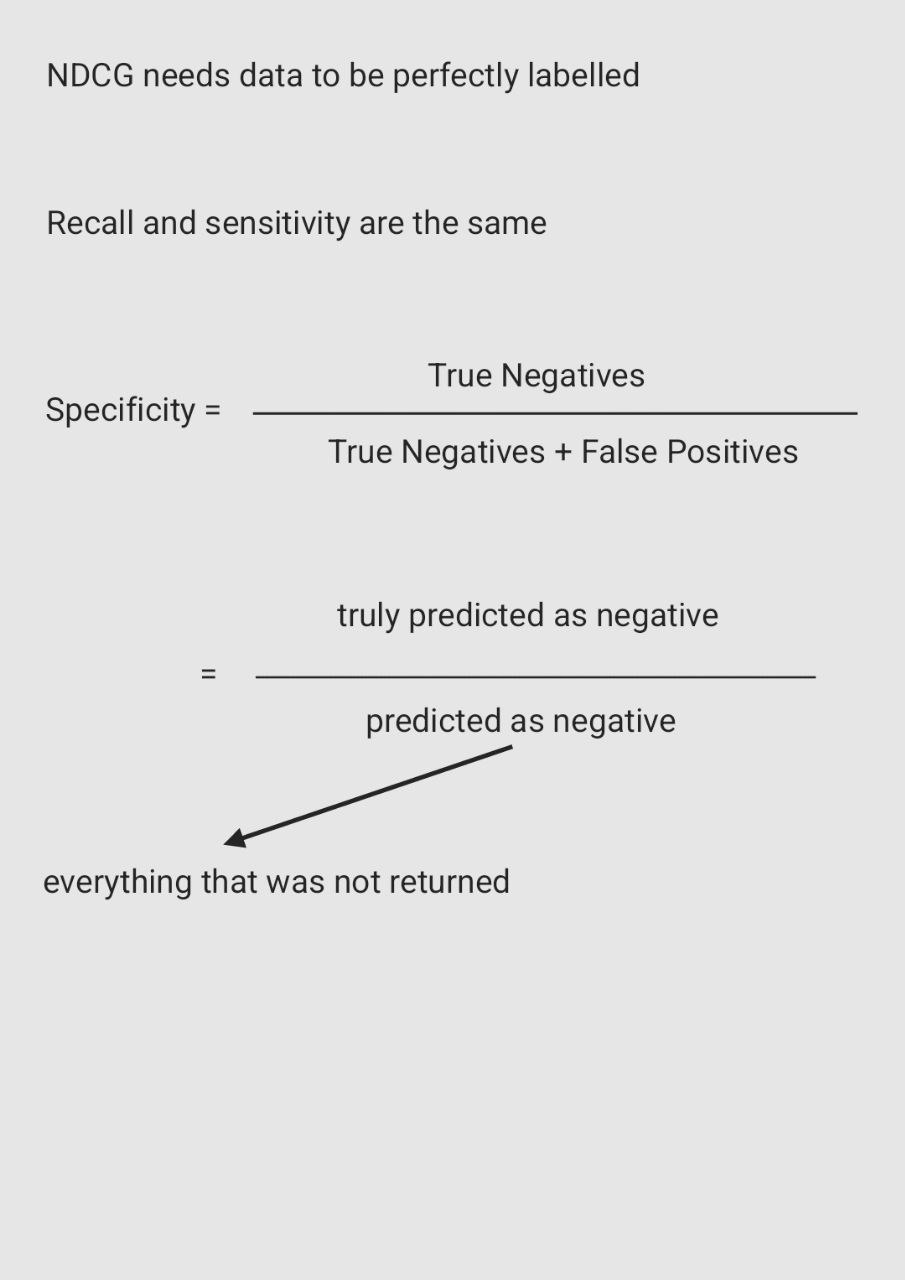

27.What is the difference between RMSE and MSE? While MSE gives a measure of the average squared error, RMSE provides a measure of the average error in the same units as the original data, making it more interpretable in practical terms.
28.What is AIC (Akaike Information Criterion)? The AIC balances the trade-off between the goodness of fit and the complexity of the model.
AIC=2k−2ln(L)
where:
k is the number of parameters in the model.
L is the maximum likelihood of the model.
AIC does not provide an absolute measure of a model's quality but rather a relative measure to compare multiple models.
- What is zero-shot learning? In computer vision, zero-shot learning models learned parameters for seen classes along with their class representations and rely on representational similarity among class labels so that, during inference, instances can be classified into new classes.
- What is knowledge distillation? In machine learning, knowledge distillation or model distillation is the process of transferring knowledge from a large model to a smaller one. While large models (such as very deep neural networks or ensembles of many models) have higher knowledge capacity than small models, this capacity might not be fully utilized.
- What are transfomers? have you worked with them? transformers architecture was introduced in the paper ” Attention is All You Need”. Transformer Architecture is a model that uses self-attention that transforms one whole sentence into a single sentence. This is a big shift from how older models work step by step, and it helps overcome the challenges seen in models like RNNs and LSTMs. RNN suffers from the vanishing gradient problem which causes long-term memory loss. RNN does the processing of text sequentially, which means if there is a long sentence it can't remember whole of it. With the addition of a few more memory cells and resolving the vanishing gradients issue, the problem regarding long-term memory loss was resolved to some extent. However, the problem with sequential processing remained because RNN was unable to process the intact sentence at once. This issue can’t be addressed in LSTMs due to their sequential design. In LSTMs, we use the static embedding method, which suggests that without knowing the context of a word we embed it to some n-dimensional vector. But if the context changes, the meaning also changes. Transformer architecture consists of: . positional encoding . Position-wise Feedforward Networks . Attention Mechanism and Encoder-Decoder Architecture. The attention mechanism in transformers employs a scaled dot-product approach, where the computation involves scaled dot products between the query, key, and value vectors. This produces weighted values that are then summed to yield the attention output. To enhance the model’s capacity to capture diverse relationships within the input, the multi-head attention mechanism is introduced. This involves applying the attention mechanism multiple times concurrently, each with distinct learned linear projections of the input. The resulting outputs from these parallel computations are concatenated and undergo a linear transformation to generate the final attention result.
I had to answer to a few questions in the first phase of interview for the data scientist position at Cafebazaar, and I
was rejected because the questions needed deep understanding of linear algebra which I had forgotten, I can't remember
what they exactly asked for, but I can give you a sense and another important point is that I now write the answer I
think is true, but I'm not sure so don't rely on my answers:
-
We generated 5 random numbers using uniform distribution from [0, d] and the numbers are 5, 11, 13, 17, 23 find the minimum d with more than 95% probability.
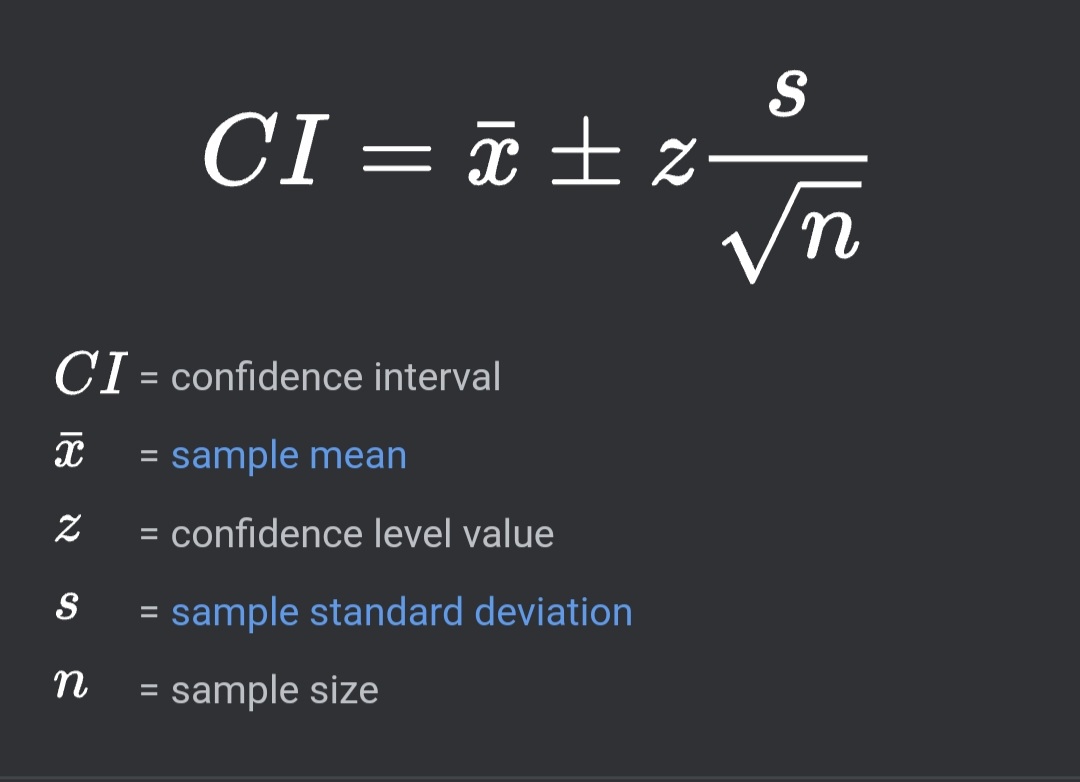 So we can write
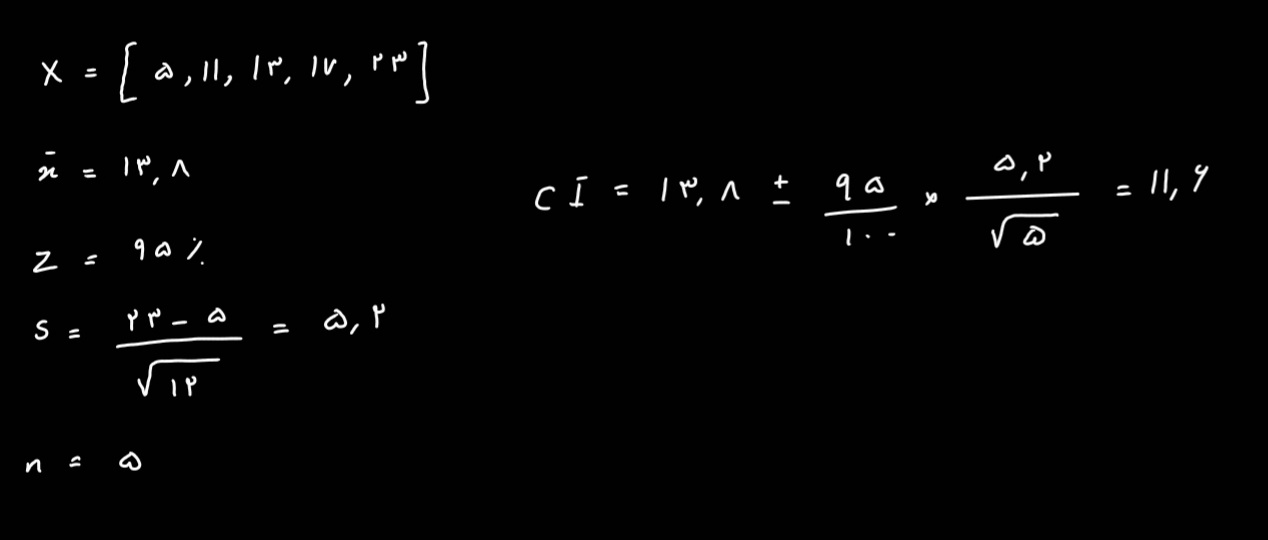
-
Given uniform distributions X and Y and the mean 0 and standard deviation 1 for both, what’s the probability of 2X > Y?
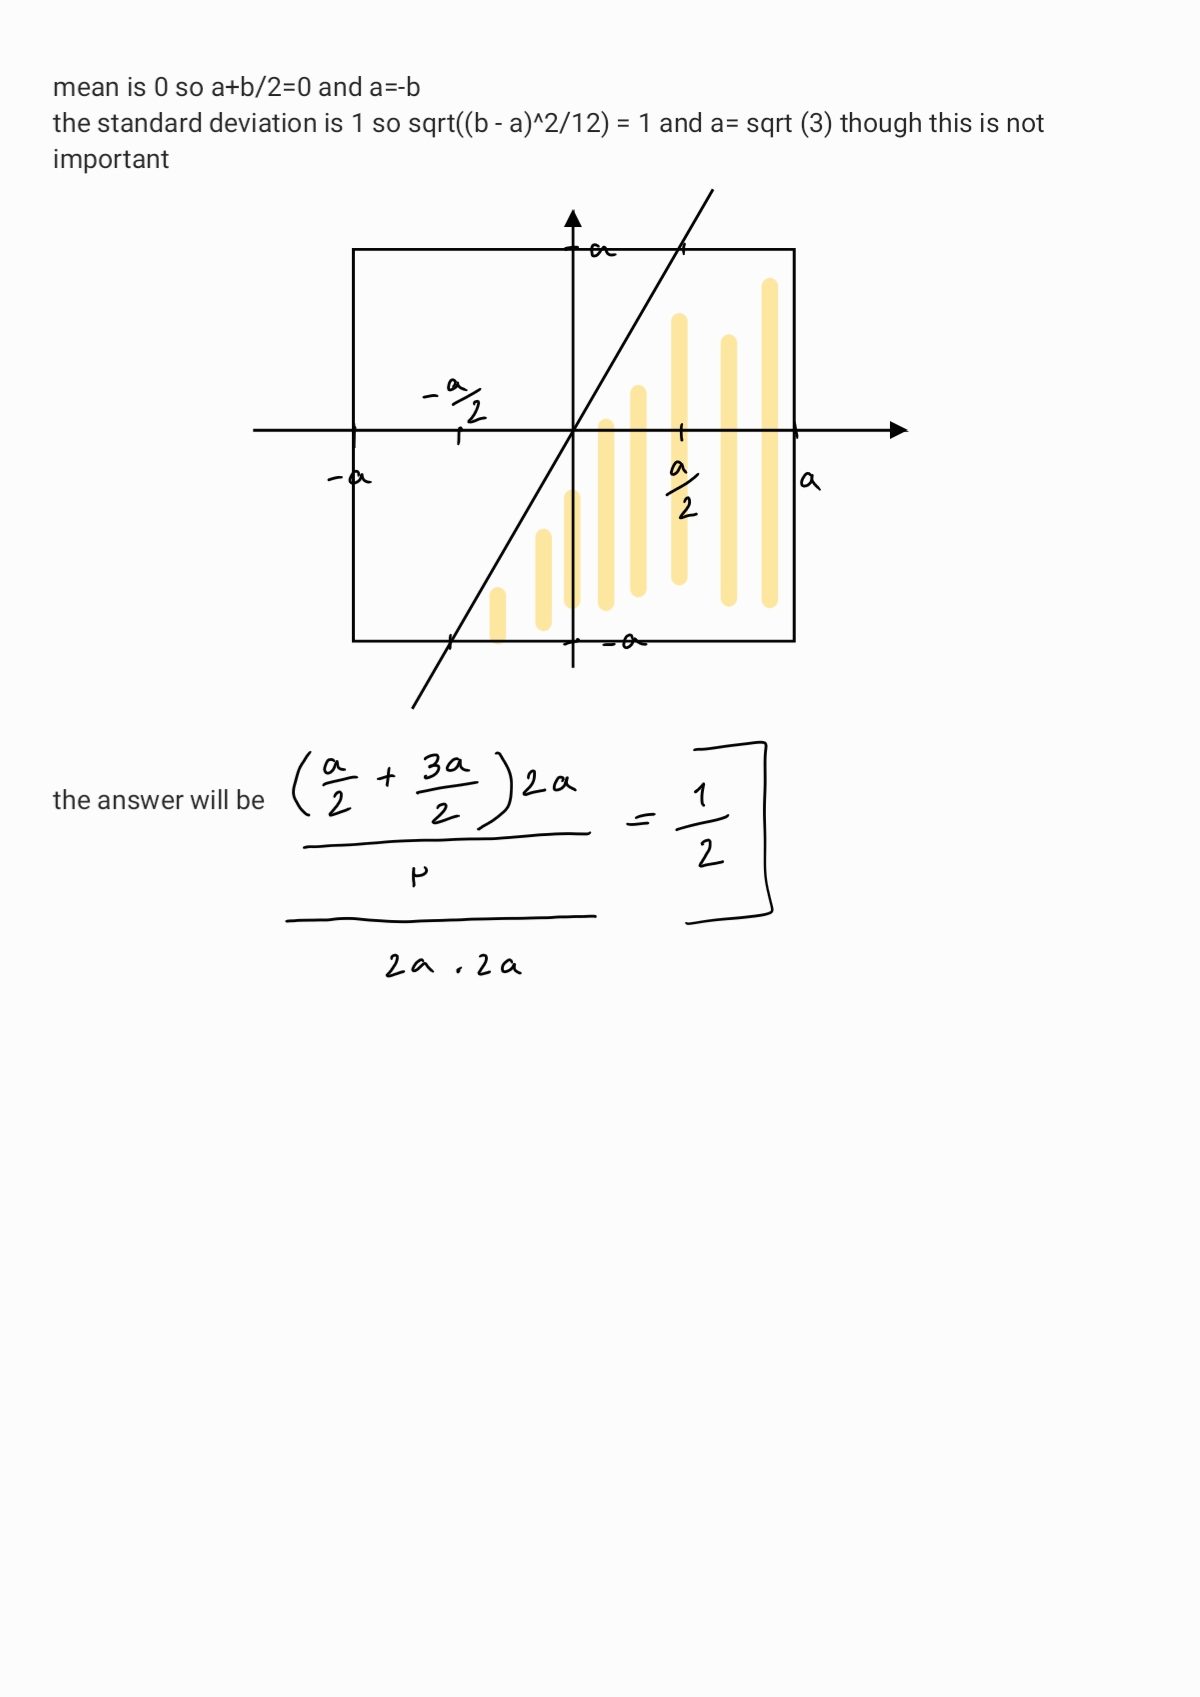 As you see this question is super easy, but I couldn't answer 😂 because I
didn't expect these kinds of questions so shout out to you, they ask something like this expect it.
 -
What can you say about the rank of the matrix when the number of samples is many more than the number of features? Pay attention the first phase is a test, so there is no one who you can talk to or there is no box in which you can explain what you know if I had the chance I could say that in order to find out a linear regression model I know gradient descent and normal equation and in normal equation we should calculate the inverse of X multiplied by X transpose and this term is not invertible if the number of samples in many more than features or if features have high correlation with each other, but I just could check one answer about the rank I mean they ask for pure linear algebra. Well, I couldn't even remember what the rank of a matrix was. The rank of a matrix is the number of linearly independent columns (or rows), you can find the rank of a matrix using echelon. To be honest I don't have an intuition, but there is a theorem which says the column rank is equal to the row rank, so the first thing we can say is that the rank of this matrix at most will be the min(number of rows, number of columns). In this question the rank will be at most the number of samples.
Full rank means the rank of the matrix is the largest possible number so if your features have high correlation with each other (and the number of features are less than the number of samples) your matrix won't be full rank.
This part is not a question asked in any of the interviews, but I had to write it here cause it made me think of my whole
life decisions. This is the story happened to me which may happen to you too. Once I had to solve a coding challenge, it
was an imbalanced dataset, and I had to train a classifier. As you can guess precision is not a good metric in this
problem, cause even always predicting false gives you a high prediction. Then I found out that recall is as important as
precision, and the first thing popped to my mind was F1-score but then in my searches I heard about another metric called
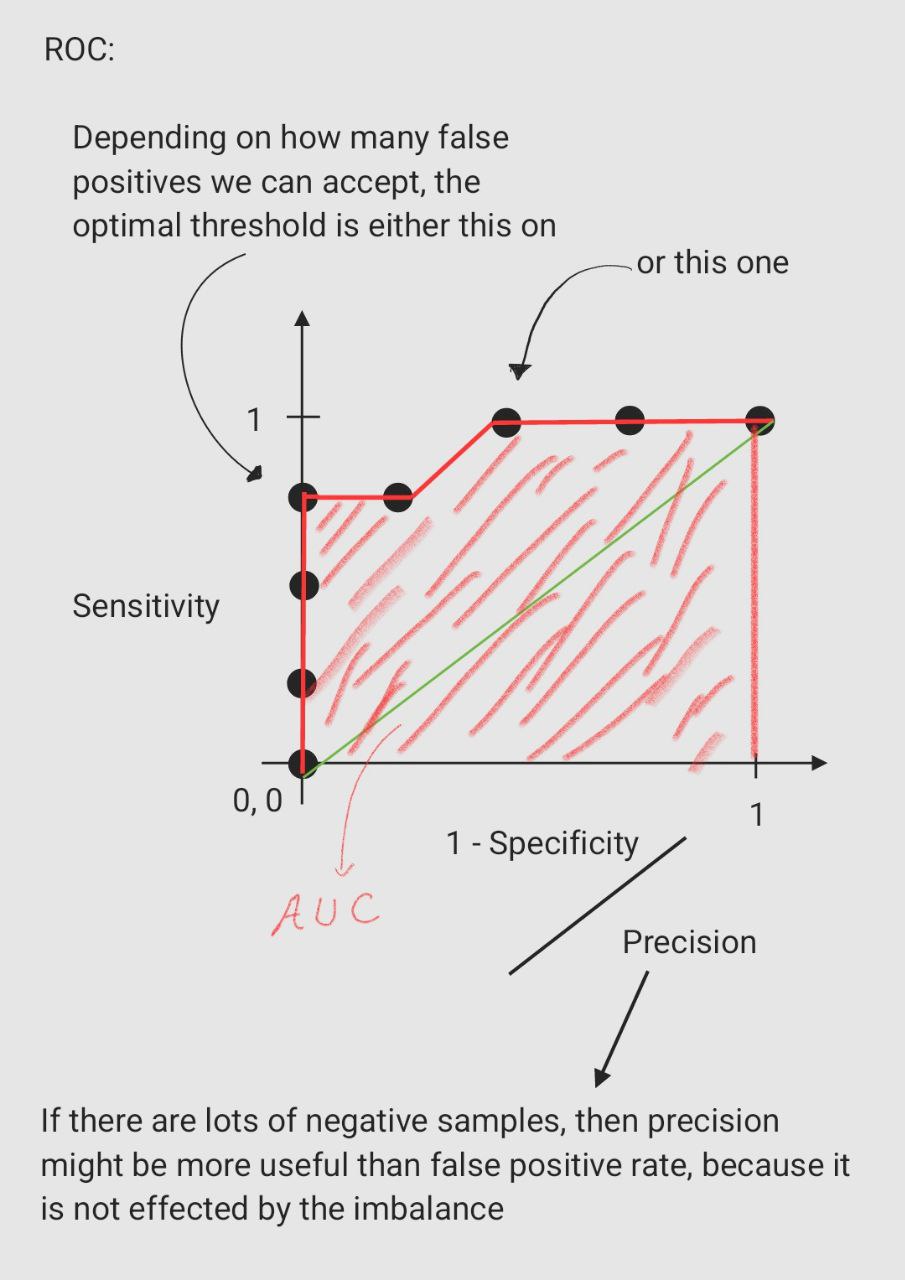
ROC_AUC which was claimed to work well for an imbalanced dataset. That's wrong, in ROC_AUC we are calculating the area
under the receiver operating characteristic curve. In this curve the y-axis is the sensitivity or true positive rate:
True Positive Rate = True Positives / (True Positives + False Negatives)
It measures the proportion of the positive data that we classify correctly. The x-axis is the false positive rate:
False Positive Rate = False Positives / (False Positives + True Negatives)
it measures the proportion of the negative data that we classify as positive, so if your dataset is highly imbalanced, and
most of the data is labeled negative then the number of True Negative samples can affect the whole curve, if the model
classifies all samples as negative then the number of True Negative will be so large and False Positive Rate will be so
small, and it assumes the model is so good so this metric is not good at all for imbalanced dataset classification. To
solve it, we should use precision instead of false positive rate:
Precision = True Positives / (True Positives + False Positives)
it measures the proportion of the data the model classifies as positive is really positive, and the areas under this curve
can be used as a good metric.
These optimizations were not asked in interview, but it's highly important to fully understand them:
Stochastic Gradient Descent: In regular gradient descent we should bring whole the training dataset to our calculations
which will be so much if our dataset is so large and our model has so many parameters. In this situation we can use
SGD, this algorithm stochastically chooses a mini batch of the dataset in each step and does the calculation.
Momentum: I always think about this optimization with a physics intuition. The problem is that we want to make gradient
descent faster and avoid oscillation. We change the calculations this way:
"V" of derivative of "W" (parameters of the model) is equal to "B" (hyper parameter) multiplied by "V" of
derivative of "W" plus derivative of "W".
Then "W" in each step is updated this way:
"W" will be equal to "W" minus learning rate multiplied by "V" of derivative of "W"
In here I see "V" as velocity and derivative of "W" as acceleration. As the equations show if faster move in one
dimension is needed then the acceleration makes velocity bigger and bigger each step, and the parameters of the model will
be updated faster and faster and if one dimension oscillate in regular gradient descent in this algorithm acceleration
will be positive one step and negative the other step and doesn't let velocity to get big so parameters will not change
a lot.
Adam: I had an intuition for SGD that we use a mini-batch instead of the whole dataset cause our dataset is so large or the model has so many parameters, and I even had a physics intuition for Momentum optimization that to avoid oscillating and make the algorithm faster we use what I called "velocity" and "acceleration" to move faster in a dimension needed and avoid oscillating by changing the parameters by "V" of derivative of "W" but to be honest I have no intuition for ADAM optimization, I've seen the algorithm and this is something I can't understand but is working
I can guarantee they will ask you this question. It has some simple answers but make sure you review them before the
interview:
- Drop the Nulls.
- Replace them with mean or median
- Use the mean or median but not of the whole column, only of a few samples that are close to it.
- Pick an algorithm or change them, so they don't crash because of Null, they just don't put the Null into calculation.
- Predict the Nulls. You can choose the column which has Nulls as your target column and then the known values can be used for training, then we can predict the unknown values by a simple regression.
- Mice (Multivariate Imputation By Chained Equations)algorithm: If you've gotten the idea of predicting the Null values
by regression (part 3 of Medium) this algorithm will be super easy. Most probably more than just one column in your
dataset contains Null values:
- Replace the Null values by the mean of their column.
- Go through the columns and for each of them predict the Null values by regression (And other columns don't contain Nulls).
- Calculate the difference between the new matrix and the previous one.
- If the matrix is not close to zero then do the step two and three again.
- Matrix Factorization: I'll go through an example, suppose you wanna build a recommender system for Netflix when a
person creates an account you ask them to score how much they like specific categories and knowing this can help you
a lot, but most of the people just skip the part now you have a matrix R of size nm where n is the number of users and
m is the number of categories and it contains so many Nulls. Consider a positive integer k <= min(n,m), the main
objective is to find matrix factors W with size nk and H is size k*m in which R is close to WH. As these matrices are
completed, the predicted rating of user u to item i (r at index u and i) can be estimated by the inner product of the
corresponding user-item feature vector pairs.
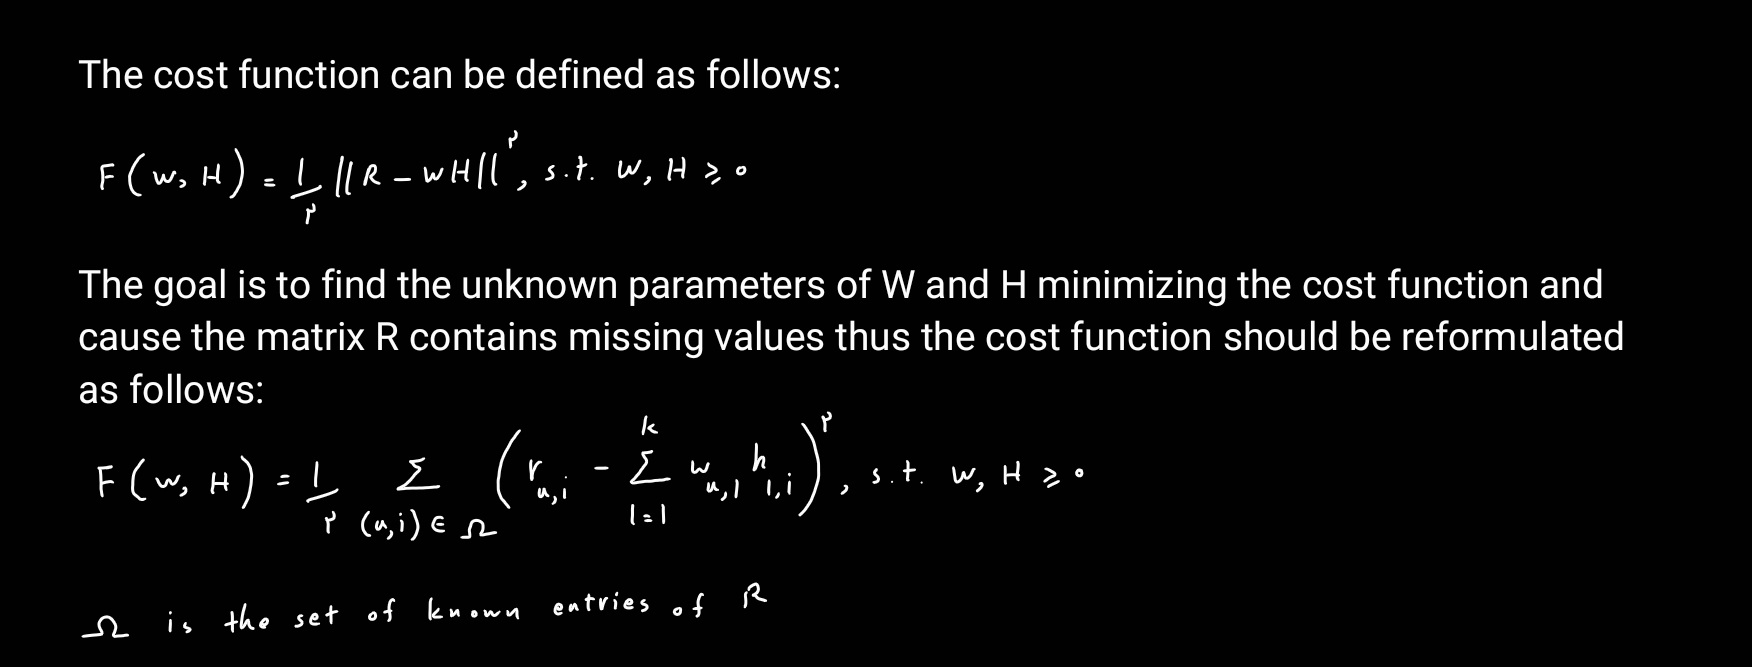 Estimating the parameters of W and H can be achieved by searching around the global (or local) minimum of the quadratic
cost function F and once it's done, the other missing values can be estimated by the inner product too.
This is another most repeated questions, how will you transform categorical columns to numerical columns?
- Ordinal encoder and Label encoder
- One hot encoder and Dummy encoder
- Hashing: By hashing we can transform the categories into a fixed size number
- Base N encoding: We can first use ordinal encoding and then transform the numbers by base N, look at the example below:
| Categorical Column |
|---|
| A |
| B |
| C |
| D |
| E |
| F |
| G |
| H |
| I |
ordinal encoding
| Categorical Column |
|---|
| 1 |
| 2 |
| 3 |
| 4 |
| 5 |
| 6 |
| 7 |
| 8 |
| 9 |
base 4
| Categorical | Column |
|---|---|
| 0 | 1 |
| 0 | 2 |
| 0 | 3 |
| 1 | 0 |
| 1 | 1 |
| 1 | 2 |
| 1 | 3 |
| 2 | 0 |
Let’s explore a simple 24-hour time dataset, we want to convey its cyclical nature to our model.
| Seconds Past Midnight |
|---|
| 192 |
| 212 |
| 299 |
| 300 |
| 353 |
| 400 |
we want our machine learning model to see that 23:55 and 00:05 are 10 minutes apart, but as it stands, those times will
appear to be 23 hours and 50 minutes apart!
Here's the trick: we will create two new features, deriving a sine transform and cosine transform of the seconds-past-midnight feature. We can forget the raw “seconds” column from now on.
seconds_in_day = 24*60*60

df['sin_time'] = np.sin(2*np.pi*df.seconds/seconds_in_day)
df['cos_time'] = np.cos(2*np.pi*df.seconds/seconds_in_day)

df.drop('seconds', axis=1, inplace=True)

df.head()
Notice that now, 5 minutes before midnight and 5 minutes after is 10 minutes apart
My interview experience with digikala was much more reasonable than cafebazaar. I was asked any kind of question from
easy to hard. I had to code, know sql, know ml models, know statistics, and the nice thing was that in
each of them the understanding was much more important than answering completely and all the questions were example based
again I can't remember every detail but here's what I remember:
-
bias/variance tradeoff. not only the meaning, but I had to explain it in different situations for example: When you are using a random forest instead of a decision tree, what are you doing about bias/variance? I'm reducing variance.
-
explain bagging and boosting and how each of them affect bias/variance: In bagging we train a few models of the same type with different datasets and then use voting among them. In boosting we train a model with whole dataset, and we increase the weight of the samples which are wrongly predicted and then train the second model by this dataset and so on. They both decrease the variance.
-
I tell you to measure the height of the people in your college, what is distribution? Normal. Now I tell you to measure the height of girls and boys in your college separately, what is the distribution? More normal. Now I tell you to measure their salary, what is the distribution? Normal. What is the difference between these two distribution? the salary distribution has a heavier tail than the height distribution.
-
Do you know what q-q plot is? This question was great although I couldn't answer. Here it is, what it tries to understand is whether a dataset is normally distributed or uniformly distributed or ... or if two datasets' distribution is the same. Assume you have a dataset with fifteen samples, and you wonder if this dataset is normally distributed,
Step1 : Give each point its own quantile
Step2 : Get yourself a normal curve(any normal curve will do)
Step3 : Add the same number of quantiles to the curve as you created for the data(here 15)(For the normal curve, " equal sized groups" means that there is an equal probability of observing a value within each group this means that groups on the edge must be wider and groups in the middle are narrower)
Step4 : Now plot q-q graph : The plot contains dots showing where the quantiles from our dataset intersected with the quantiles from the distribution. Step5 : If the data were distributed like the distribution we selected, most of the points would be on a straight line.
You can also use q-q plot to see if two datasets follow the same distribution: assume we have a dataset with 15 samples and another one with just four samples, we determine four quartiles for the larger dataset and compare those
-
The next question was if I had ever worked with spark? Let's do it
Check here
I had to do a code challenge for digikala too which is in a separate repository, check here
The hypothesis that there is no difference between things is called the null hypothesis. The null hypothesis does not require any preliminary data because the only value that represents no difference is 0. The closer a p-value is to 0, the more confidence we have that things A and B are different. While a small p-value helps us decide if thing A is different from thing B, it does not tell us how different they are. A p-value is composed of three parts:
- The probability random chance would result in the observation.
- The probability of observing something else that is equally rare.
- The probability of observing something rarer or more extreme.
They had a system to assign credit to farmers, they asked me to design a system to do so.
You are training a linear regression model on a representative sample in order to predict house prices. Performance tests suggest that the model has an issue of high estimator bias in combination with low estimator variance. What action below is likely to solve the high bias issue?
• A: Collect more labeled data.
• B: Add higher-order polynomial terms.
• C: Increase the weights on regularization terms.
• D: Use a subsample of the data.
My answer is B
You performed a linear fit on a dataset with two variables, x1 and x2. The p-value for x1 is 0.01 and that for x2 is 0.1. Which statement is false?
• A: p-value is the probability to find the observed or more extreme value for the test statistic given that the null hypothesis is false.
• B: p-value is the probability to find the observed or more extreme value for the test statistic given that the null hypothesis is true.
• C: Variable x2 could have no effect at all on the response variable.
• D: The fitting coefficient of variable x1 is generally considered statistically significant.
The answer is A
Which metric is not used for evaluating the performance of a regression model?
• A: F1-score
• B: AIC
• C: R-squared value
• D: RMSE
The answer is A
In the US, the number of new cases of cancer is 454.8 per 100,000 men and women per year (based on 2008-2012 cases, National Cancer Institute). You have built a model to support the detection of cancer cases. The model accuracy amounts to 99.55%, however it was unable to correctly detect a single case of cancer. Which of the following statements is true?
• A: False negative rate of the model is 0.45%.
• B: Error rate of the model is 0.05%.
• C: Recall of the model is 0.45%.
• D: Specificity of the model is 100%.
My answer is D
K-fold cross-validation means to split data into k subsets, and train models on k-1 subsets while leaving one set out for evaluation. In which of the following situations is cross validation generally unnecessary?
• A: Optimizing the depth of a decision tree for a random forest model.
• B: Reducing the dimensionality of data using PCA.
• C: Choosing the number of clusters for a k-means model.
• D: Determining weights for the regularization terms of ridge regression.
My answer is B and C
An online social media platform has asked you to develop a churn propensity model. You have built a boosted tree model with 500 trees and maximum depth of 50. The AUC value is 0.95 on training data, but only 0.5 on test data. To improve model performance on test data, which step would you recommend to try next?
• A: Reduce maximum tree depth.
• B: Increase number of trees.
• C: Reduce from 10-fold cross validation to 3-fold.
• D: Apply a logarithmic transformation to features that are not normally distributed.
The answer is A
write a code to find the nth element of the sequence 0, 1, 1, 2, 3, 5, 8, 13, 12, 7, 10, 8, 18, ....
check here
if you write the sequence, you see it reapeats itself.
System design of a payment fraud detection service.
Question: you buy stuff and after getting them you pay, what if you don't!!!
Answer:
Data:
- History of payment of the person
- Is it first delivery
- Price of delivery
Model:
Classification:
- logistic regression
- treebased -> interperetable
- NN with binary cross entropy loss function
Imbalanced dataset:
- weight
- ensumble -> boosting
Evaluation:
- Offline: Precision and Recall -> F1 score, AUC
- Online: Business metrics
A few business rules:
Block if the person hasn't paid his debt since 3 months ago ...
The most challenging part of this question is that you don't have a completely trustworthy groundtruth.
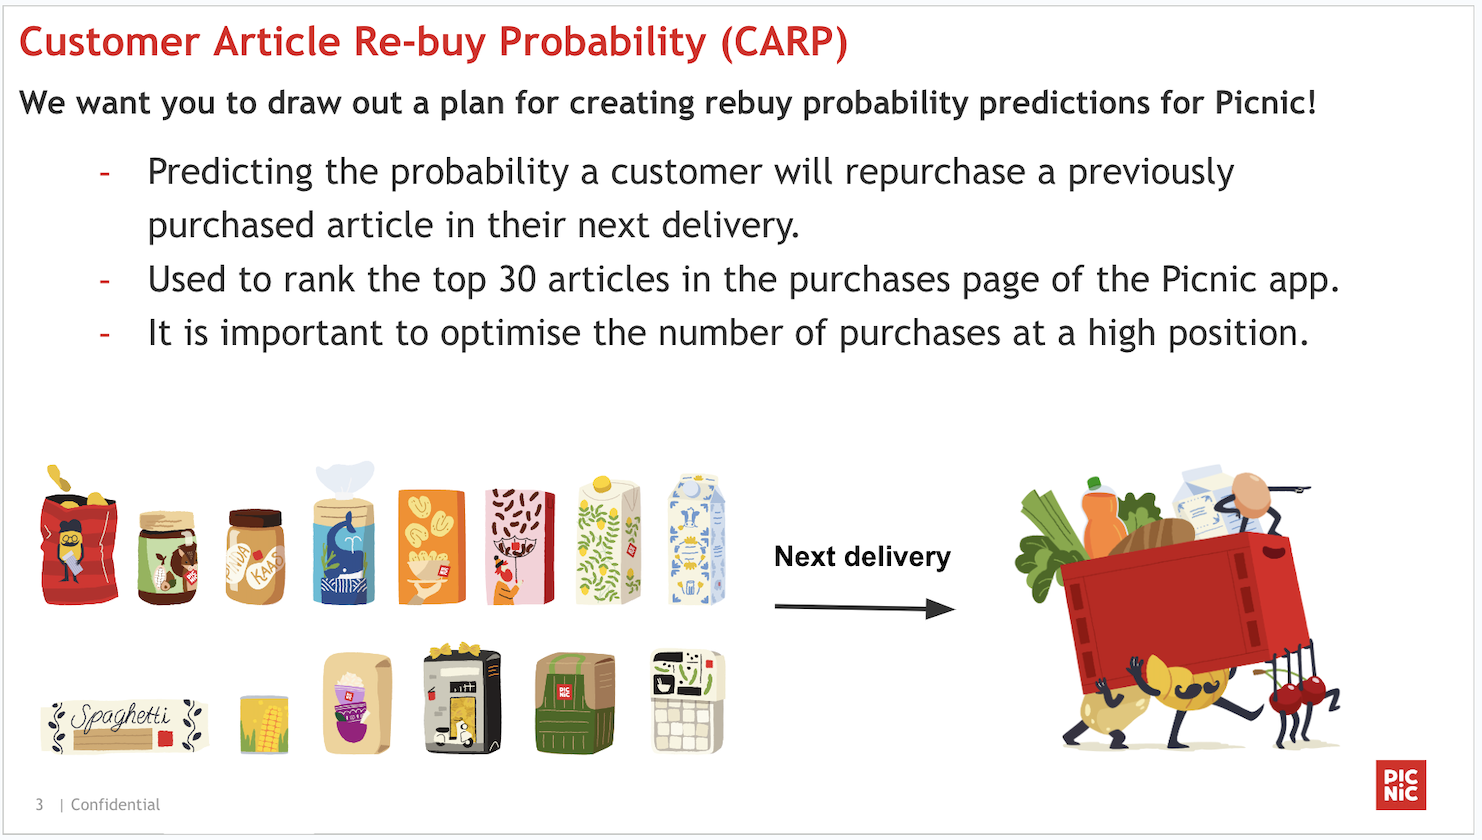
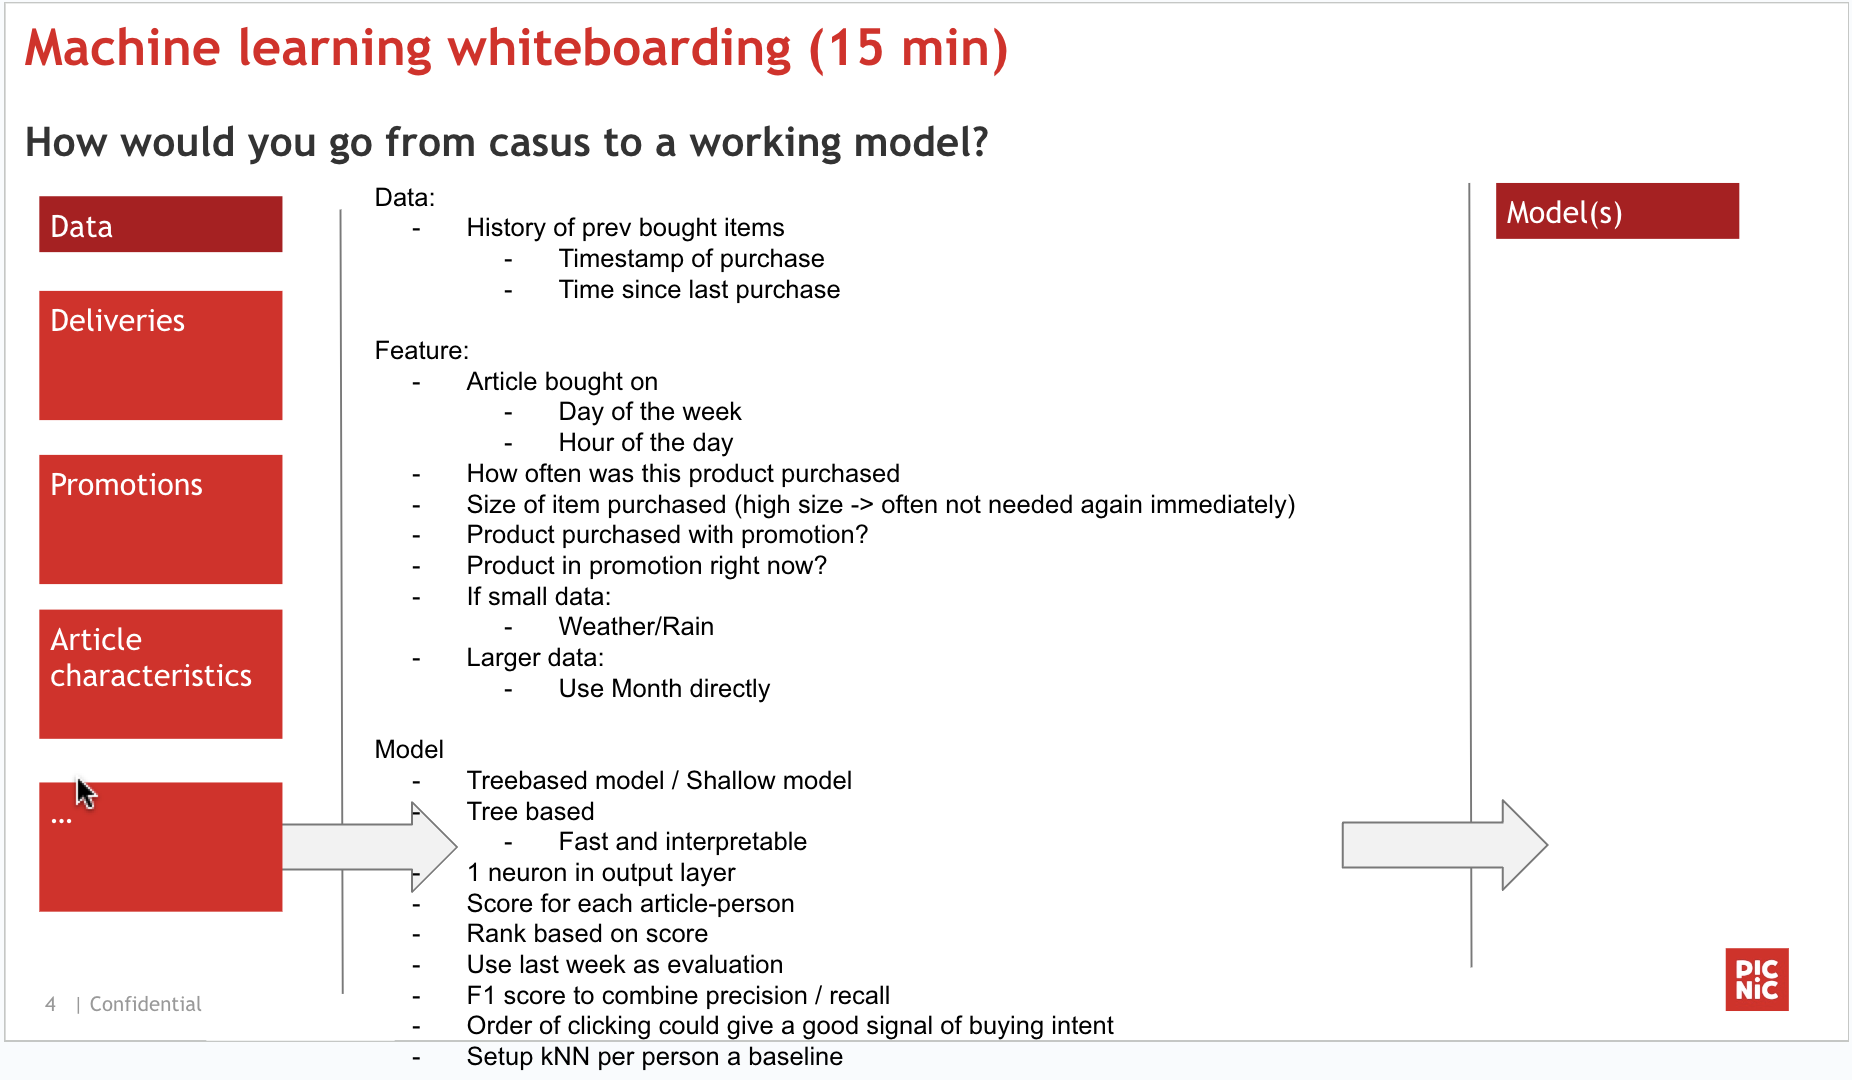
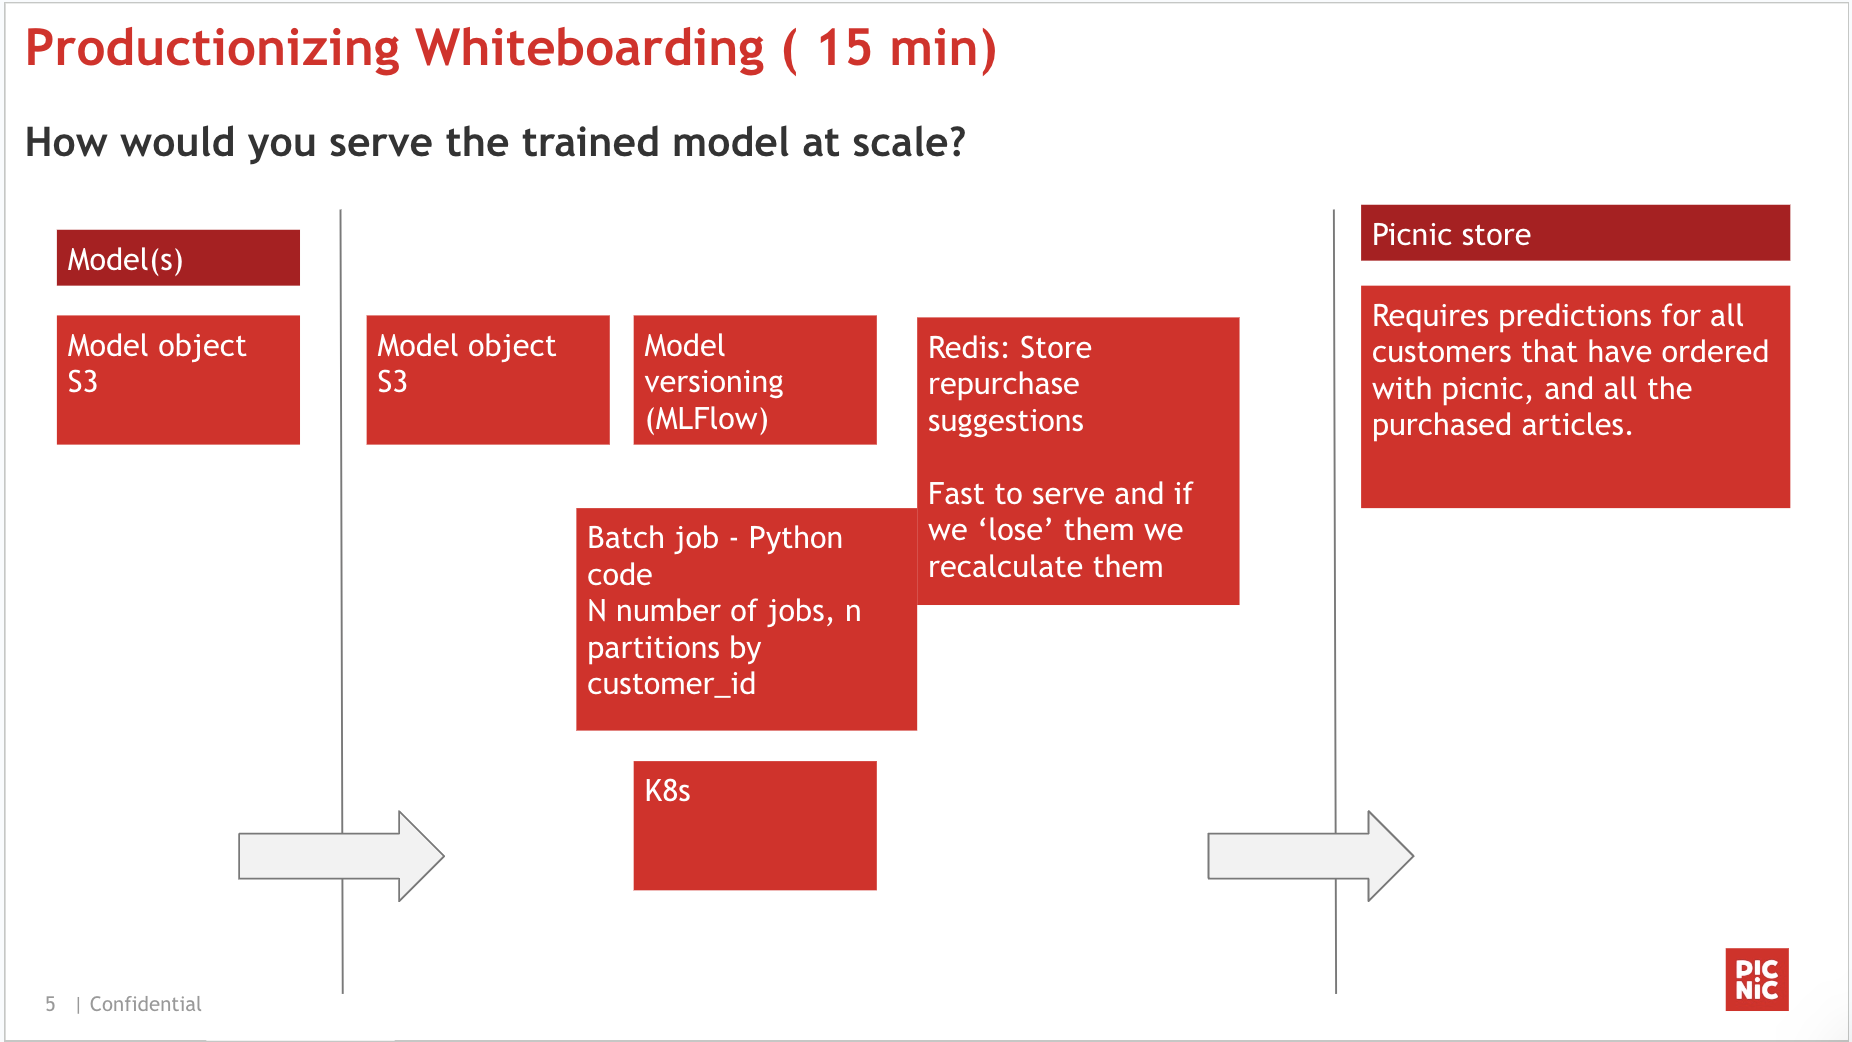
https://github.com/elahe-dastan/data-scientist-interview/blob/main/picnic/trip-forecast.py
Asking about the projects you've done in your career and try to ask you about the challenges you've solved, how you've solved them and why you didn't do another approach.
With VP, not an interview, just talking
First I had a technical interview with my agency company 0+x in which I answered a few ML question like:
What is central limit theorem?
What do you do if your model is overfitted?
Name a few loss function:
• Mean Squared Error (MSE)
• Cross-Entropy Loss: Often used in classification problems, especially with softmax activation in neural networks.
• Hinge Loss: Used primarily for support vector machines (SVMs) for classification.
• Log Loss: Also known as binary cross-entropy, used for binary classification problems.
• Mean Absolute Error (MAE)
• Huber Loss: Combines MSE and MAE to be less sensitive to outliers than MSE.
Name a few metrics:
• Precision
• Recall (Sensitivity)
• F1 Score
• Area Under the ROC Curve (AUC-ROC)
• MAP & Mean Absolute Percentage Error (MAPE)
• MSE & Root Mean Squared Error (RMSE)
• R2
• All ranking metrics like MRR and NDCG
What is Embedding and how is it trained?
Then I had two or three interviews with Apple itself I don't exactly remember what went on but these are what I have wroten:
• You mentined on your resume you use Bert to build a chatbot, how did you fine tune it on your dataset?
• They gave me a file containing some paragraphs and they asked me to return the TF-IDF metric value for each word in each paragraph. check here
• They gave me a file containing data of some monsthers, we had different features including categorical features and the lable defining the type of the monster and I was asked to write a code to classify these monsters. check here
Suppose you want to build "similar items" for digikala from scratch, how do you approach it?
First things first, we need to find features to help us find similar items, what do we have? I can think of the category or some features we force the customer to fill then comments and rating of the item and last but not least the text and the image of the item. I search for the similar item in the same category and I create a long vector containing the feature the customer fill (e.g. the size of the bottle or the color of it) then it comes to transforming the text and the image to vectors and concating them to the initial one. To embed text in word level we can use Word2Vec (CBOW and Skip-gram) and better to embed it in sentence level we can use transformers for example when Sentence-BERT was released. It outperformed all previous approaches to semantic textual similarity tasks and allowed the calculation of sentence embeddings. To embed images we can use convolutional NN models like ResNet.
If there is an item, is the same item with a different color its similar item?
People may have different opinions we have to either run a big analysis and see if most people consider this as similar item by either looking at previous actions of our users (or asking them) or let the model learn it we have an embedding for each item different features may have different importance we can give these embeddings to a neural network and get another embedding back this NN can learn to give higher weights to more important features we can train this NN by supervised approach by looking at our service and gather data of which items users chose as similar item.

