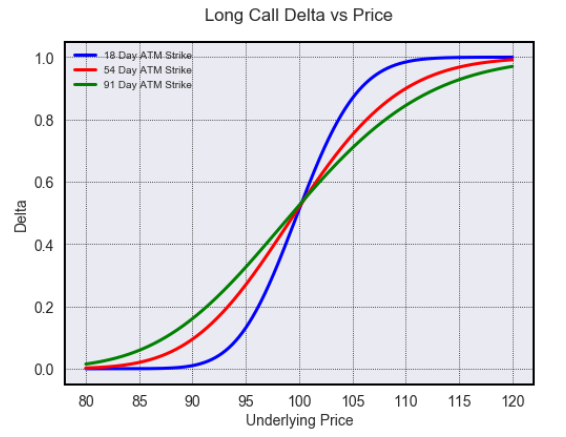
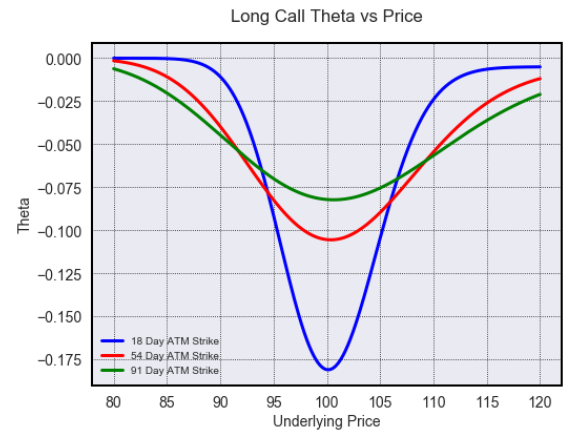
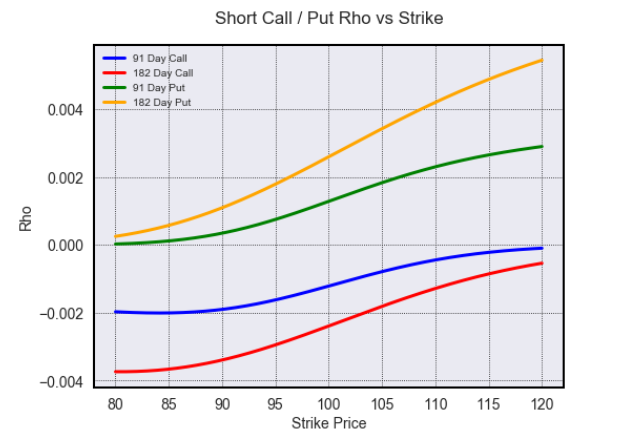
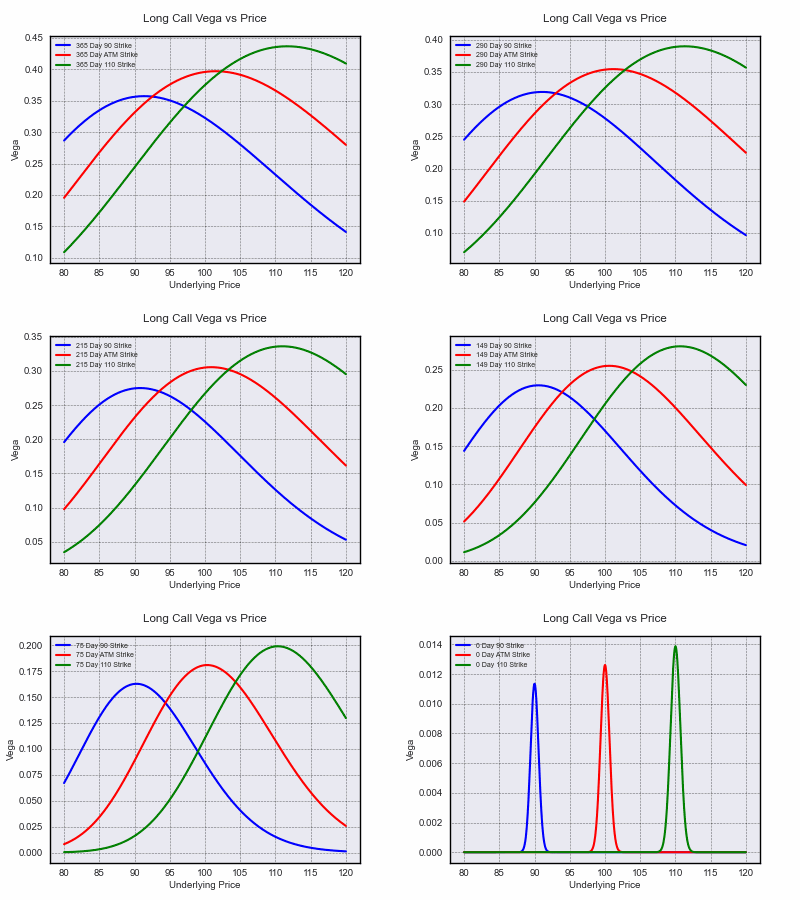
Each of the functions comes with default parameters and can be run without arguments for ease of illustration or they can be specified individually. Sensitivities can be calculated both analytically and numerically.
Install from PyPI:
$ pip install optionvisualizer
Or to install in new environment using anaconda:
$ conda create --name optvis
Activate new environment
$ activate optvis
Install Python
(optvis) $ conda install python==3.9
Install Spyder
(optvis) $ conda install spyder
Install package
(optvis) $ pip install optionvisualizer
Import visualizer and initialise an Option object
from optionvisualizer.visualizer import Visualizer
opt = Visualizer()
- Price: option price
- Delta: sensitivity of option price to changes in asset price
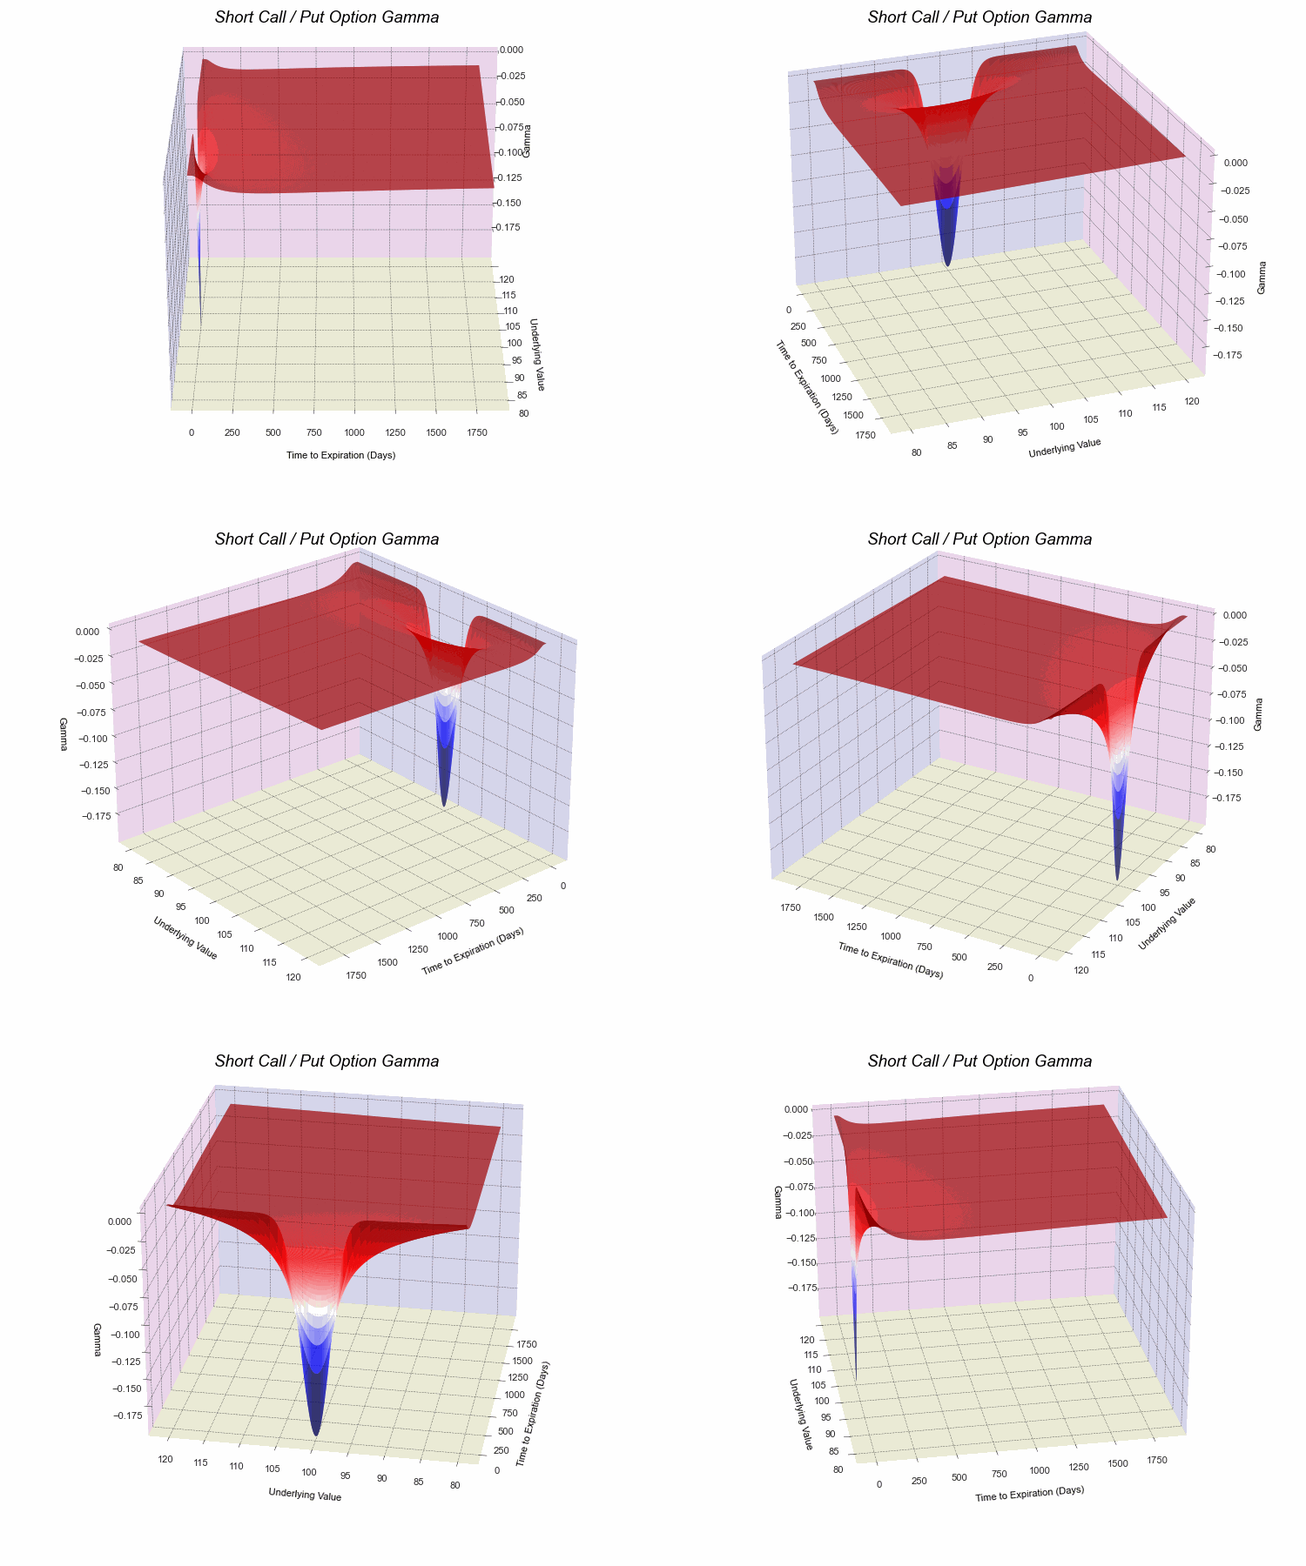
- Gamma: sensitivity of delta to changes in asset price
- Vega: sensitivity of option price to changes in volatility
- Theta: sensitivity of option price to changes in time to maturity
- Rho: sensitivity of option price to changes in the risk free rate
- Vomma: sensitivity of vega to changes in volatility; Volga
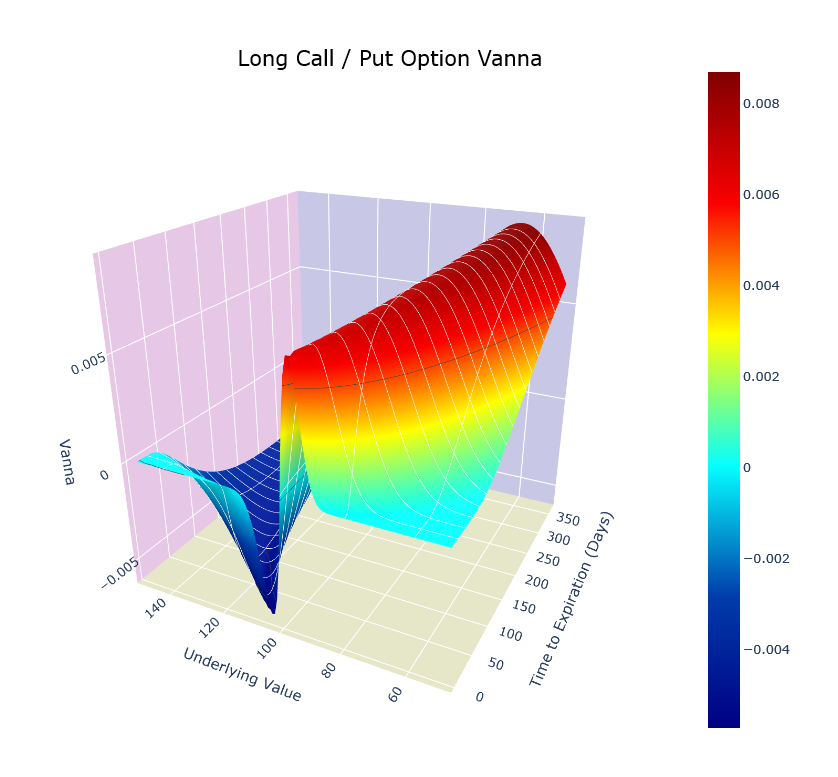
- Vanna: sensitivity of delta to changes in volatility / of vega to changes in asset price
- Charm: sensitivity of delta to changes in time to maturity aka Delta Bleed
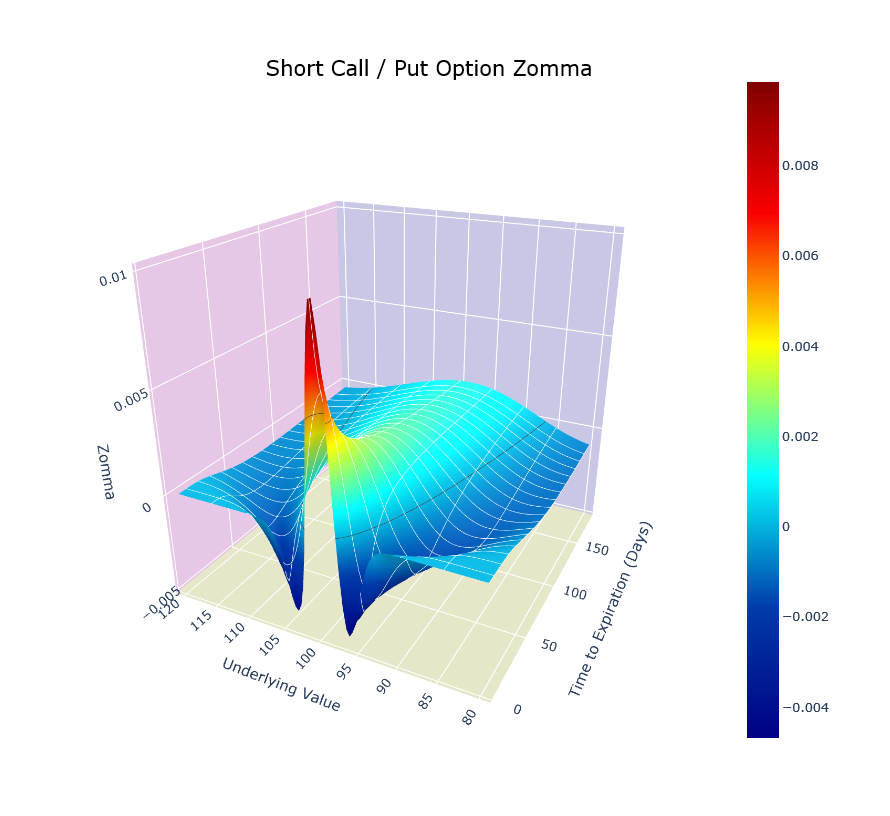
- Zomma: sensitivity of gamma to changes in volatility
- Speed: sensitivity of gamma to changes in asset price; 3rd derivative of option price wrt spot
- Color: sensitivity of gamma to changes in time to maturity; GammaTheta
- Ultima: sensitivity of vomma to changes in volatility; 3rd derivative of option price wrt volatility
- Vega Bleed: sensitivity of vega to changes in time to maturity
opt.option_data(option_value='price', S=3477, K=3400, T=0.5, r=0.005, q=0, sigma=0.3, option='put')
opt.sensitivities(greek='delta, S=3477, K=3400, T=0.5, r=0.005, q=0, sigma=0.3, option='put')
- option value
- delta
- gamma
- vega
- theta
opt.visualize(risk=True, x_plot='price', y_plot='delta', G1=100, G2=100, G3=100, T1=0.05, T2=0.15, T3=0.25)
opt.visualize(risk=True, x_plot='price', y_plot='theta', G1=100, G2=100, G3=100, T1=0.05, T2=0.15, T3=0.25)
opt.visualize(risk=True, x_plot='strike', y_plot='rho', direction='short')
opt.animated_gif(graphtype='2D', x_plot='price', y_plot='vega', direction='long', T=1, gif_folder='images/greeks_2d', gif_filename='price_vega_l')
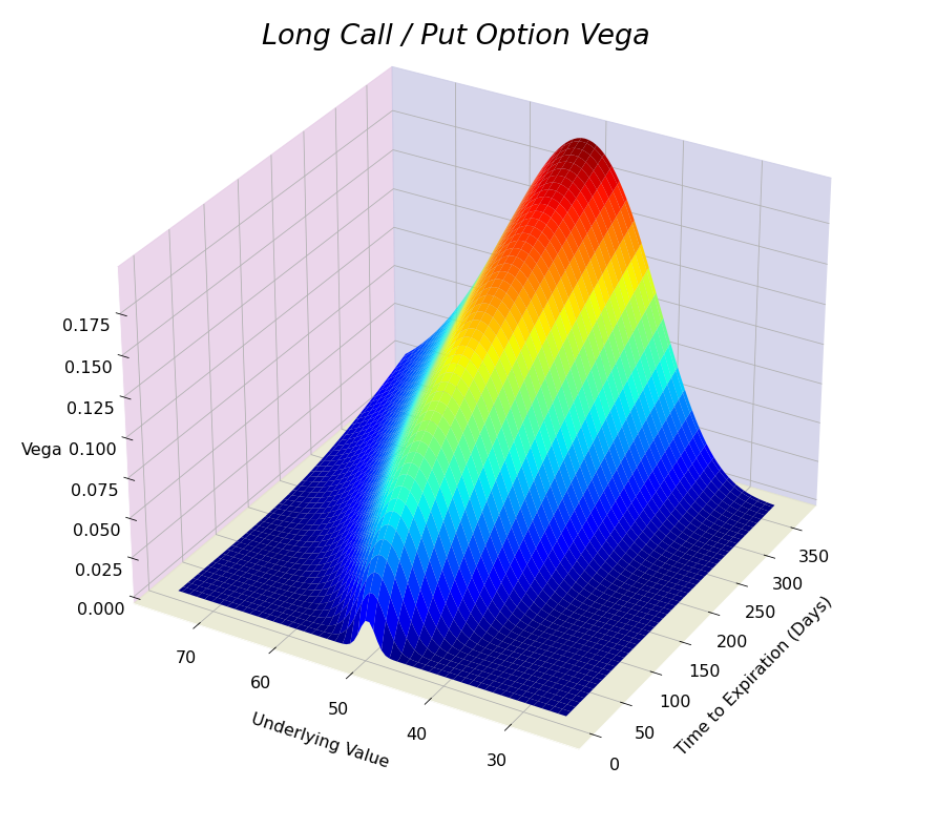
opt.visualize(risk=True, graphtype='3D', greek='vega', S=50)
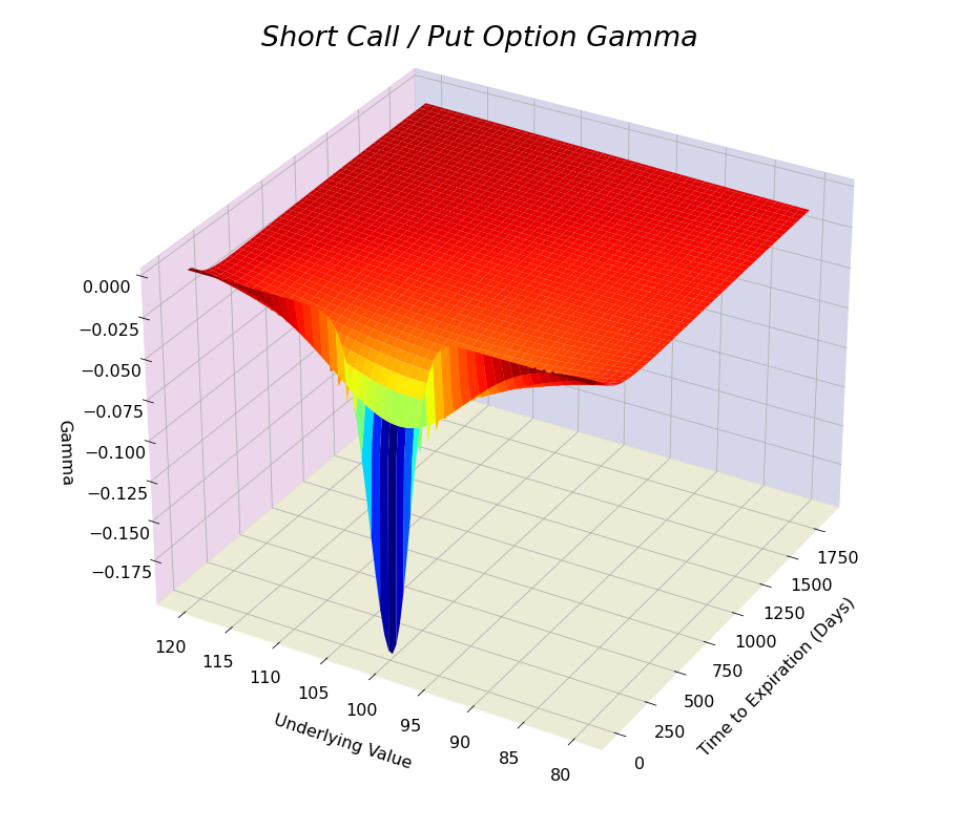
opt.visualize(risk=True, graphtype='3D', greek='gamma', direction='short')
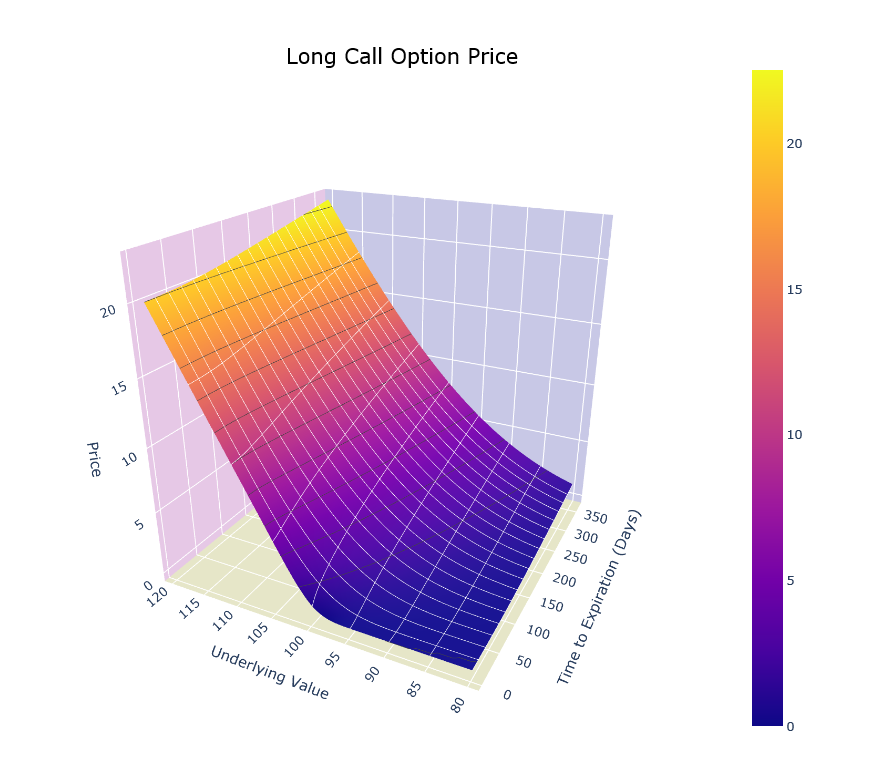
opt.visualize(risk=True, graphtype='3D', greek='price', colorscheme='Plasma', interactive=True)
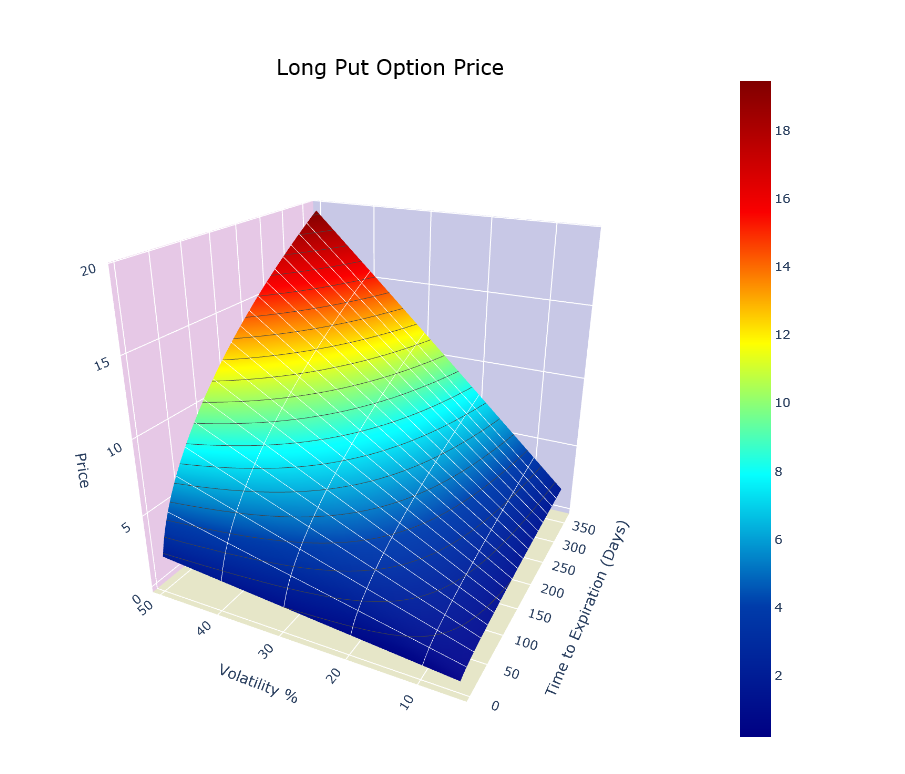
opt.visualize(risk=True, graphtype='3D', greek='price', axis='vol', option='put', interactive=True)
opt.visualize(risk=True, graphtype='3D', greek='vanna', sigma=0.4, interactive=True)
opt.visualize(risk=True, graphtype='3D', greek='zomma', direction='short', interactive=True)
opt.animated_gif(graphtype='3D', greek='gamma', direction='short', gif_folder='images/greeks_3d',gif_filename='gamma_s', gif_min_dist=9.0, gif_max_dist=9.1, gif_min_elev=25, gif_max_elev=26, spacegrain=1000, colorscheme='seismic')
- call / put
- stock
- forward
- collar
- call / put spread
- backspread
- ratio vertical spread
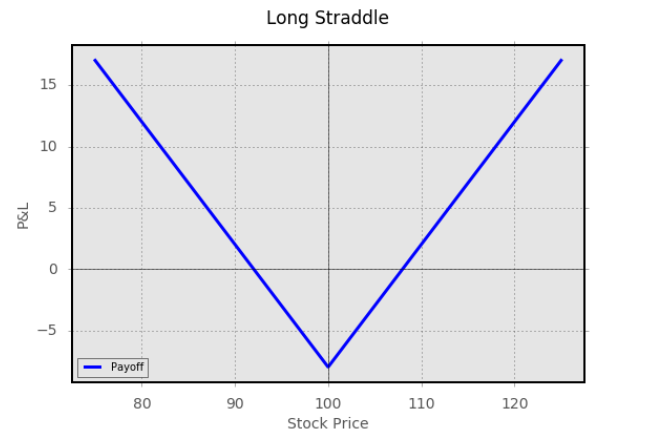
- straddle
- strangle
- butterfly
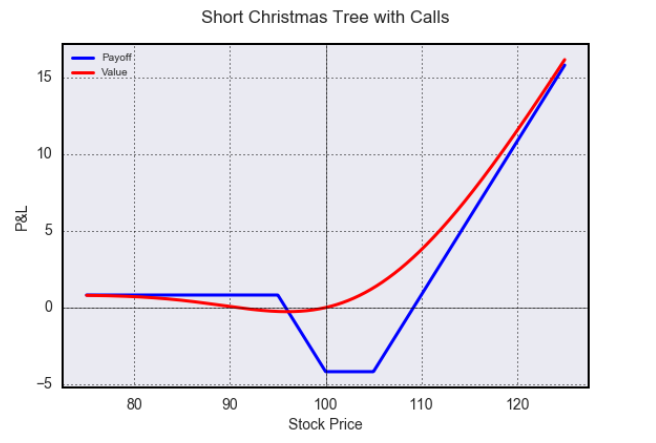
- christmas tree
- iron butterfly
- iron condor
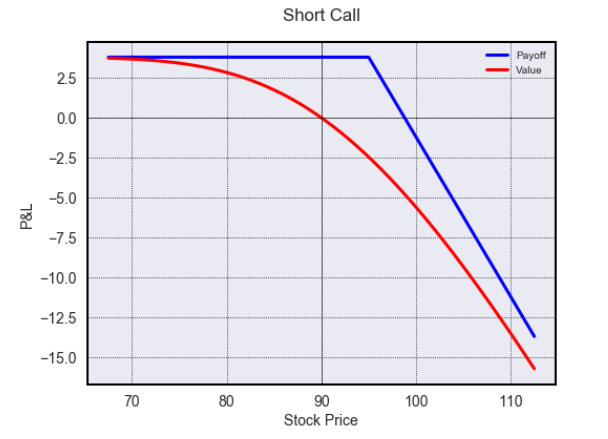
opt.visualize(risk=False, combo_payoff='call', S=90, K=95, T=0.75, r=0.05, q=0, sigma=0.3, direction='short', value=True)
opt.visualize(risk=False, combo_payoff='straddle', mpl_style='ggplot')
opt.visualize(risk=False, combo_payoff='christmas tree', value=True, direction='short')
The following volumes served as a reference for the formulas and charts:
