This is the 'worker' for Grafana's Synthetic Monitoring application. The agent provides probe functionality and executes network checks for monitoring remote targets.
Please install Synthetic Monitoring in your Grafana Cloud or local Grafana instance before setting up your own private probe. You may need to generate a new API key to initialize the app.
Probes run checks from distributed locations around the world and send the resulting metrics and events directly to Grafana Cloud Prometheus and Loki services.
You can select 1 or more public probes to run checks from or run your own private probes from any environment you choose.
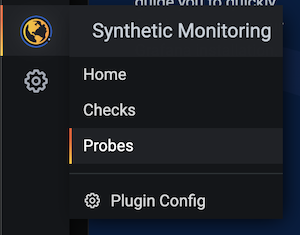
- Navigate to Synthetic Monitoring -> Probes.
- Click New
- Enter a Probe Name, Latitude, Longitude, and Region.
- Optionally enter up to 3 custom labels to identify your probe.
- Click Save
- Copy the "Probe Authentication Token" and save for installing the agent.
- Add package repo GPG key
wget -q -O - https://packages-sm.grafana.com/gpg.key | sudo apt-key add -
- Add Debian package repo
sudo add-apt-repository "deb https://packages-sm.grafana.com/deb stable main"
- Install synthetic-monitoring-agent package
sudo apt-get install synthetic-monitoring-agent
- Edit
/etc/synthetic-monitoring/synthetic-monitoring-agent.confand add the token retrieved from Grafana
# Enter API token retrieved from grafana.com here
API_TOKEN='YOUR TOKEN HERE'
- Restart the agent
sudo service synthetic-monitoring-agent restart
Once the service is running, you will be able to select your new probe exactly the same as any public probe. You will need to manually add the new probe to any previously created checks.
We publish a docker image on docker hub
Steps:
- Get an Authentication Token for your private probe, see here for the steps
# pull image
docker pull grafana/synthetic-monitoring-agent:latest
# export configs
# replace YOUR_TOKEN_HERE with your Authentication Token
export API_TOKEN=YOUR_TOKEN_HERE
export API_SERVER="synthetic-monitoring-grpc.grafana.net:443"
# run
docker run grafana/synthetic-monitoring-agent --api-server-address=${API_SERVER} --api-token=${API_TOKEN} --verbose=true
Now you should have the agent reporting as private probe, and running checks (if you have created some) in the logs.
See examples/kubernetes for the documentation and example yaml files


