Colmet is a monitoring tool to collect metrics about jobs running in a distributed environnement, especially for gathering metrics on clusters and grids. It provides currently several backends :
- Input backends:
- taskstats: fetch task metrics from the linux kernel
- rapl: intel processors realtime consumption metrics
- perfhw: perf_event counters
- jobproc: get infos from /proc
- ipmipower: get power metrics from ipmi
- temperature: get temperatures from /sys/class/thermal
- infiniband: get infiniband/omnipath network metrics
- lustre: get lustre FS stats
- Output backends:
- elasticsearch: store the metrics on elasticsearch indexes
- hdf5: store the metrics on the filesystem
- stdout: display the metrics on the terminal
It uses zeromq to transport the metrics across the network.
It is currently bound to the OAR RJMS.
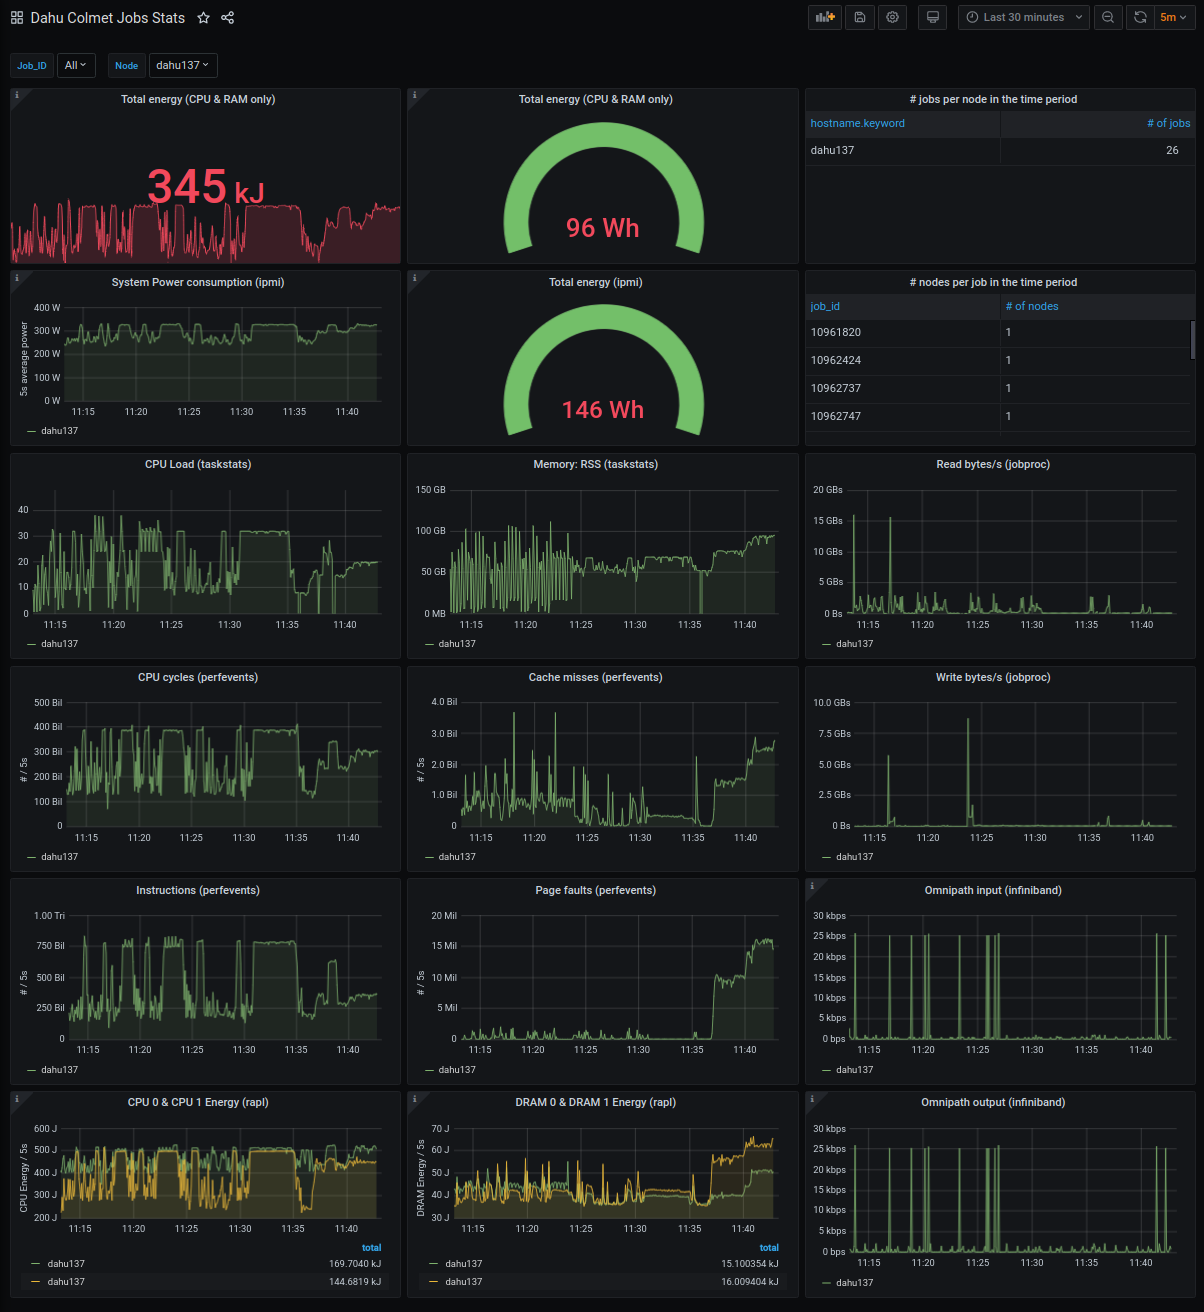
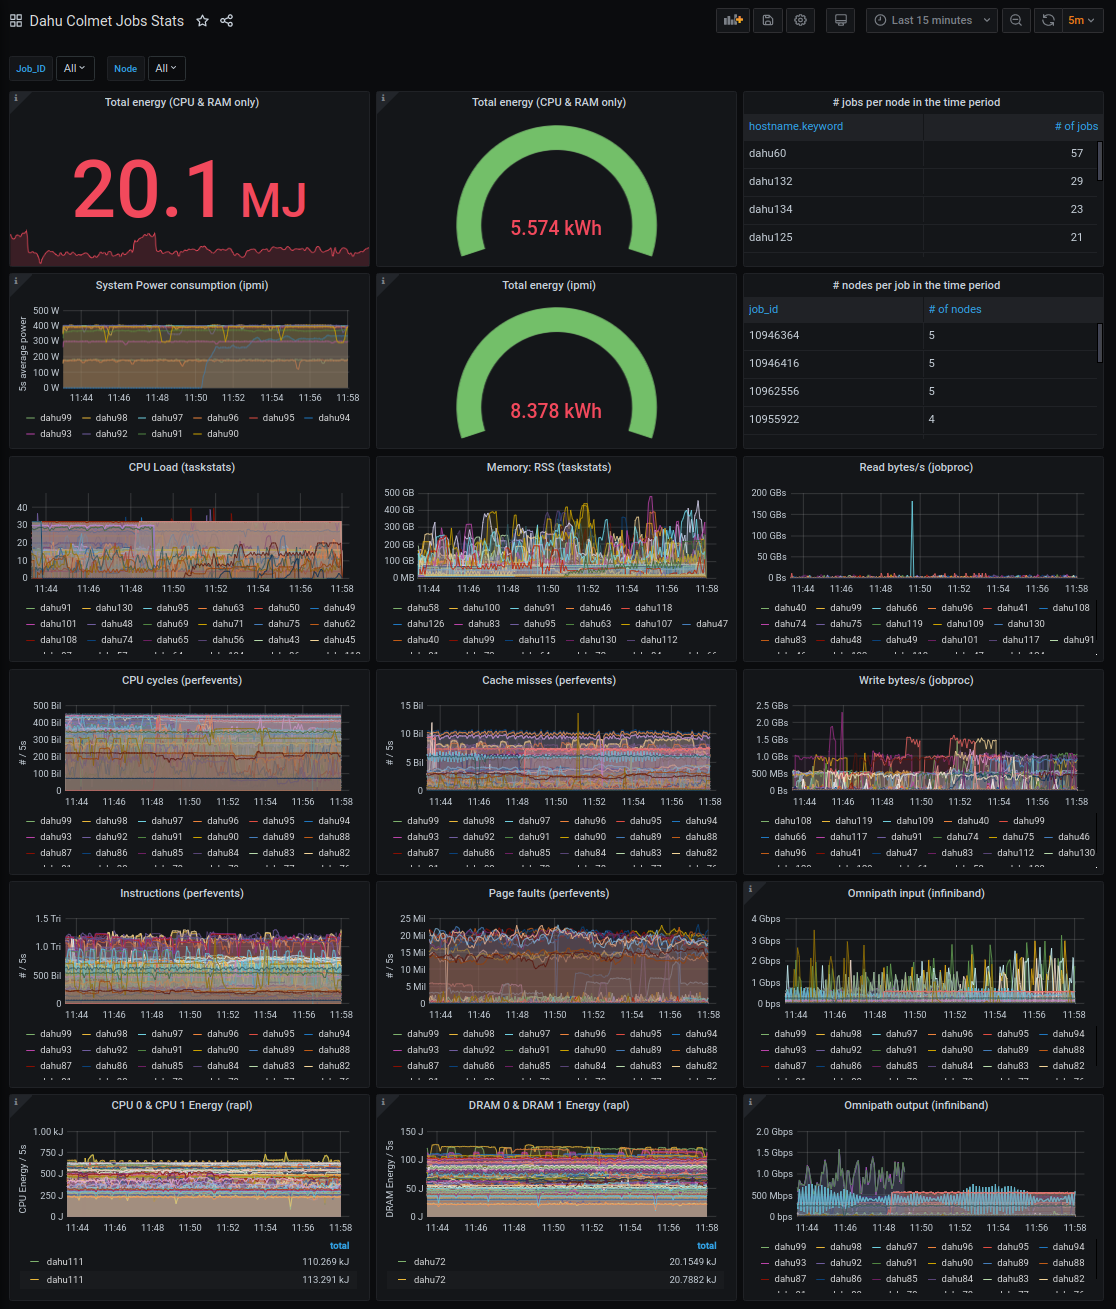
A Grafana sample dashboard is provided for the elasticsearch backend. Here are some snapshots:
-
a Linux kernel that supports
- Taskstats
- intel_rapl (for RAPL backend)
- perf_event (for perfhw backend)
- ipmi_devintf (for ipmi backend)
-
Python Version 2.7 or newer
- python-zmq 2.2.0 or newer
- python-tables 3.3.0 or newer
- python-pyinotify 0.9.3-2 or newer
- python-requests
-
For the Elasticsearch output backend (recommended for sites with > 50 nodes)
- An Elasticsearch server
- A Grafana server (for visu)
-
For the RAPL input backend:
- libpowercap, powercap-utils (https://github.com/powercap/powercap)
-
For the infiniband backend:
perfquerycommand line tool
-
for the ipmipower backend:
ipmi-oemcommand line tool (freeipmi) or other configurable command
You can install, upgrade, uninstall colmet with these commands::
$ pip install [--user] colmet
$ pip install [--user] --upgrade colmet
$ pip uninstall colmet
Or from git (last development version)::
$ pip install [--user] git+https://github.com/oar-team/colmet.git
Or if you already pulled the sources::
$ pip install [--user] path/to/sources
for the nodes :
sudo colmet-node -vvv --zeromq-uri tcp://127.0.0.1:5556
for the collector :
# Simple local HDF5 file collect:
colmet-collector -vvv --zeromq-bind-uri tcp://127.0.0.1:5556 --hdf5-filepath /data/colmet.hdf5 --hdf5-complevel 9
# Collector with an Elasticsearch backend:
  colmet-collector -vvv \
    --zeromq-bind-uri tcp://192.168.0.1:5556 \
    --buffer-size 5000 \
    --sample-period 3 \
    --elastic-host http://192.168.0.2:9200 \
    --elastic-index-prefix colmet_dahu_ 2>>/var/log/colmet_err.log >> /var/log/colmet.log
You will see the number of counters retrieved in the debug log.
For more information, please refer to the help of theses scripts (--help)
Some input backends may need external libraries that need to be previously compiled and installed:
# For the perfhw backend:
cd colmet/node/backends/lib_perf_hw/ && make && cp lib_perf_hw.so /usr/local/lib/
# For the rapl backend:
cd colmet/node/backends/lib_rapl/ && make && cp lib_rapl.so /usr/local/lib/
Here's acomplete colmet-node start-up process, with perfw, rapl and more backends:
export LIB_PERFHW_PATH=/usr/local/lib/lib_perf_hw.so
export LIB_RAPL_PATH=/applis/site/colmet/lib_rapl.so

colmet-node -vvv --zeromq-uri tcp://192.168.0.1:5556 \
   --cpuset_rootpath /dev/cpuset/oar \
   --enable-infiniband --omnipath \
   --enable-lustre \
   --enable-perfhw --perfhw-list instructions cache_misses page_faults cpu_cycles cache_references \
   --enable-RAPL \
   --enable-jobproc \
   --enable-ipmipower >> /var/log/colmet.log 2>&1
RAPL is a feature on recent Intel processors that makes possible to know the power consumption of cpu in realtime.
Usage : start colmet-node with option --enable-RAPL
A file named RAPL_mapping.[timestamp].csv is created in the working directory. It established the correspondence between counter_1, counter_2, etc from collected data and the actual name of the metric as well as the package and zone (core / uncore / dram) of the processor the metric refers to.
If a given counter is not supported by harware the metric name will be "counter_not_supported_by_hardware" and 0 values will appear in the collected data; -1 values in the collected data means there is no counter mapped to the column.
This provides metrics collected using interface perf_event_open.
Usage : start colmet-node with option --enable-perfhw
Optionnaly choose the metrics you want (max 5 metrics) using options --perfhw-list followed by space-separated list of the metrics/
Example : --enable-perfhw --perfhw-list instructions cpu_cycles cache_misses
A file named perfhw_mapping.[timestamp].csv is created in the working directory. It establishes the correspondence between counter_1, counter_2, etc from collected data and the actual name of the metric.
Available metrics (refers to perf_event_open documentation for signification) :
cpu_cycles
instructions
cache_references
cache_misses
branch_instructions
branch_misses
bus_cycles
ref_cpu_cycles
cache_l1d
cache_ll
cache_dtlb
cache_itlb
cache_bpu
cache_node
cache_op_read
cache_op_prefetch
cache_result_access
cpu_clock
task_clock
page_faults
context_switches
cpu_migrations
page_faults_min
page_faults_maj
alignment_faults
emulation_faults
dummy
bpf_output
This backend gets temperatures from /sys/class/thermal/thermal_zone*/temp
Usage : start colmet-node with option --enable-temperature
A file named temperature_mapping.[timestamp].csv is created in the working directory. It establishes the correspondence between counter_1, counter_2, etc from collected data and the actual name of the metric.

