Add metrics to your own application easily, using this dockerized stack.
This stack has:
- grafana
- graphite
- and a sample Java application using metrics library
Get this repo first.
Start the monitoring stack as follows
$   cd  metrics-in-docker

$   ./start.sh
Go to Grafana URL : localhost:3000
Login with username 'admin' and password 'admin'
Skip the prompt to change the default password.
There is a sample project under sample-app-java directory.
Import this project in Eclipse.
Inspect file : src/main/java/com/elephantscale/metrics_demo/MyMetricsRegistry.java
Make sure the graphite hosts is 'localhost'
public final static String GRAPHITE_HOST = "localhost";And run the class : com.elephantscale.MyMetricsDemo
You will see metrics being printed on console.
In Grafana,
- Go to 'Dashboard' section
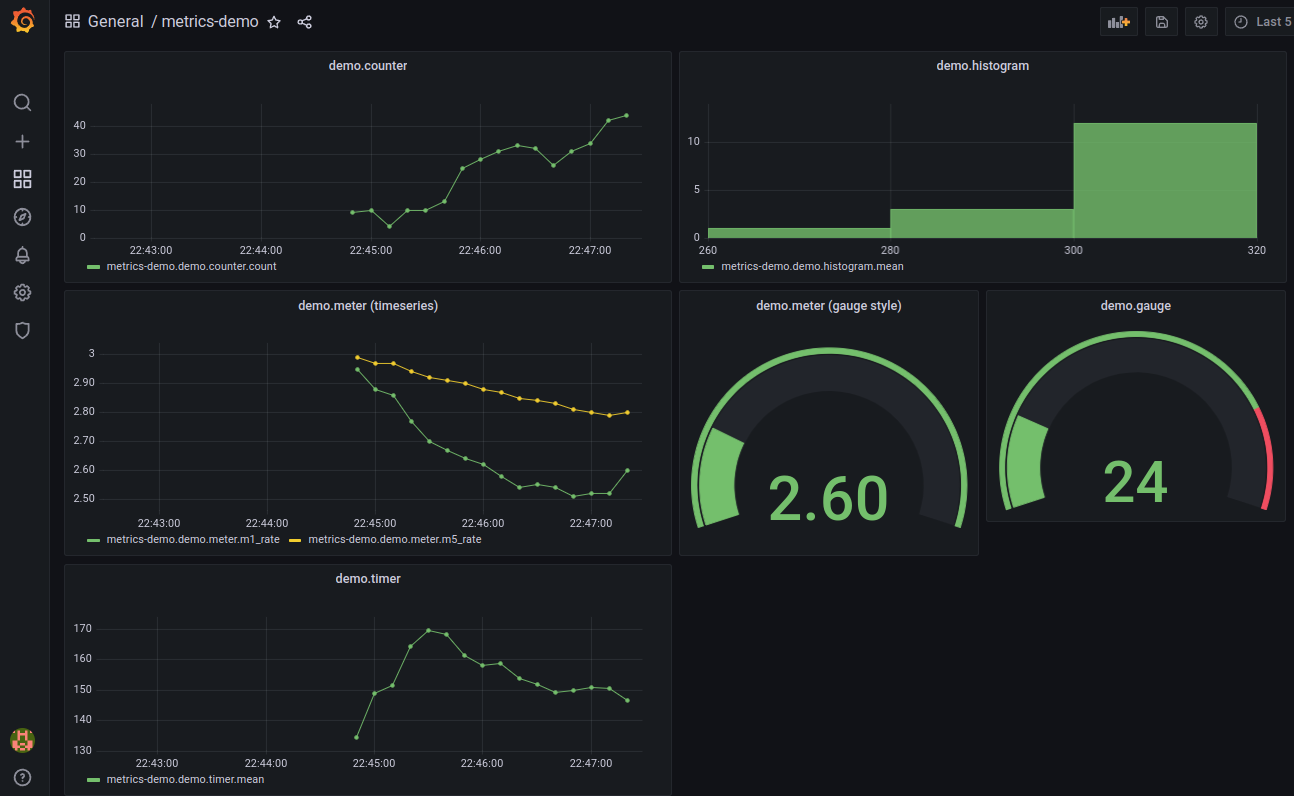
- And open 'metrics-demo' dashboard
You will something like this!
Enjoy 👏 !
Don't have a Java Dev environment? Don't worry, use our java-dev docker.
Start the java-dev container
$   cd  metrics-docker
$   ./start-java-dev.sh
A few things to note:
- We run the container as
CURRENT_USER. This makes sure that all artifacts created have proper permissions by current user. - Also we mount
$HOME/.m2directory into/var/maven/.m2directory in container. This allows maven to reuse downloaded artifacts. This will hugely speed up compiles
This will drop you into the container.
Before running, inspect file : src/main/java/com/elephantscale/metrics_demo/MyMetricsRegistry.java
Make sure the graphite hosts is 'graphite'. This should match the conainer name for Graphite in docker-compose.yml
public final static String GRAPHITE_HOST = "graphite";# in container, you will be in /workspace directory
$ cd sample-java-app
$ mvn clean package
$ ./run-metrics-demo.shYou will see metrics being printed on console.
In Grafana,
- Go to 'Dashboard' section
- And open 'metrics-demo' dashboard
You will something like this!
Enjoy 👏 !
