This application offers clients an online investment solution for their retirement portfolios through the use of algorithms that choose from various investment styles and options.
The goal is to determine the fund with the most investment potential based on key risk-management metrics: the daily returns, standard deviations, Sharpe ratios, and betas.
This application leverages python 3.7 with the following packages:
- pandas: an open-source library that offers easy-to-use data analysis tools for Python.
- pathlib: for creation of file paths allowing the application to interact with a computer's filesystem.
- %matplotlib: for creating static, animated, and interactive visualizations in Python.
To run this code, first clone the GitHub repo this file is in into your Terminal. Next, to install these packages, while in this same repo in your Terminal, enter pip install -r requirements.txt.
In addition to the normal dependencies above, to run the Risk Return Analysis code you need to first activate the correct environment by inputting the following command in your terminal:
conda activate dev
Next, while in your IDE, open the "risk_return_analysis.ipynb" notebook file and run the code.
To begin with, the code imports and reads data from the whale_navs.csv file included in this repo. This file contains NAV prices of four major funds plus S&P 500 Index data. Once the data is imported, it is converted into a Pandas DataFrame including only daily return values for each of the funds and the S&P 500 Index.
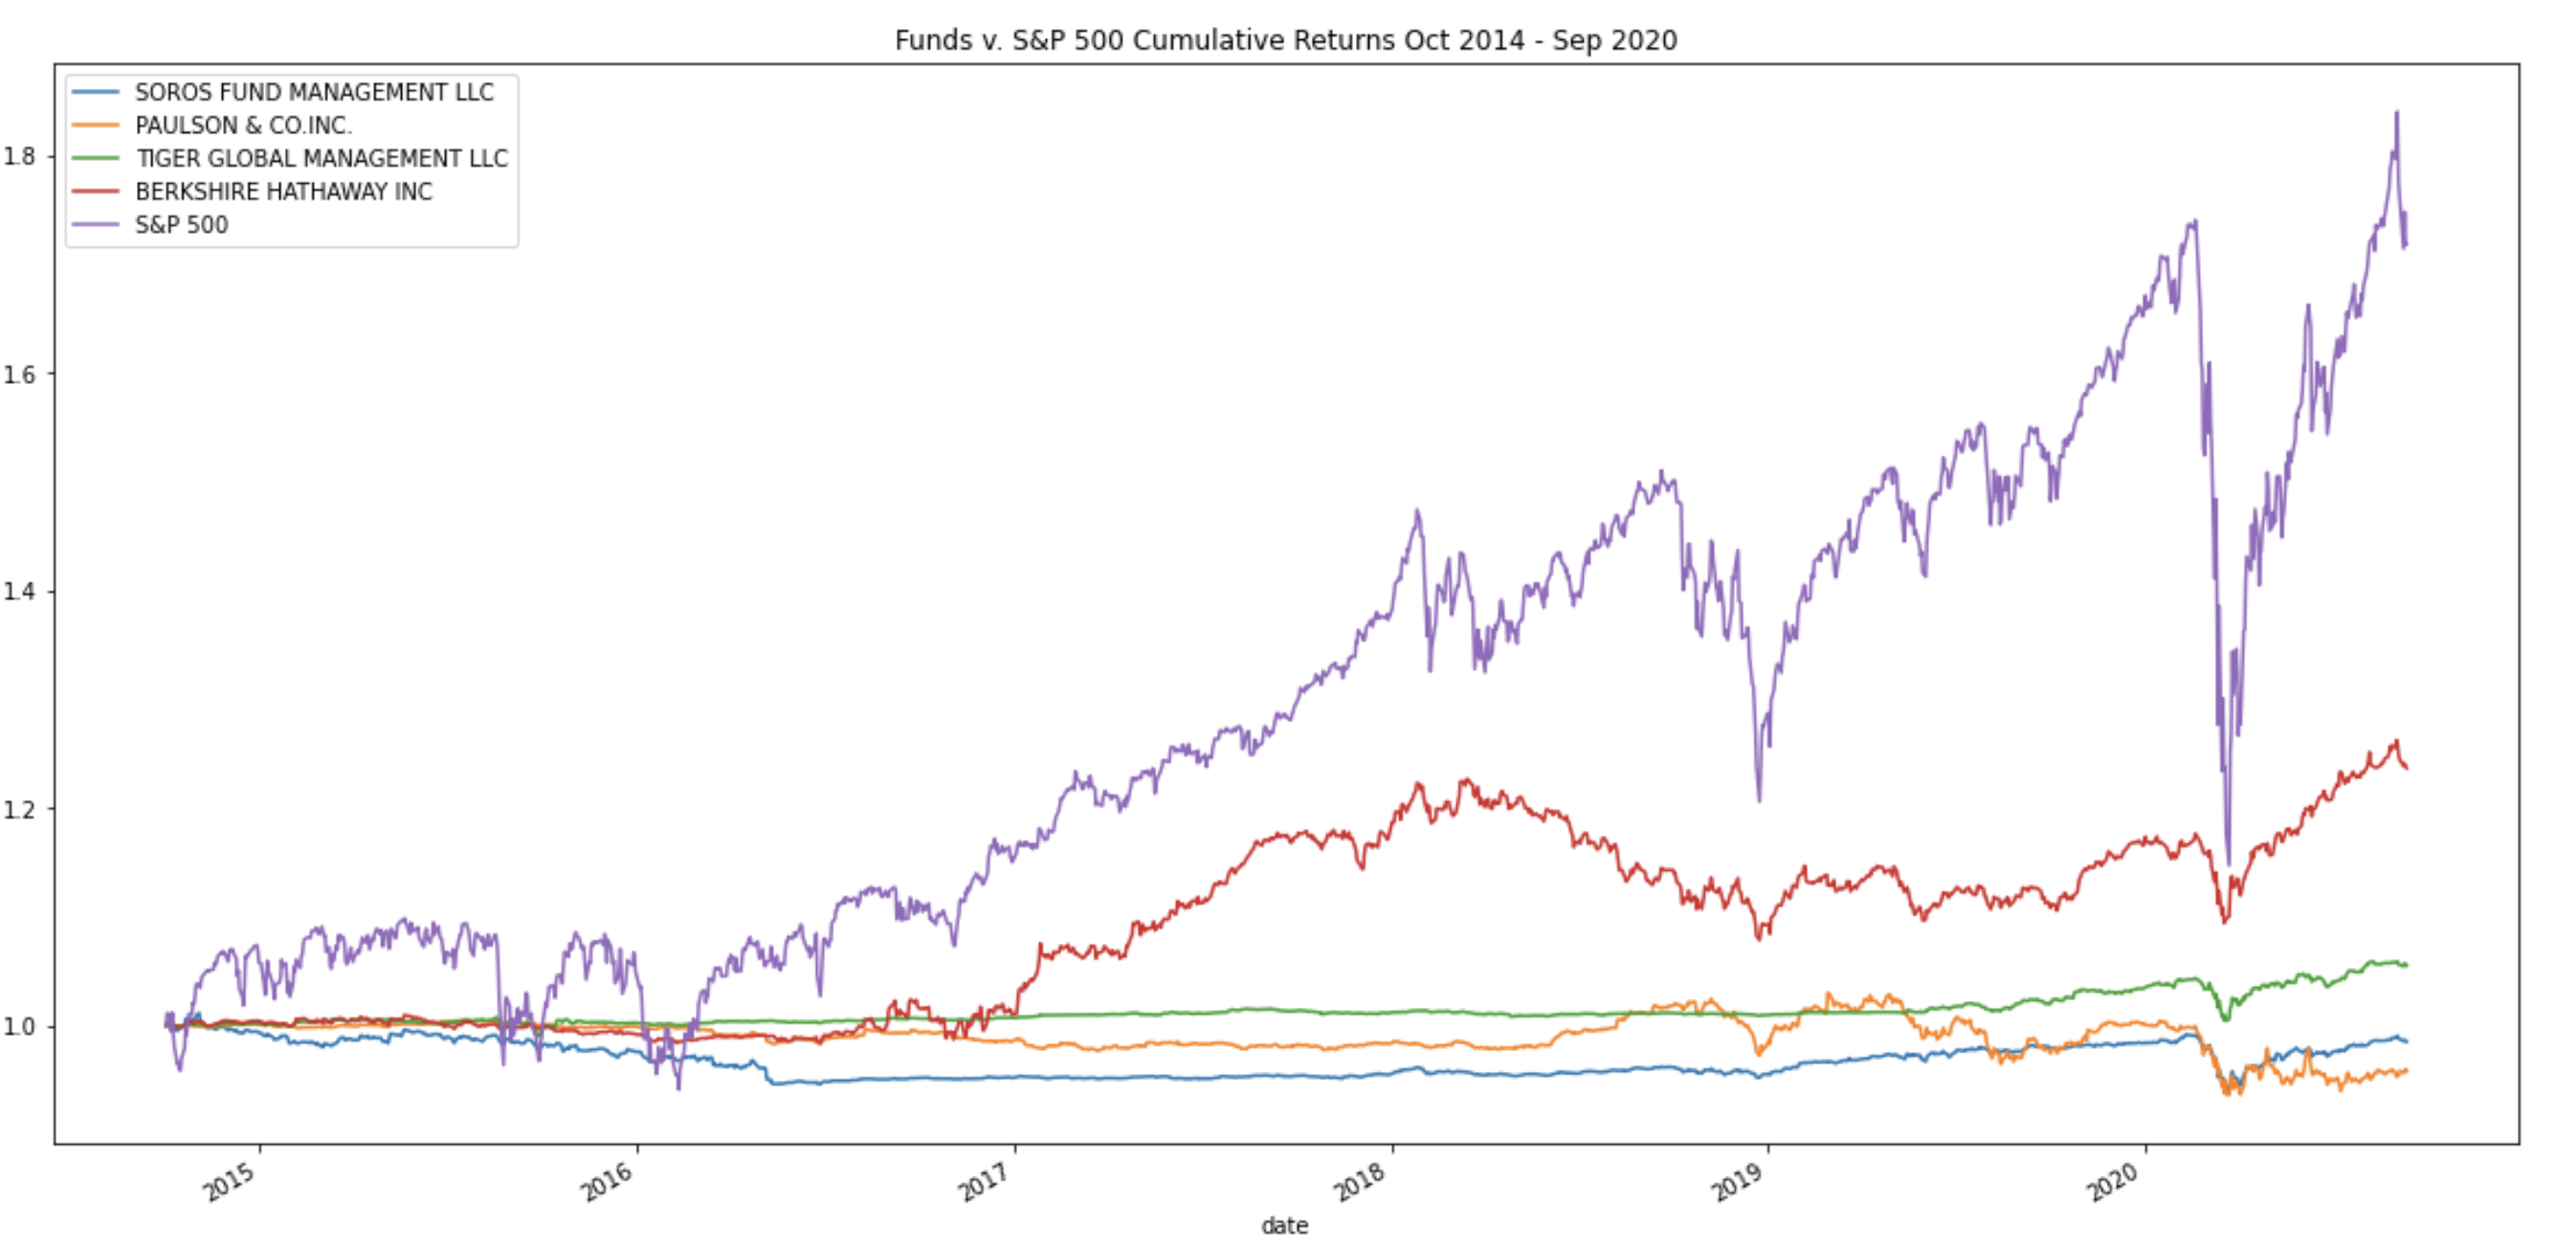
These daily returns are plotted on an overlay line plot for visual comparison. Next, each of the funds' and the S&P 500 Index's cumulative returns are calculated for the time period and then plotted on the same plot, again overlayed for visual comparison, as shown here:
Volatility of each of the four fund portfolios and of the S&P 500 Index is then visually analyzed with box plots. Standard deviations are next determined, as well as the annualized standard deviation and rolling standard deviations for a 21-day window. These rolling standard deviations are plotted on an overlay line plot.
Risk-return metrics are next analyzed. Sharpe ratios are calculated and visualized via a bar plot for comparison.
To evaluate how the portfolios react relative to the broader market, covariance using a 60-day rolling window is determined for each of the best two performing funds (selected on a risk-return basis) compared to the S&P 500 Index. Beta values, likewise using a 60-day rolling window, are then determined and plotted.
Nicole Roberts, elle.nicole.roberts@gmail.com
BSD 3: BSD 3-clause is a permissive licence, allowing nearly unlimited freedom with the software as long as BSD copyright and license notice is included.

