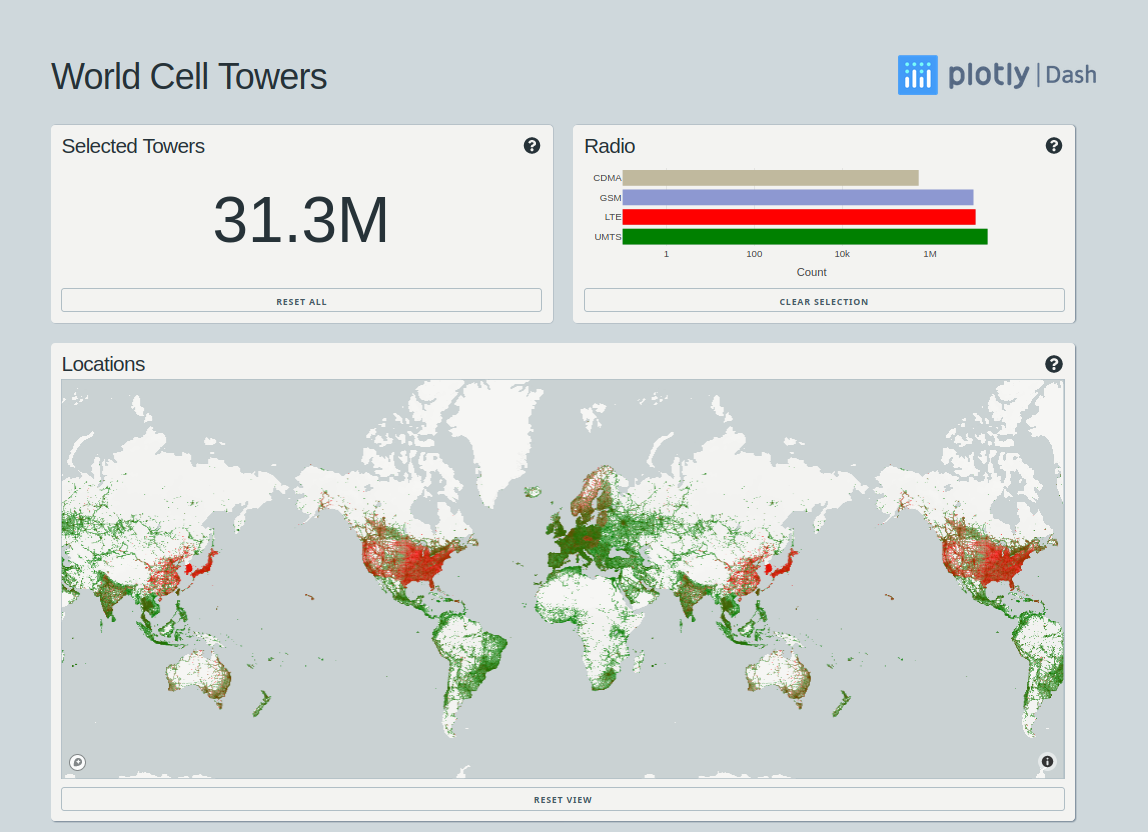
This repo contains a Python Dash app for exploring the world cell tower dataset provided by OpenCellid.
This dataset contains over 40 million rows of data, each row including several cell tower features in addition to the latitude/longitude location of the tower. To handle this fairly large dataset, this app makes use of Dask for parallel processing, and Datashader for server side rendering.
First, create a virtualenv or conda environment that includes the dependencies listed
in the requirements.txt file.
Due to storage constraints, this repository does not include the cell towers dataset.
Instead, the notebooks/prepare_cell_data.ipynb Jupyter notebook contains instructions
for downloading the raw data, and the notebook itself will process the data set and
write out a compressed parquet file to the ./data directory.
Alternatively, download the cell_towers.parq.zip file from Google drive at
https://drive.google.com/open?id=1mOZq24EFI0eNC2xtVEFQyPxVPHLZI9QN, then unzip it as
cell_towers.parq (even though it has a file extension, this will be a directory)
and place it at data/cell_towers.parq.
To run the dashboard, create a file name .mapbox_token under to root directory. This
file should contain a valid Mapbox token, which can be obtained for free by setting up
an account at https://www.mapbox.com/.
Launch the dashboard in development mode from the command line with:
$ ./launch_dev.sh
Then open the dashboard at the URL displayed by the command.
Launch the dashboard in deployment mode with gunicorn from the command line with:
$ ./launch.sh
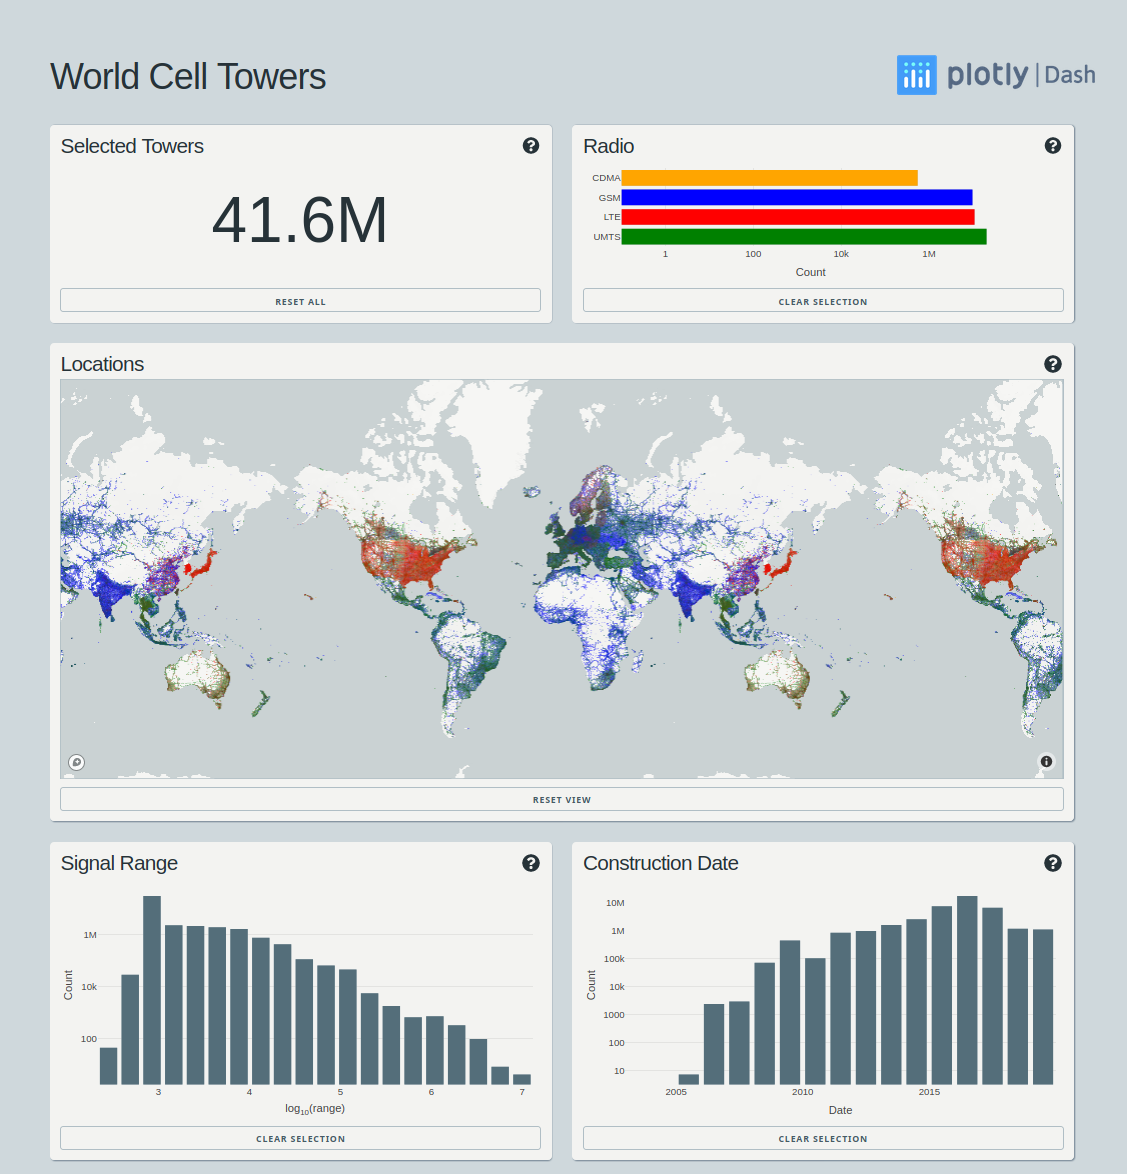
Click on Radio panel bars to select cell towers by radio technology:

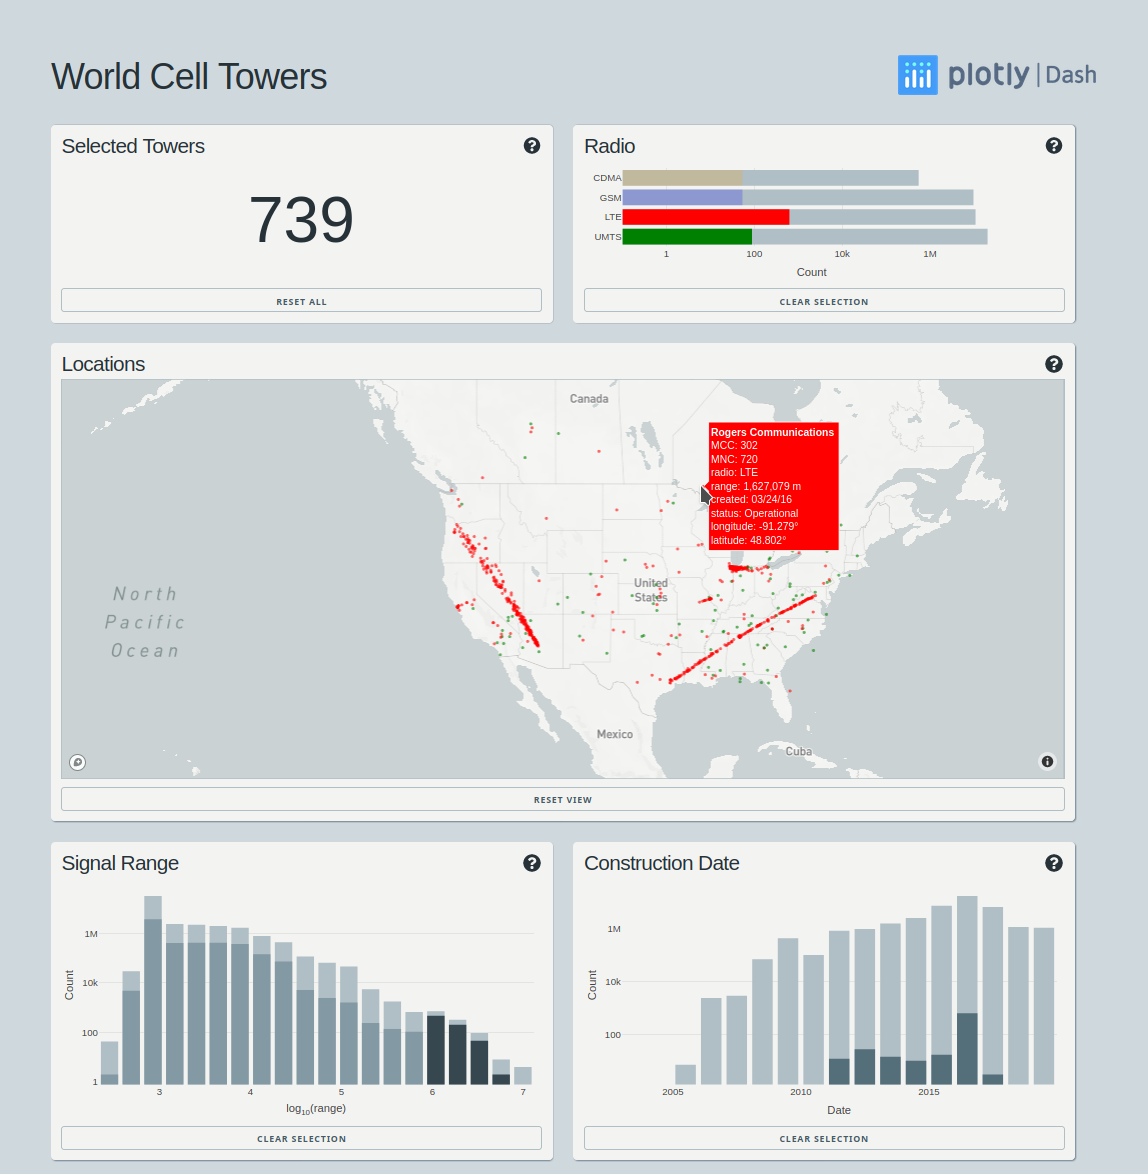
Drag to select the towers with the longest range using the Signal Range panel. As in
this case, when the active selections result in fewer than 5000 towers, the map view
switches from using Datashader to displaying towers using a scattermapbox scatter
trace that includes tooltips with detailed information about each individual tower.

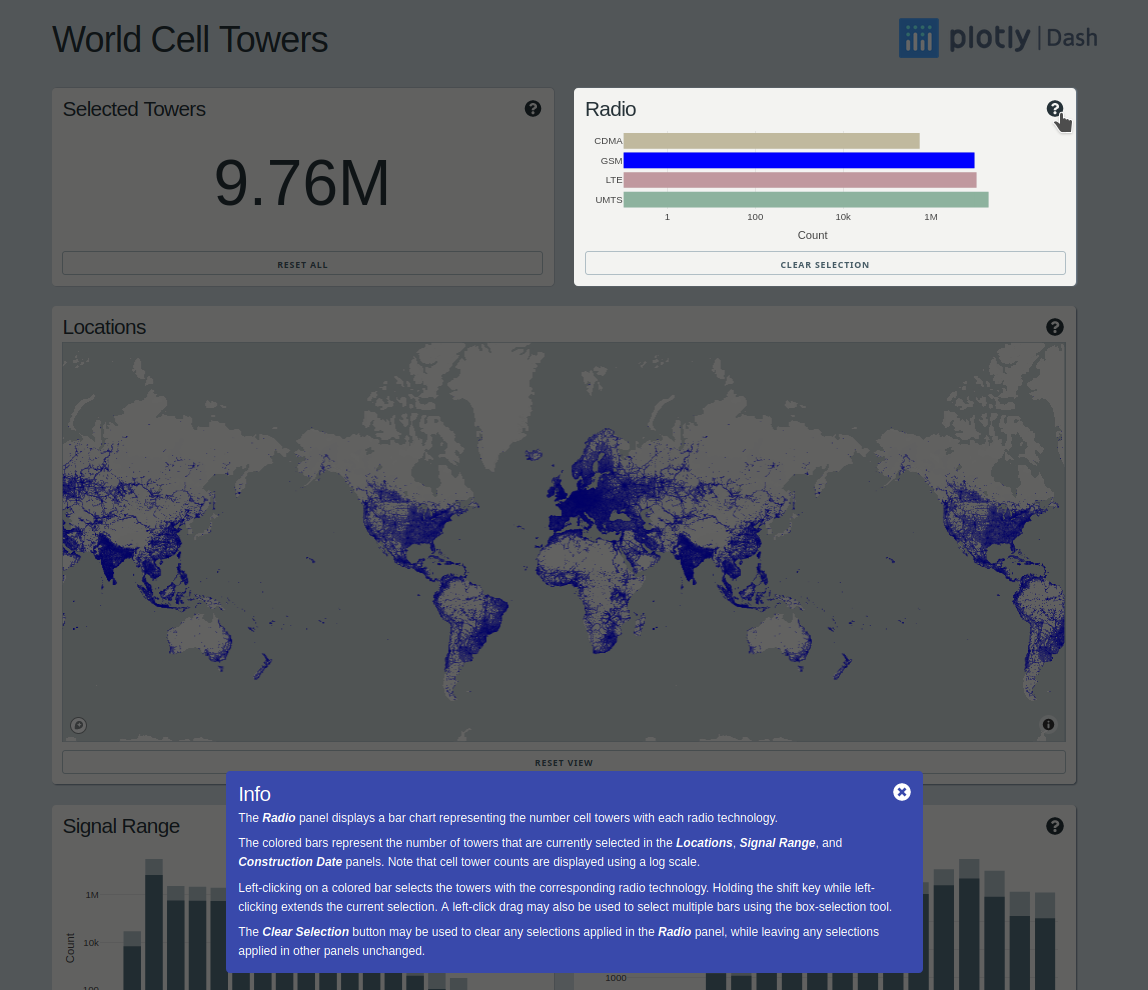
Documentation for each panel can be activated by clicking on the question mark icon in the top right corner of the panel. Documentation appears in a second floating panel, and the panel that is being described is highlighted. The documentation panel is closed by clicking the close icon in the top right corner of the documentation panel.

