CmyPlot
Data Visualisation Web App
Why Data Visualization?
With enormous data in hand you would always want to visualize it for good understanding and better clarity with minimal efforts.
As the famous saying goes - "The greatest value of visualization is when it forces us to notice what we never expected to see" - John W. Tukey
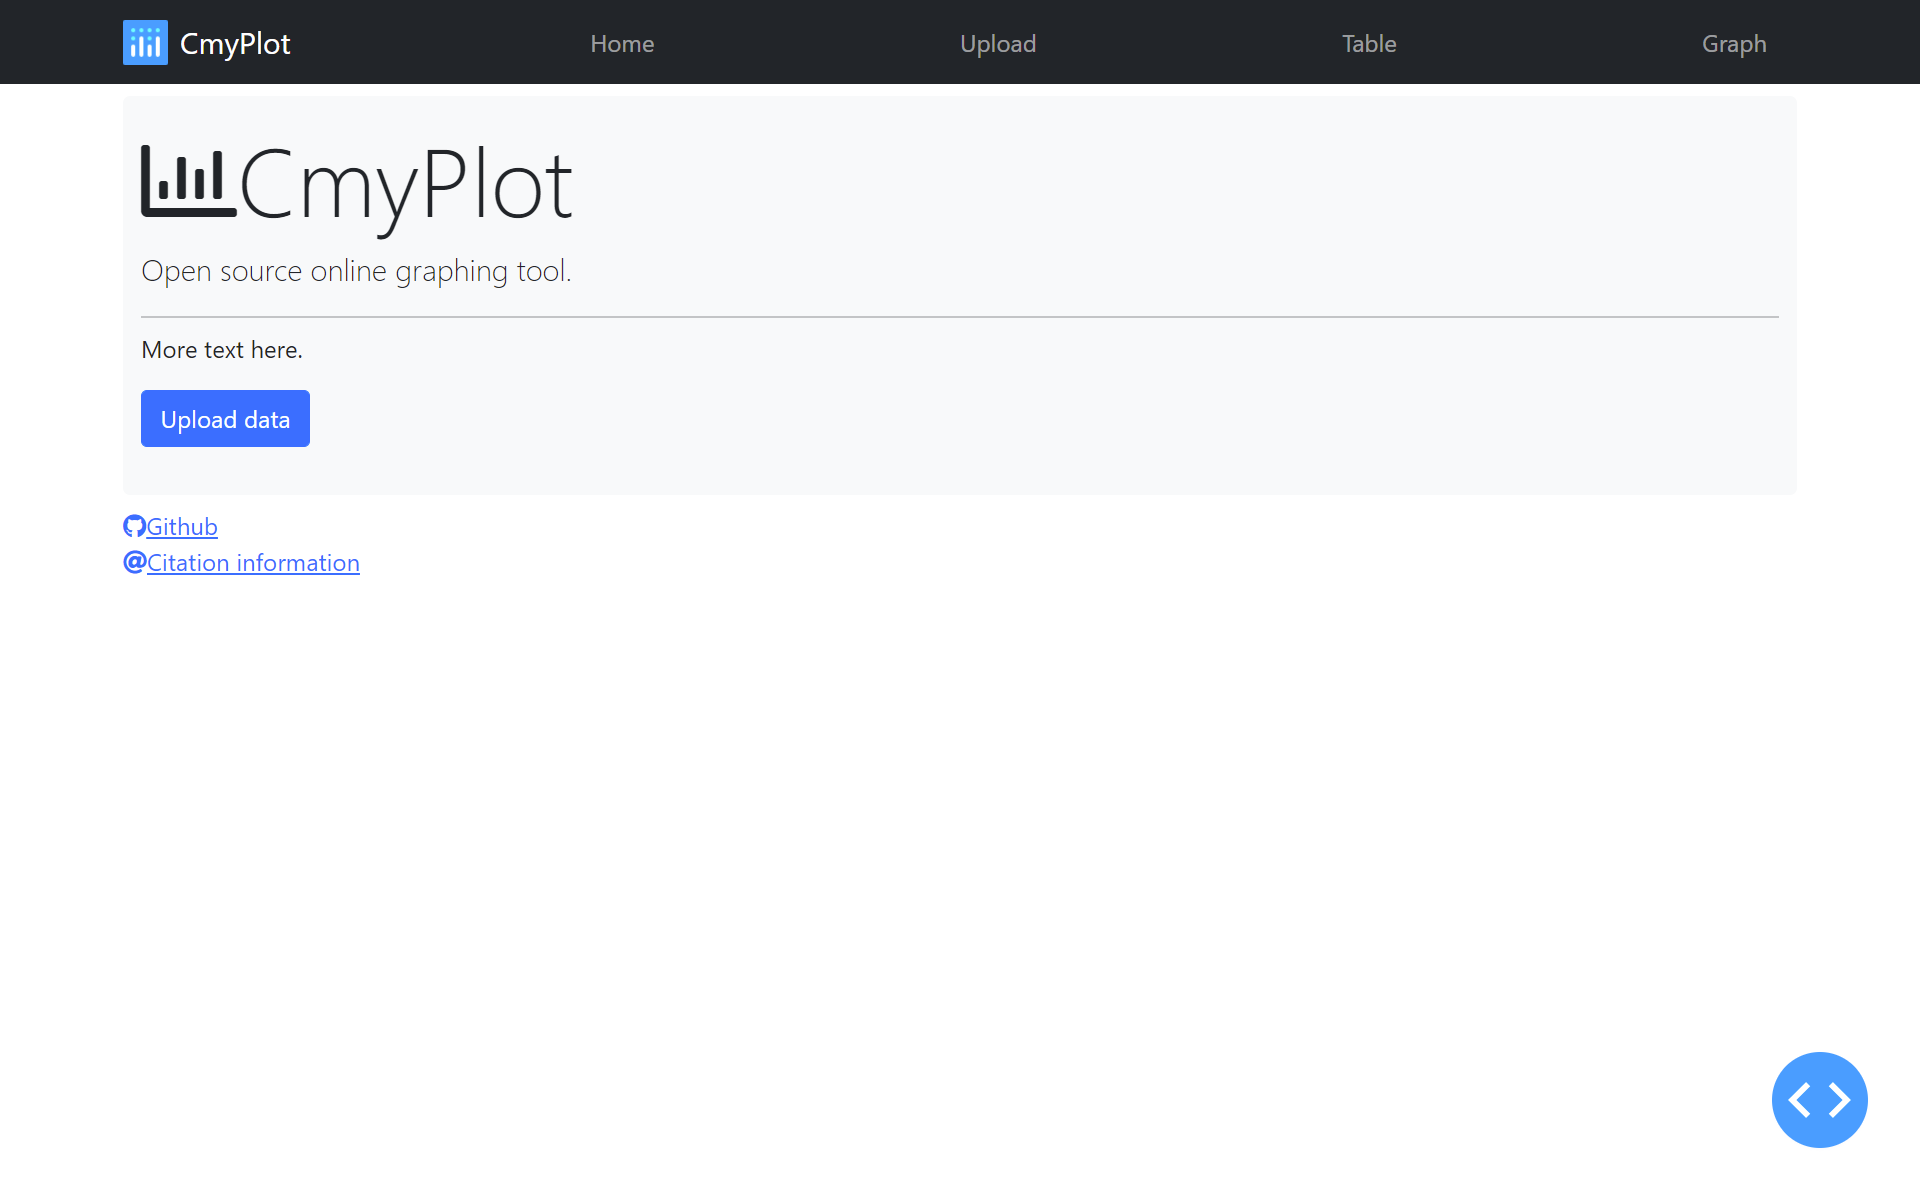
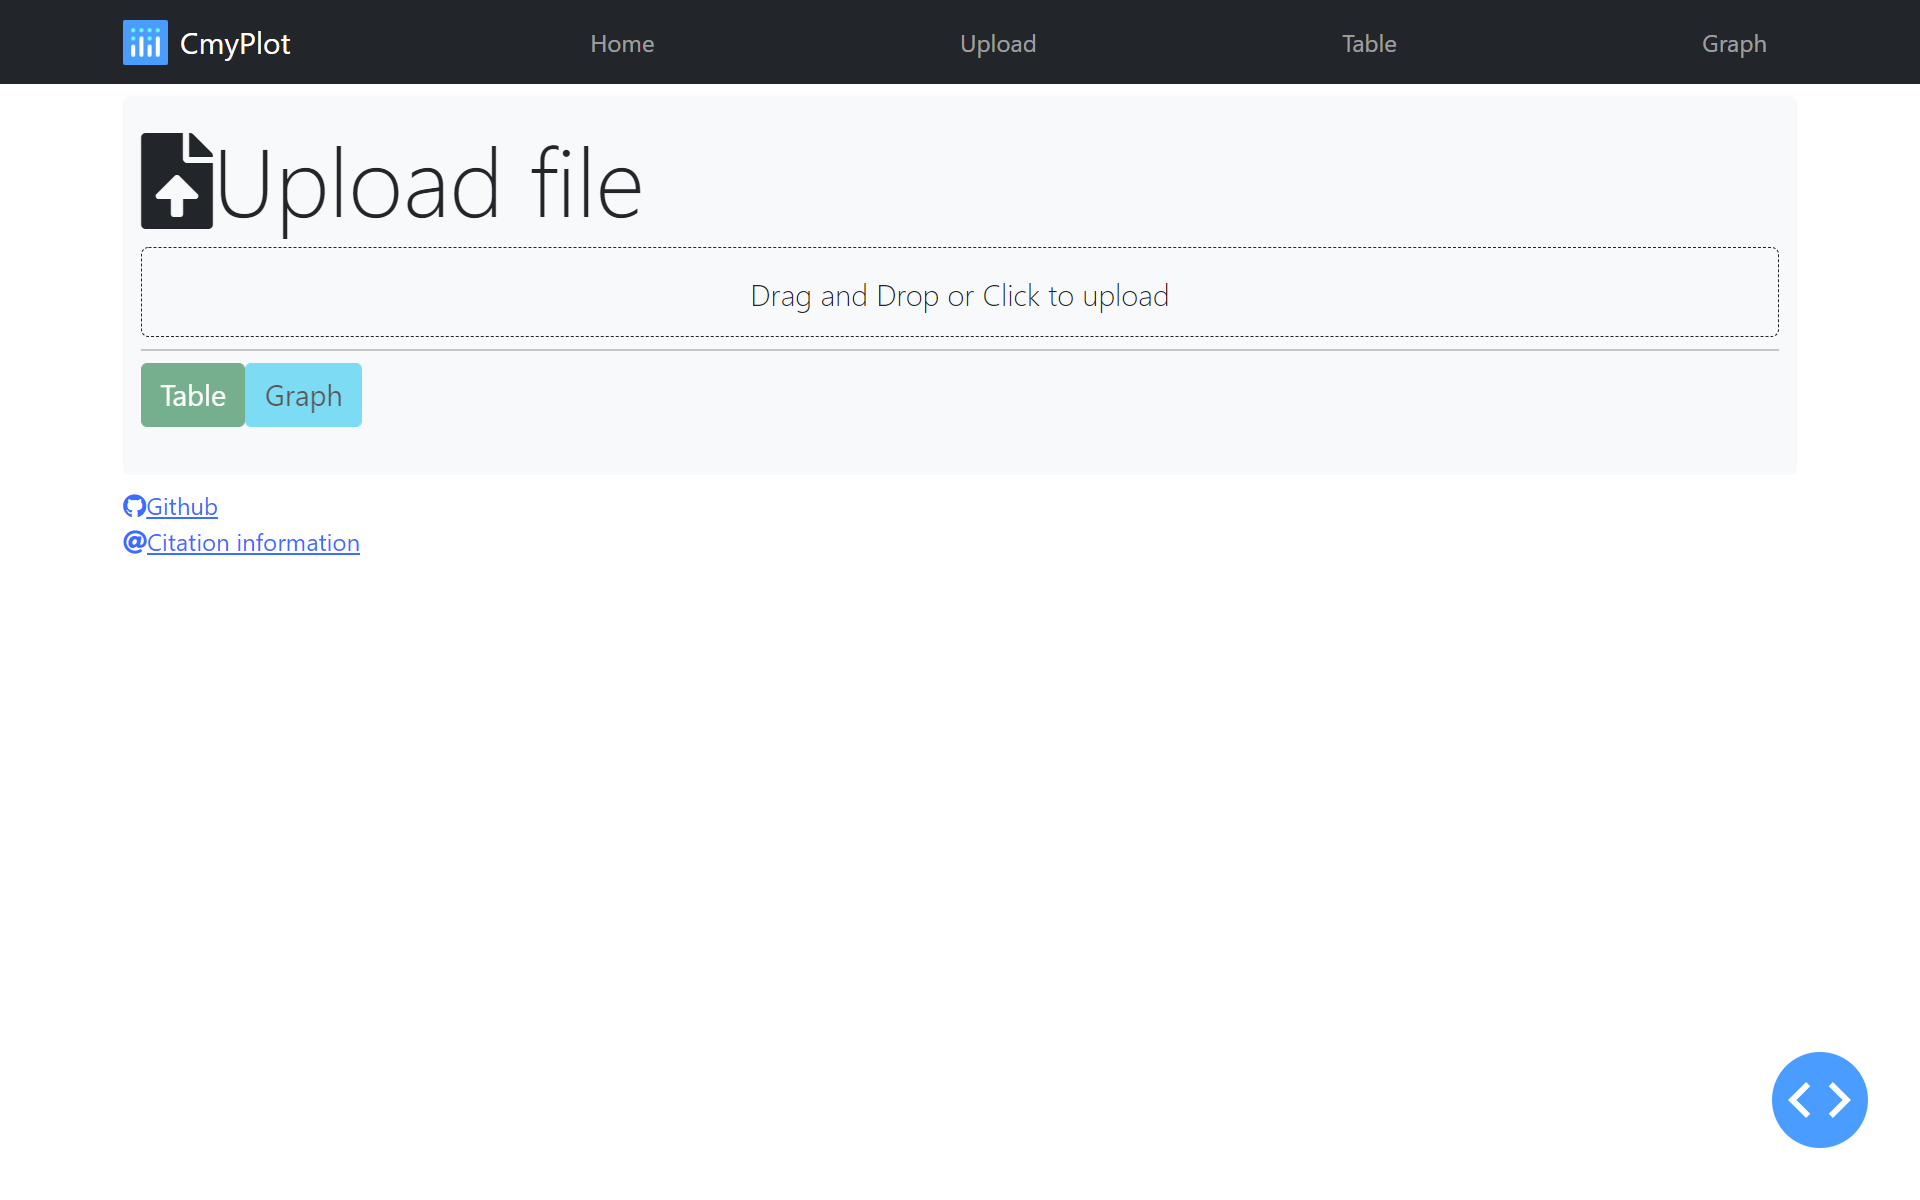
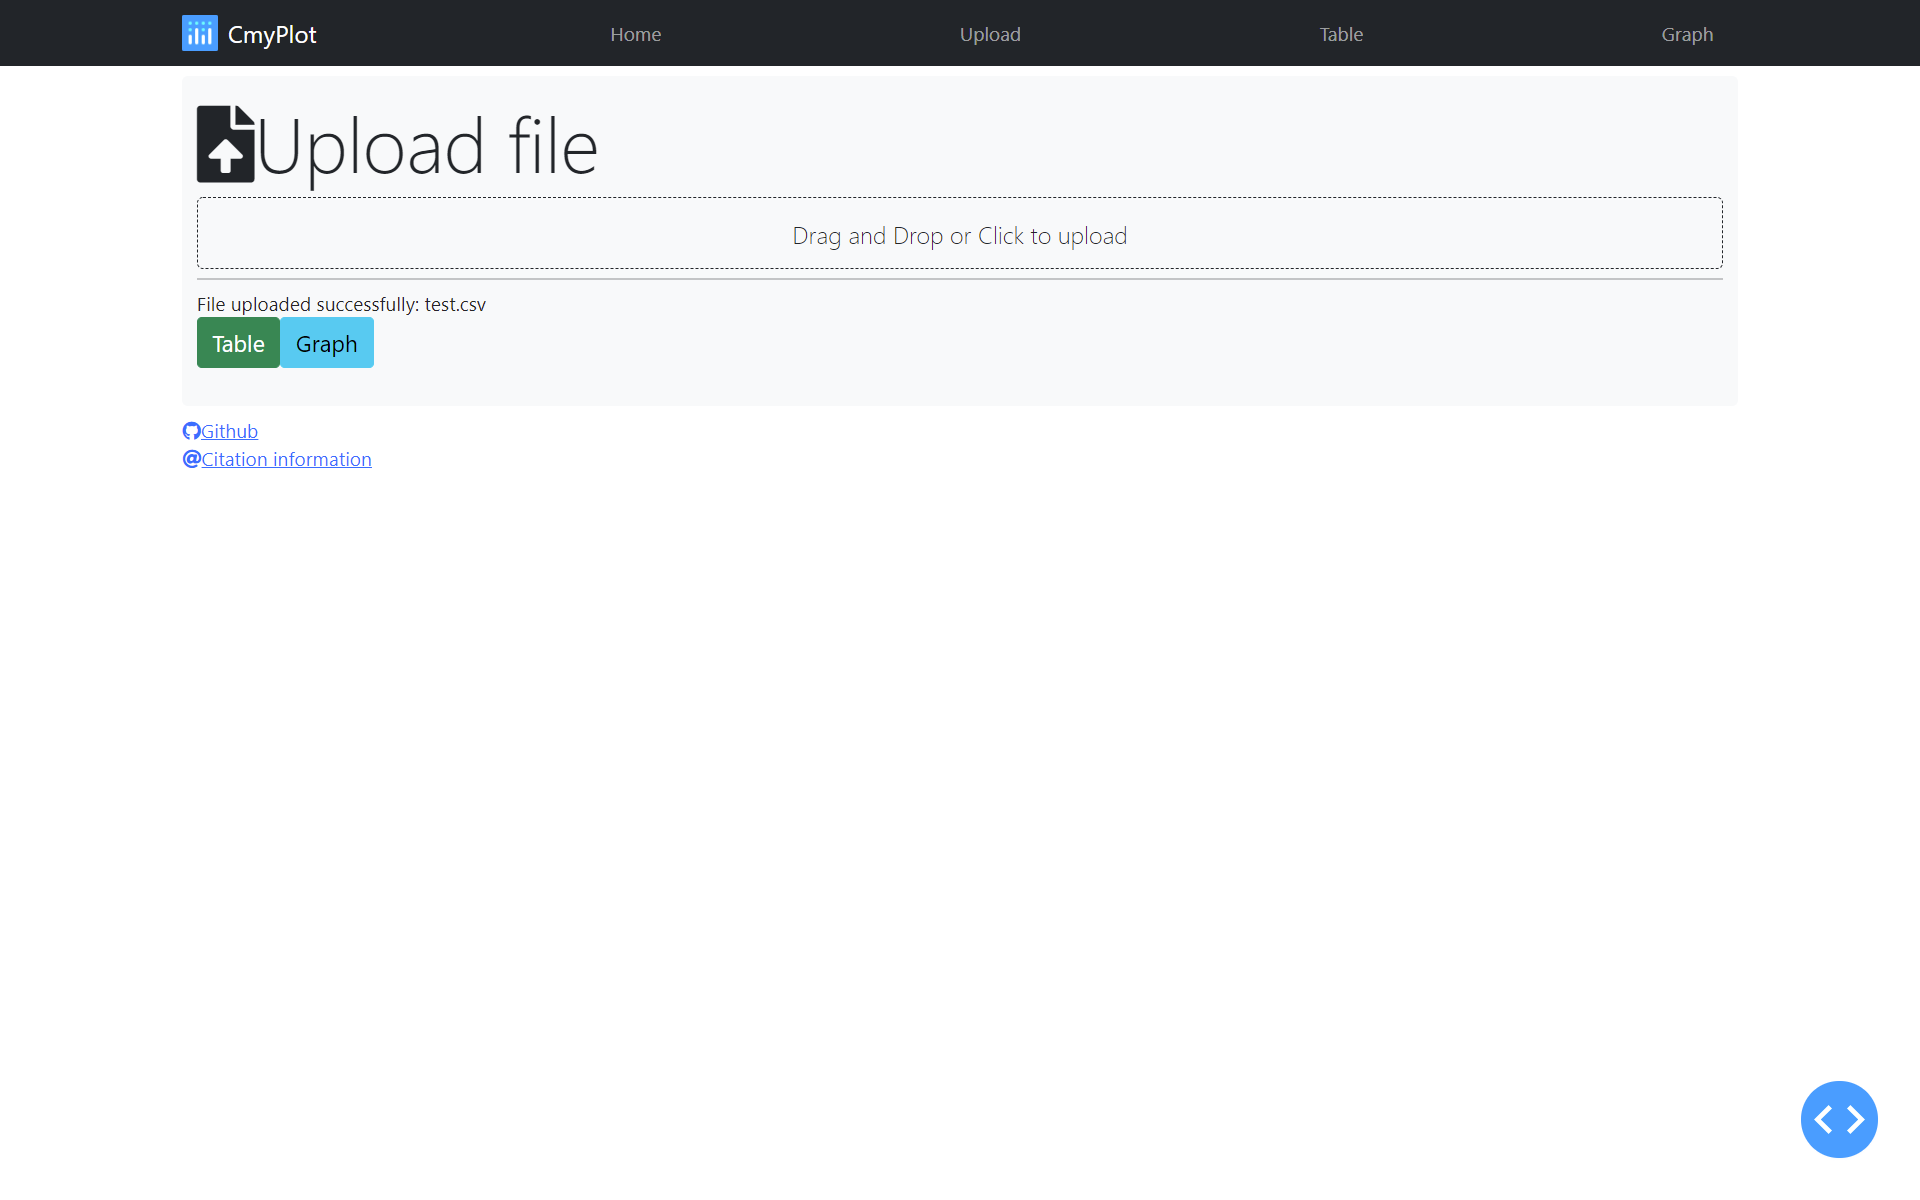
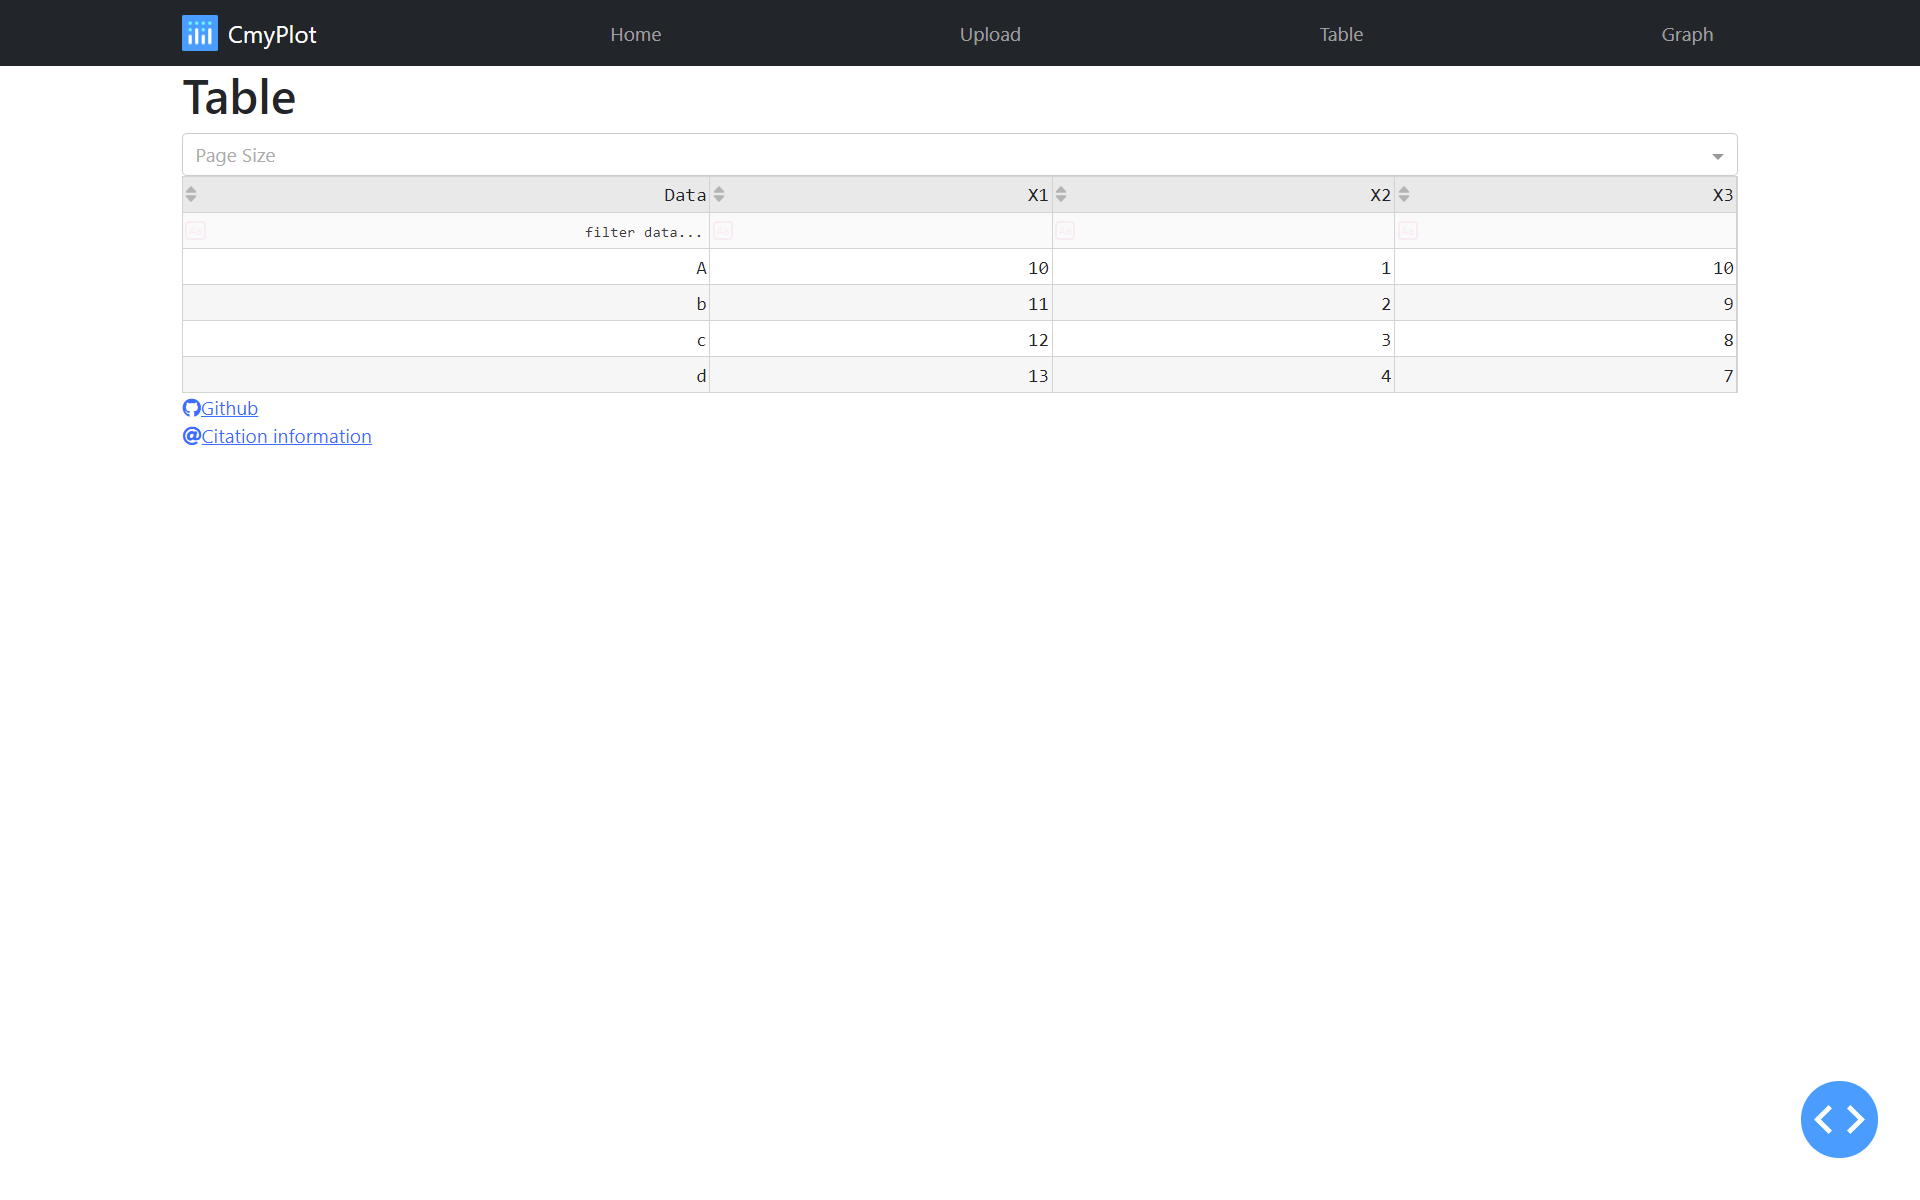
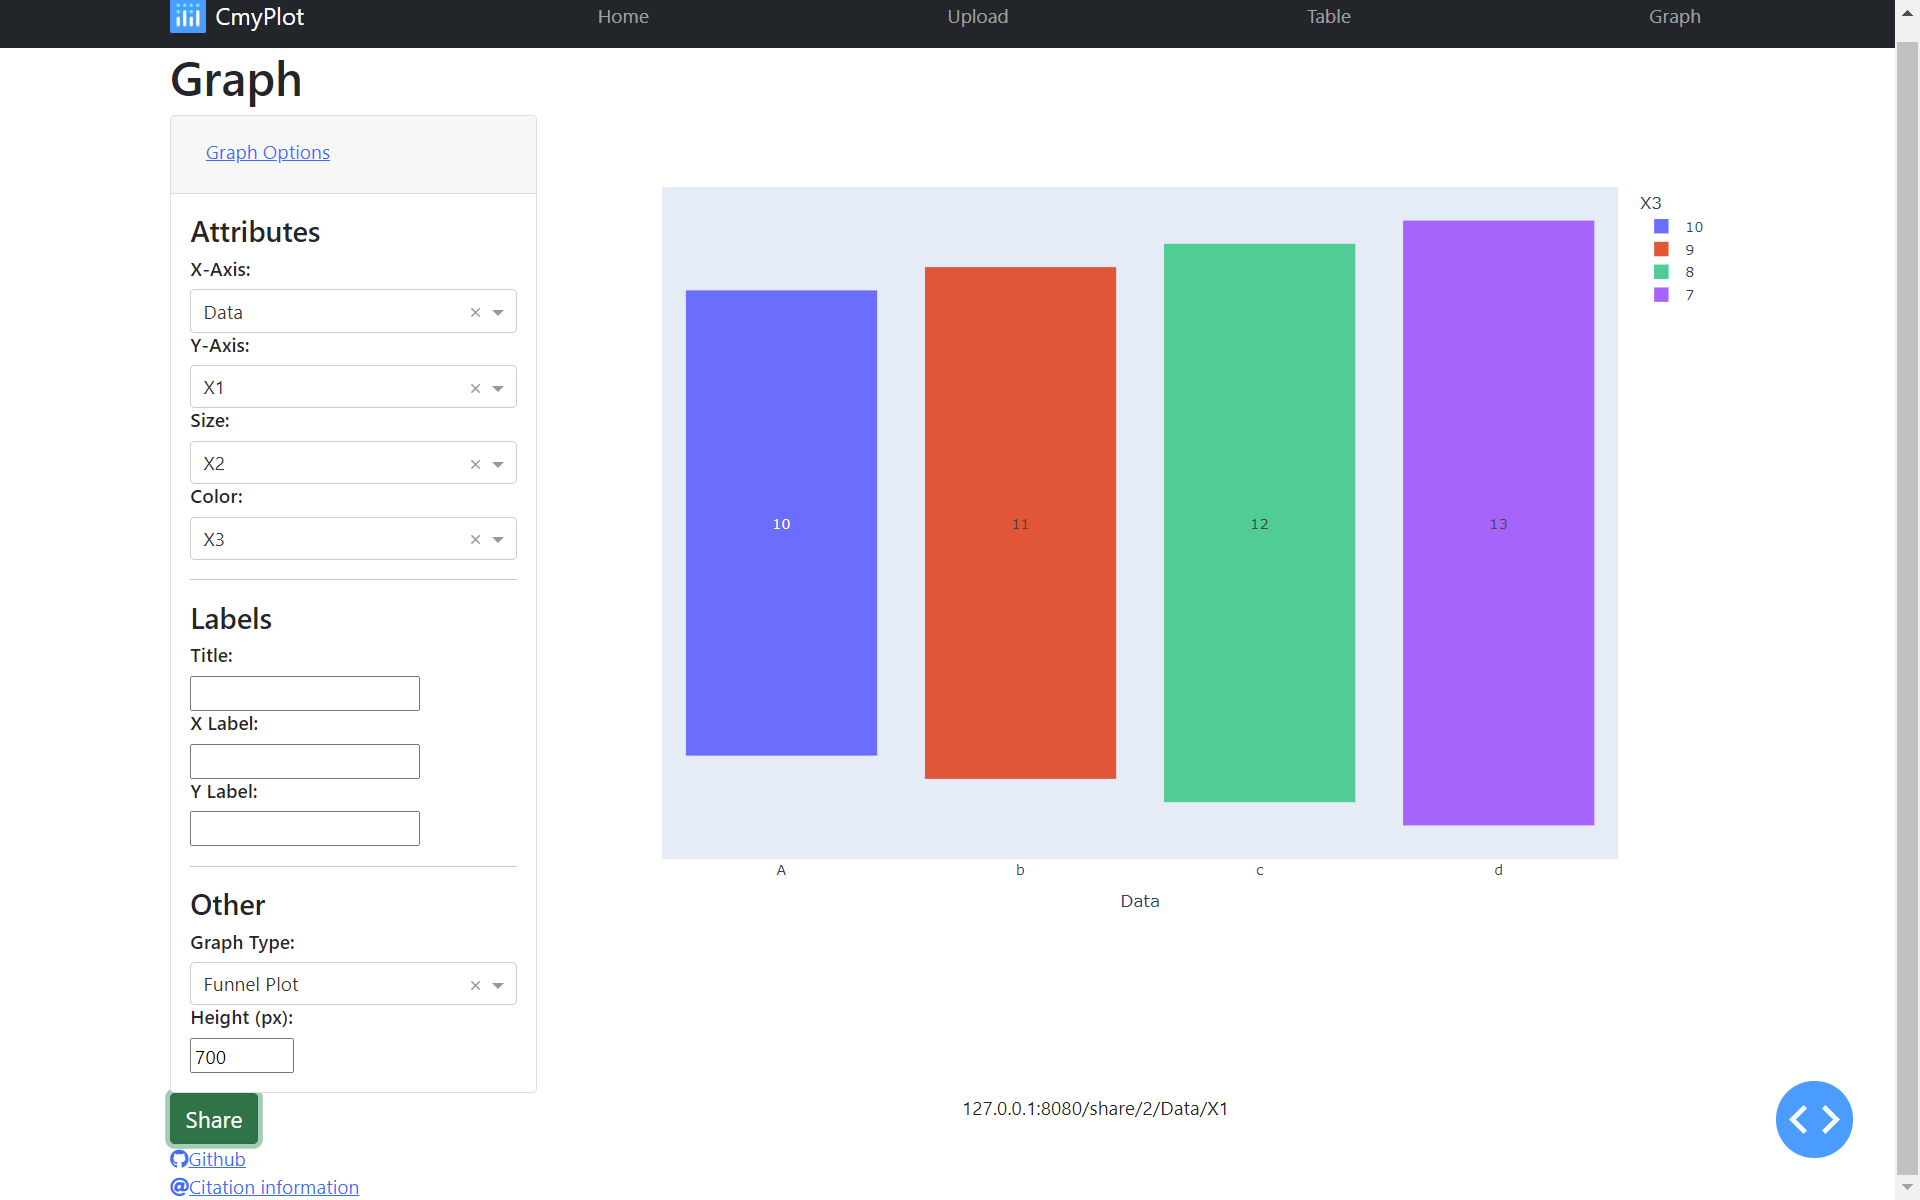
CmyPlot is a web app that provides interface for uploading a csv data file and convert it into Tables and interesting graphs with one click
-
Built with

-
Language used: Python
-
Libraries used: Flask, Plotly, Dash
-
Development/ Debug Server: Flask
-
Production Server: Waitress
-
Deployment Platform: Heroku
Note: The application has been deployed on Heroku (free platform service). The app's usage is limited to monthly pool of free dyno hours. Also, free apps sleep automatically after 30 mins of inactivity to conserve your dyno hours.
Visual Walkthrough:
What's new?
Docs
Quick look:
Give it a try yourself: https://cmyplot.herokuapp.com/
(Heroku server may take long to respond first time, if no traffic within last 30 minutes).
Getting started:
-
Prerequisite:
- Download Python3.x on your system.
-
Installation:
E.g If you downloaded
Python 3.9.7above, thenSteps to setup virtual environment
-
Create a virtual environment:
python3.9 -m venv project1_env -
Activate the virtual environment:
source project1_env/bin/activate -
Build the virtual environment:(must be present in project directory)
pip install -r requirements.txt
-
-
Run Instructions
To run/test the site locally:
-
Clone this (CmyPlot) github repo.
-
Navigate to project directory.
-
Create a virtual environment:
python -m venv project1_env -
Activate the virtual environment:
source project1_env/bin/activate -
Build the virtual environment:
pip install -r requirements.txt -
Run:
python src/plotting/index.py -
Site will be hosted at:
http://127.0.0.1:8085/
-
Future Scope 🐾
There are multiple dimensions to this project catering to the interests of Various developers. Please check CONTRIBUTING.md and CODE_OF_CONDUCT.md for contributing rules
- Resolve the existing issues.
- Add more functionality in Graph and Table visuals to give more flexibility to user to interact with data.
- Tables can be made editable to interact with data and visualize cause and effects for the given data.
- If you're an ML enthusiast, basic machine learning models can be implemented to identify patterns in the data.


