q3dviewer is a library designed for quickly deploying a 3D viewer. It is based on Qt (pyside6) and provides efficient OpenGL items for displaying 3D objects (e.g., point clouds, cameras, and 3D Gaussians). You can use it to visualize your 3D data or set up an efficient viewer application. It is inspired by PyQtGraph, but it focuses more on efficient 3D rendering.
To install q3dviewer, execute the following command in your terminal on either Linux or Windows:
pip install q3dviewer- Ensure that you have a Python 3 environment set up:
- Download and install Python 3 from the official Python website.
- During installation, make sure to check the "Add Python to PATH" option.
Once installed, you can directly use the following tools:
A tool for visualizing point cloud files. Launch it by executing the following command in your terminal:
cloud_viewer  # The viewer will be displayed
# Use the command below if the path is not set, though it's not recommended
python3 -m q3dviewer.tools.cloud_viewer
After the viewer launches, you can drag and drop files onto the window to display the point clouds. Multiple files can be dropped simultaneously to view them together. Supported formats include LAS, PCD, PLY, and E57.
For example, you can download and check point clouds of Tokyo in LAS format from the following link:

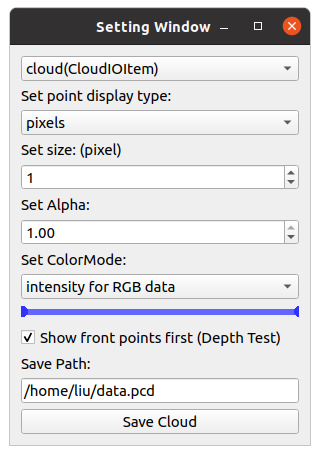
Press M on your keyboard to display a menu on the screen, where you can modify visualization settings for each item. You can adjust various settings such as shape, size, color, and transparency of the point clouds.
A high-performance SLAM viewer with strong compatibility with ROS, serving as an alternative to RVIZ.
roscore &
ros_viewerA simple viewer for 3D Gaussian. see: https://github.com/scomup/EasyGaussianSplatting
gaussian_viewer # Drag and drop your Gaussian file onto the window
A tool to compute the relative pose between two LiDARs. It allows for both manual adjustment in the settings screen and automatic calibration.
lidar_calib --lidar0=/YOUR_LIDAR0_TOPIC --lidar1=/YOUR_LIDAR1_TOPIC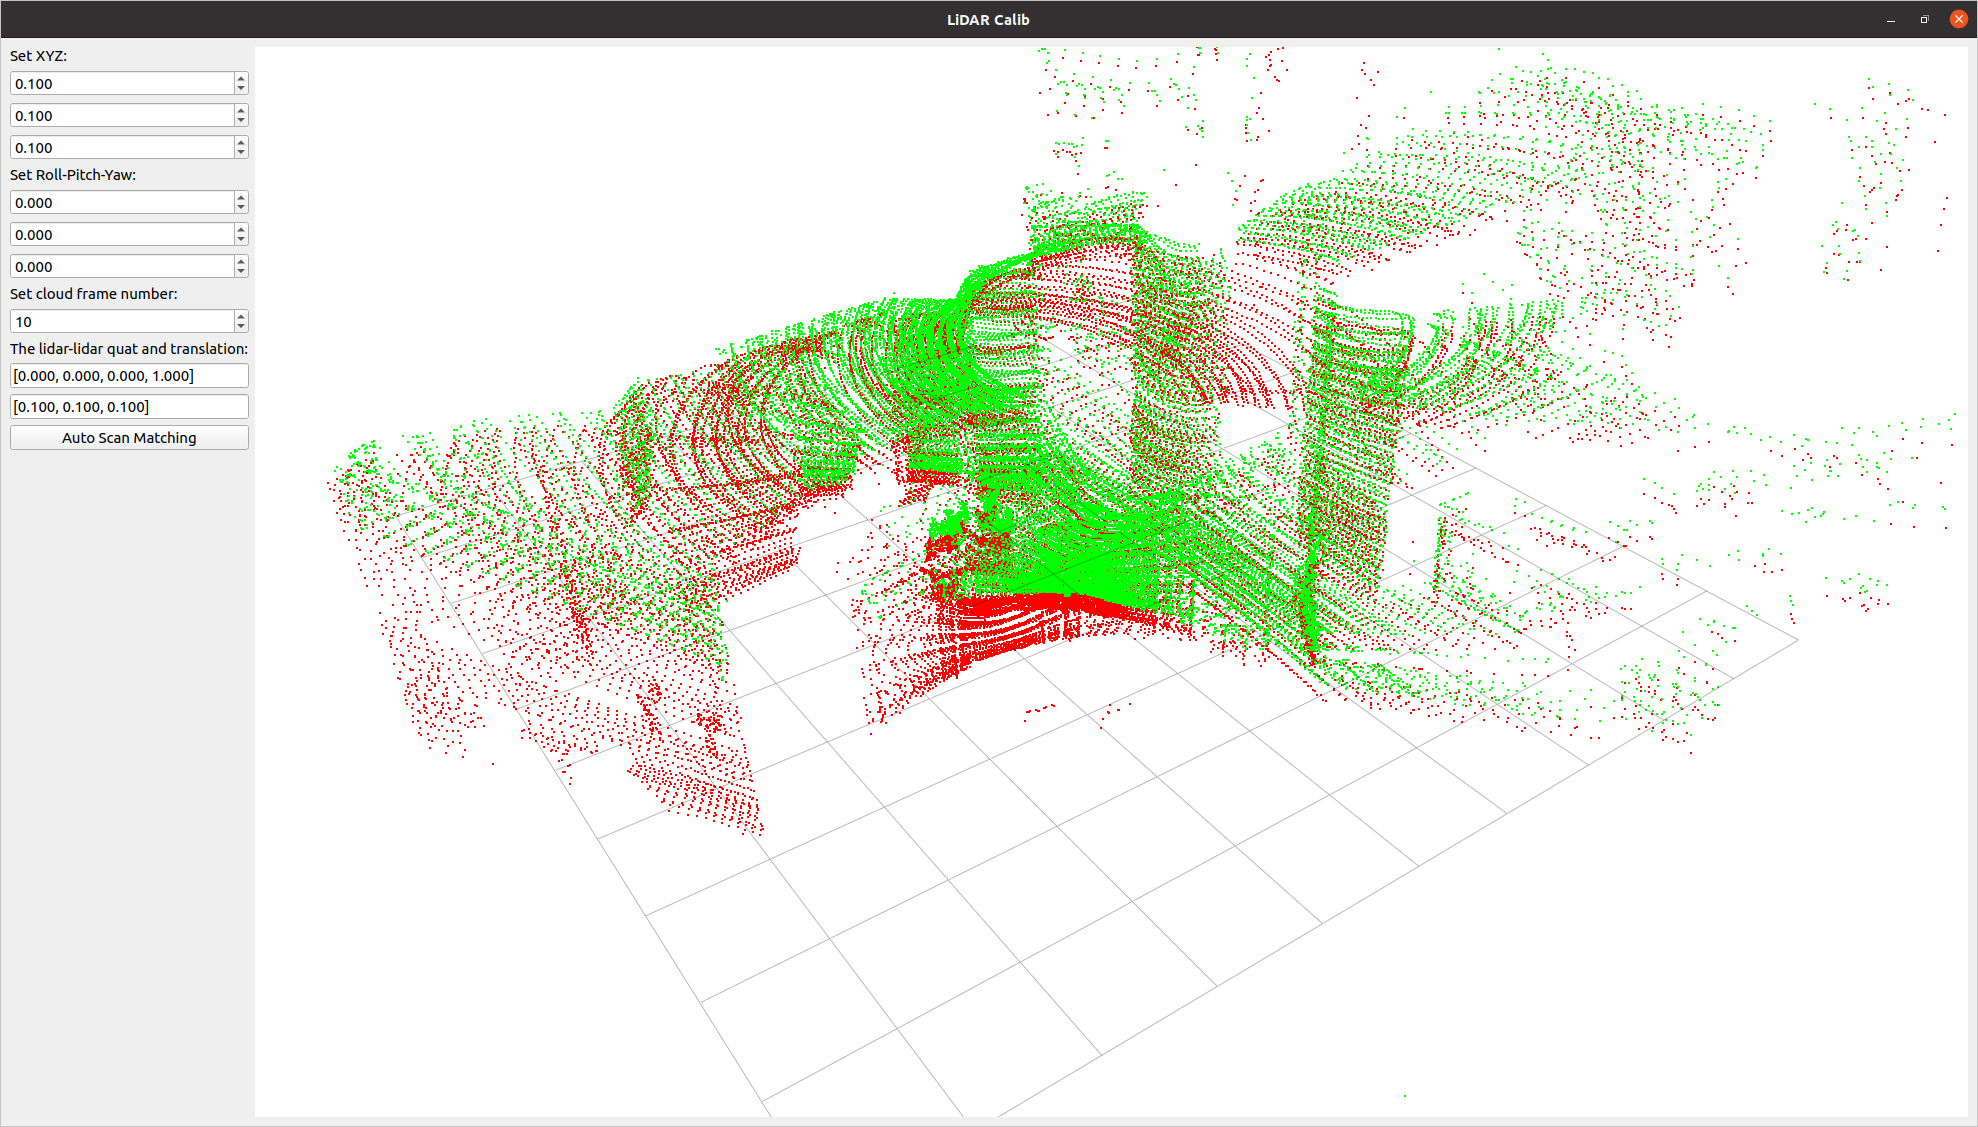
A tool for calculating the relative pose between a LiDAR and a camera. It allows for manual adjustment in the settings screen and real-time verification of LiDAR point projection onto images.
lidar_cam_calib --lidar=/YOUR_LIDAR_TOPIC --camera=/YOUR_CAMERA_TOPIC --camera_info=/YOUR_CAMERA_INFO_TOPIC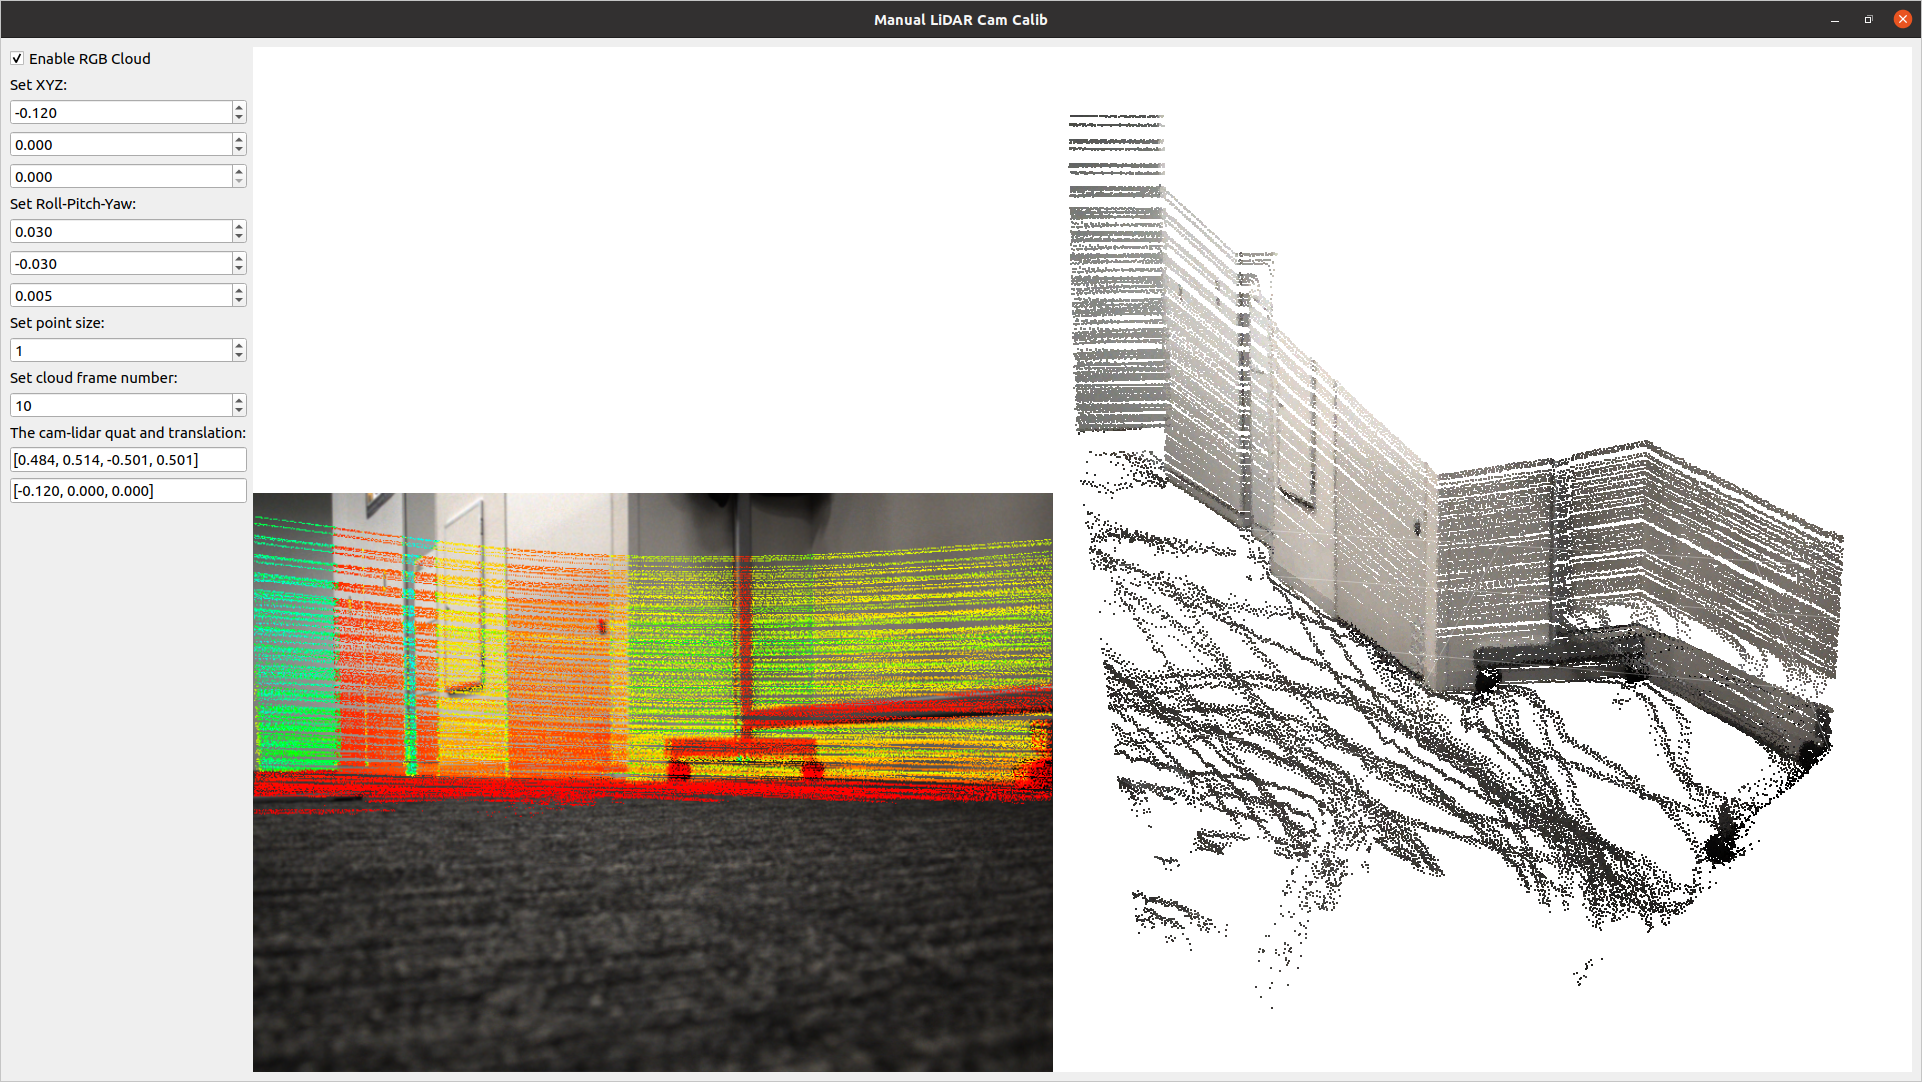
Using the examples above, you can easily customize and develop your own 3D viewer with q3dviewer. Below is a coding example.
#!/usr/bin/env python3

import q3dviewer as q3d  # Import q3dviewer

def main():
    # Create a Qt application
    app = q3d.QApplication([])

    # Create various 3D items
    axis_item = q3d.AxisItem(size=0.5, width=5)
    grid_item = q3d.GridItem(size=10, spacing=1)

    # Create a viewer
    viewer = q3d.Viewer(name='example')
    # Add items to the viewer
    viewer.add_items({
        'grid': grid_item,
        'axis': axis_item,
    })

    # Show the viewer & run the Qt application
    viewer.show()
    app.exec()

if __name__ == '__main__':
    main()
q3dviewer provides the following 3D items:
- AxisItem: Displaying coordinate axes or self-position
- CloudItem: Displaying point clouds
- CloudIOItem: Displaying point clouds with I/O capabilities
- GaussianItem: Displaying 3D Gaussians
- GridItem: Displaying grids
- ImageItem: Displaying 2D images
- Text2DItem: Displaying 2D text
- LineItem: Displaying lines or trajectories
In addition to the standard 3D items provided, you can visualize custom 3D items with simple coding. Below is a sample:
from OpenGL.GL import *
import numpy as np
import q3dviewer as q3d
from PySide6.QtWidgets import QLabel, QSpinBox

class YourItem(q3d.BaseItem):
    def __init__(self):
        super(YourItem, self).__init__()
        pass  # Necessary initialization

    def add_setting(self, layout):
        # Initialize the settings screen
        label = QLabel("Add your setting:")
        layout.addWidget(label)
        box = QSpinBox()
        layout.addWidget(box)

    def set_data(self, data):
        pass  # Obtain the data you want to visualize

    def initialize_gl(self):
        pass  # OpenGL initialization settings (if needed)

    def paint(self):
        pass  # Visualize 3D objects using OpenGL
Enjoy using q3dviewer!