/p5-wave-visualization

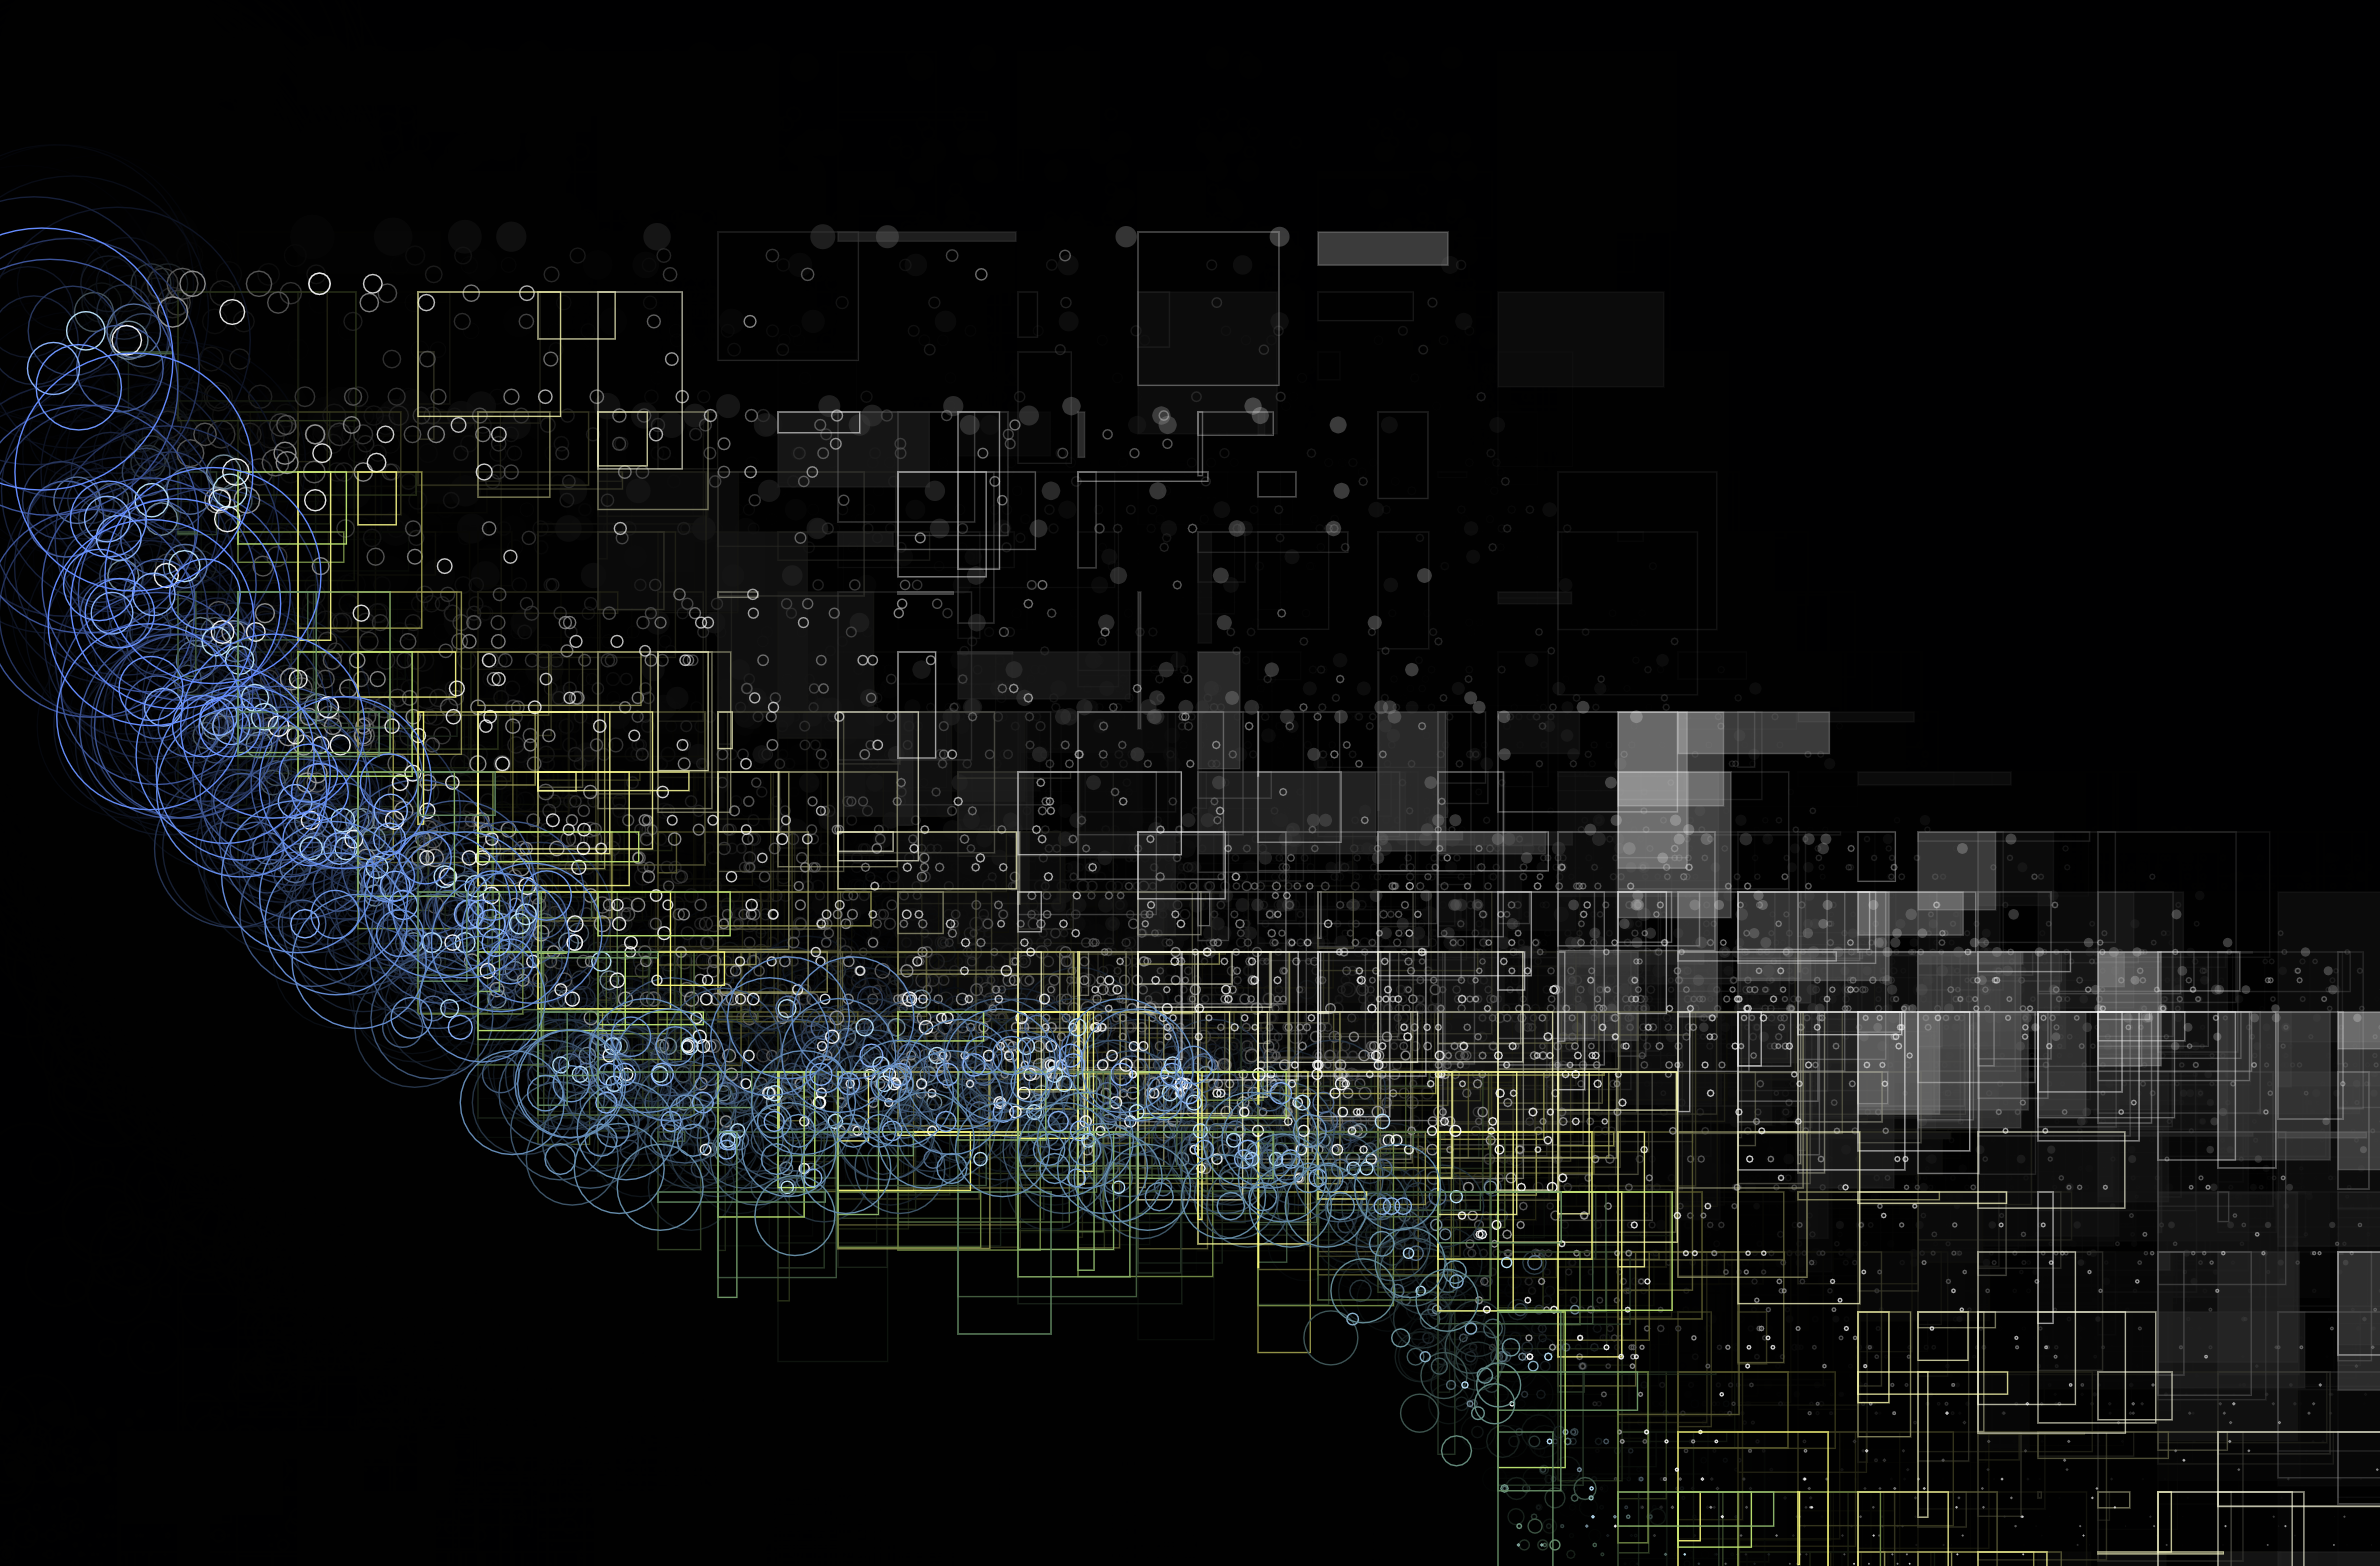
p5 sketch visualizing the sound of waves of the sea recorded at Yuigahama in Kamakura, which is processed with FFT.

Primary LanguageJavaScriptMIT LicenseMIT

Visualization art using p5.js based on the sound of waves

This p5 sketch visualizes the sound of waves of the sea recorded at Yuigahama in Kamakura, which is processed with FFT.

Sketches

#1 Sound spectrum visualizer

fft See video on YouTube

#2 Raindrop

wave See video on YouTube

Usage

Install http server

If you don't have any http server, install simplehttpserver from npm:

npm -g simplehttpserver -g

Launch http server

git clone git@github.com:noradaiko/p5-wave-visualization.git
cd p5-wave-visualization
simplehttpserver ./

Open on web browser

#1 Sound spectrum visualizer

http://localhost:8000/fft

#2 Raindrop

http://localhost:8000/wave