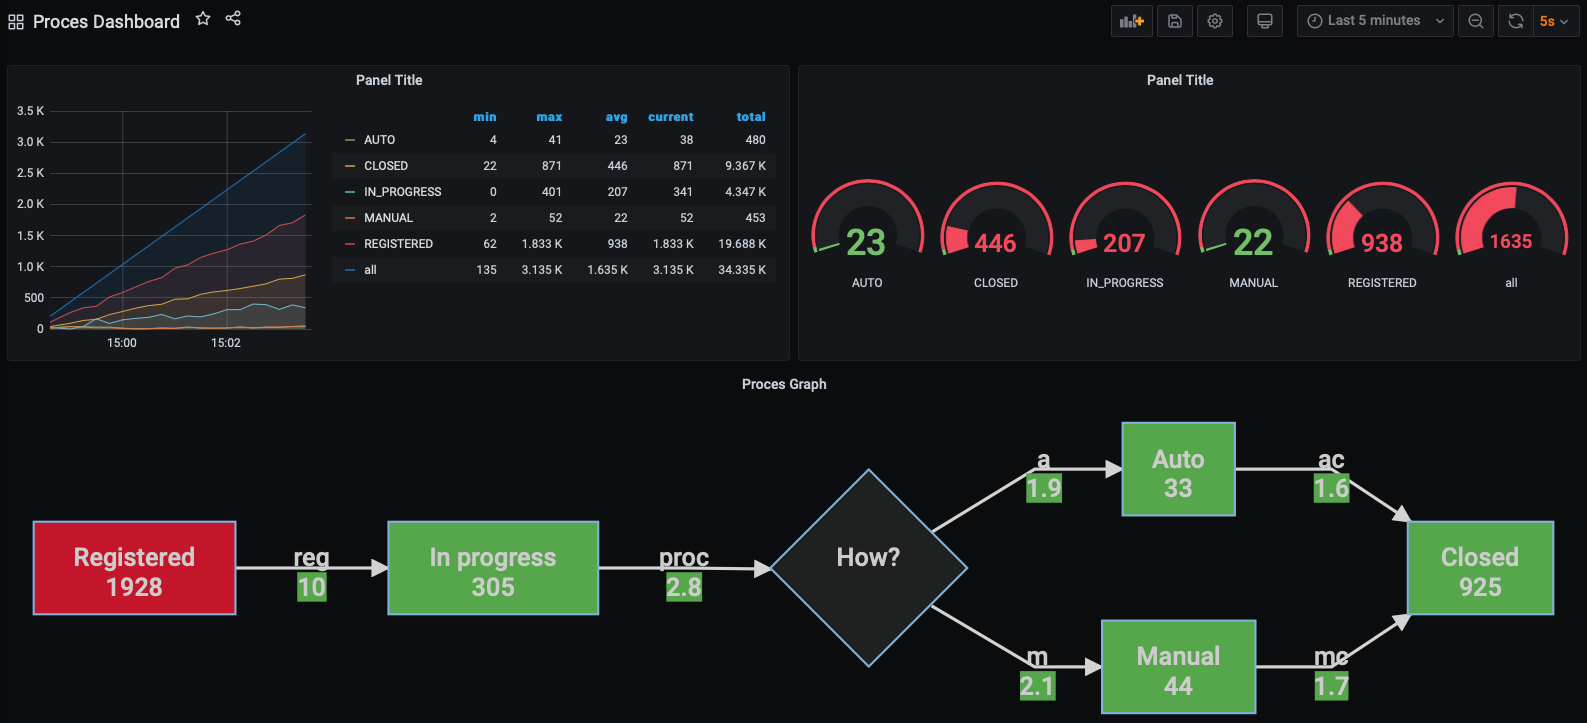
This project demonstrates how to connect well-known monitoring tools with Spring-Boot App. It shows how these tools can use the metrics and logs that the application produces to monitor the application.
For this purpose, a simple process with few stages has been implemented in the application. Process is persisted in a PostgreSQL. This process automatically starts and moves to next steps (it is scheduled).
Process, and it's stages are monitored and metrics are exposed with Prometheus. Logs form application are sent from docker via Logstash to the Elasticsearch. You can search them in Kibana. Prometheus and Elasticsearch are connected as data sources to Grafana where dashboards for process and application monitoring are available.
This repository contains:
- Spring Boot Web Application
- configured:
- logging in JSON
- logging to Logstash
- database connection
- building docker image with jib & distroless
- exposing metrics with prometheus endpoint
/actuator/prometheus
- implemented:
- entity representing process with few stages
- scheduled jobs that initiate new processes and move processes to next stages automatically (can be configured in application.yaml or via environment variables in docker-compose.yaml)
- custom micrometer metrics for measuring database tables state (e.g. table row count with filtering)
- how many processes are in each state
- how many transitions between stages happen
- configured:
- PostgreSQL + pgAdmin
- Prometheus
- preconfigured with scrapping web-app metrics in prometheus.yaml
- Grafana
- preloaded prometheus and elasticsearch datasource from datasources.yaml
- preloaded dashboard dashboards.yaml and dashboards directory
- Dashboard to track process progress based on metrics from prometheus and logs from elasticsearch
- JVM micrometer dashboard
- Spring Boot Statistic dashboard
- ELK - Logging stack
- Elasticsearch
- configured as single node instance
- Logstash - preconfigured with logstash.conf
- exposing UDP port for logs receiving
- sending logs to elasticsearch
- filtering JSON messages from web-app and parsing it into fields for better searchability and monitoring
- Kibana
- preconfigured with connection to elasticsearch
- indices from elasticsearch are available for searching
- Elasticsearch
Copy .env.example as .env and edit properties you want.
You need to set HOST_IP variable with your host IP to send your logs to Logstash. You can get your IP with command below.
cd docker-compose
sed "s/todo_set_me_up/$(ifconfig | grep "inet " | grep -v 127.0.0.1 | cut -d\  -f2)/g" .env.example > .env
If needed you can change web app image name in build.gradle.kts and .env.
Build web app image.
./gradlew jibDockerBuildRun monitoring stack
cd docker-compose
docker-compose up -dFew minutes after running you should be able to open in browser
Elasticsearch's indices at: http://localhost:9200/_cat/indices?v
Kibana connected to elasticsearch at: http://localhost:5601
Web App with prometheus metrics: http://localhost:8080/actuator/prometheus
Grafana with preloaded data sources and dashboards at: http://localhost:3000/
pgAdmin able to connect to PostgreSQL at: http://localhost:8070/
- fix problem with elasticsearch index health=yellow
- add Sleuth
- add traefik
- add jaeger
